ShowCandleLowTimeframe
- Indicatori
- Versione: 1.10
- Attivazioni: 5

Full description
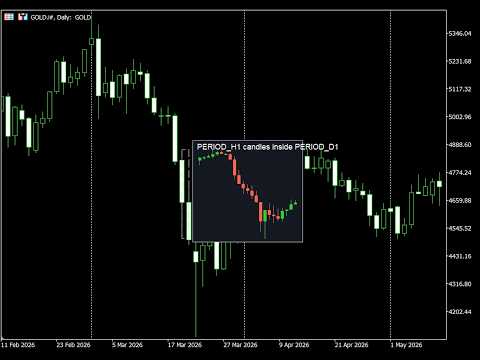
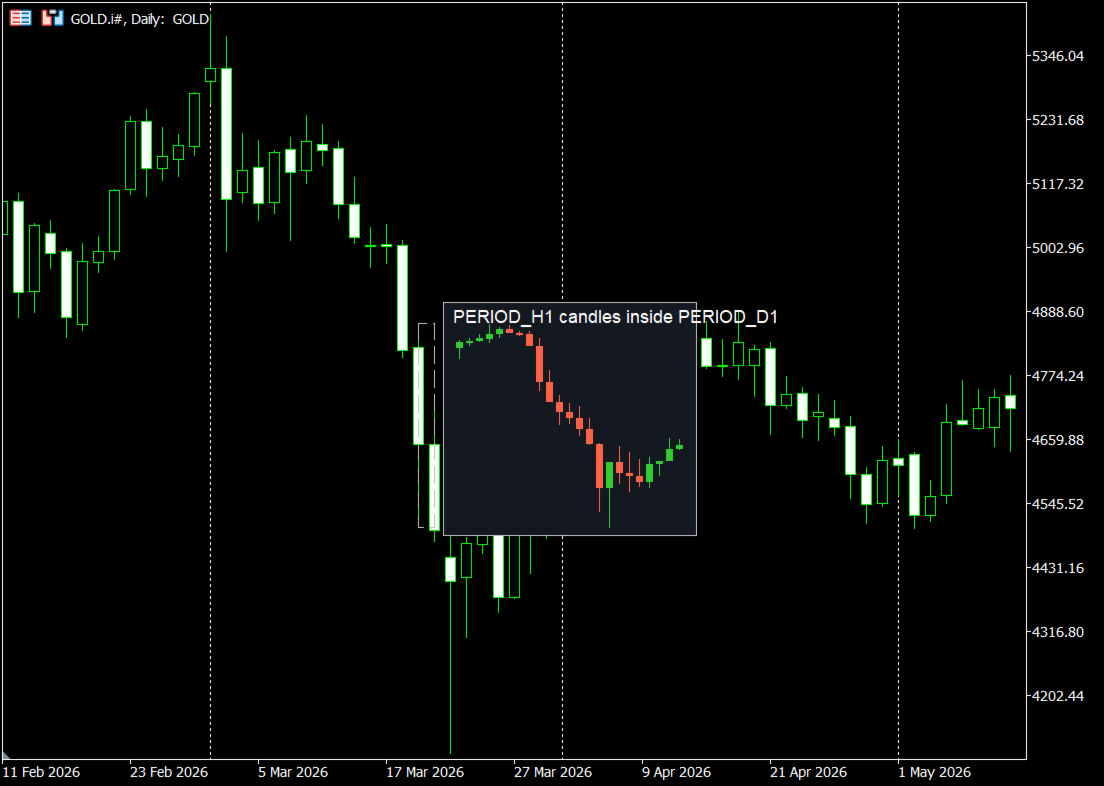
Selected Candle Lower TF helps you inspect what happened inside a higher-timeframe candle without leaving the chart.
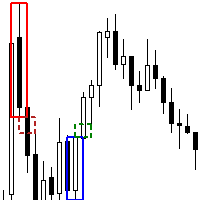
Click any bar on the main chart and the indicator draws the lower-timeframe candles that formed during that bar. You can place the preview panel to the left or right of the selected candle. In these modes, the child candles are price-aligned with the parent bar: highs and lows line up horizontally with the chart’s price scale, so comparison is visual and immediate.
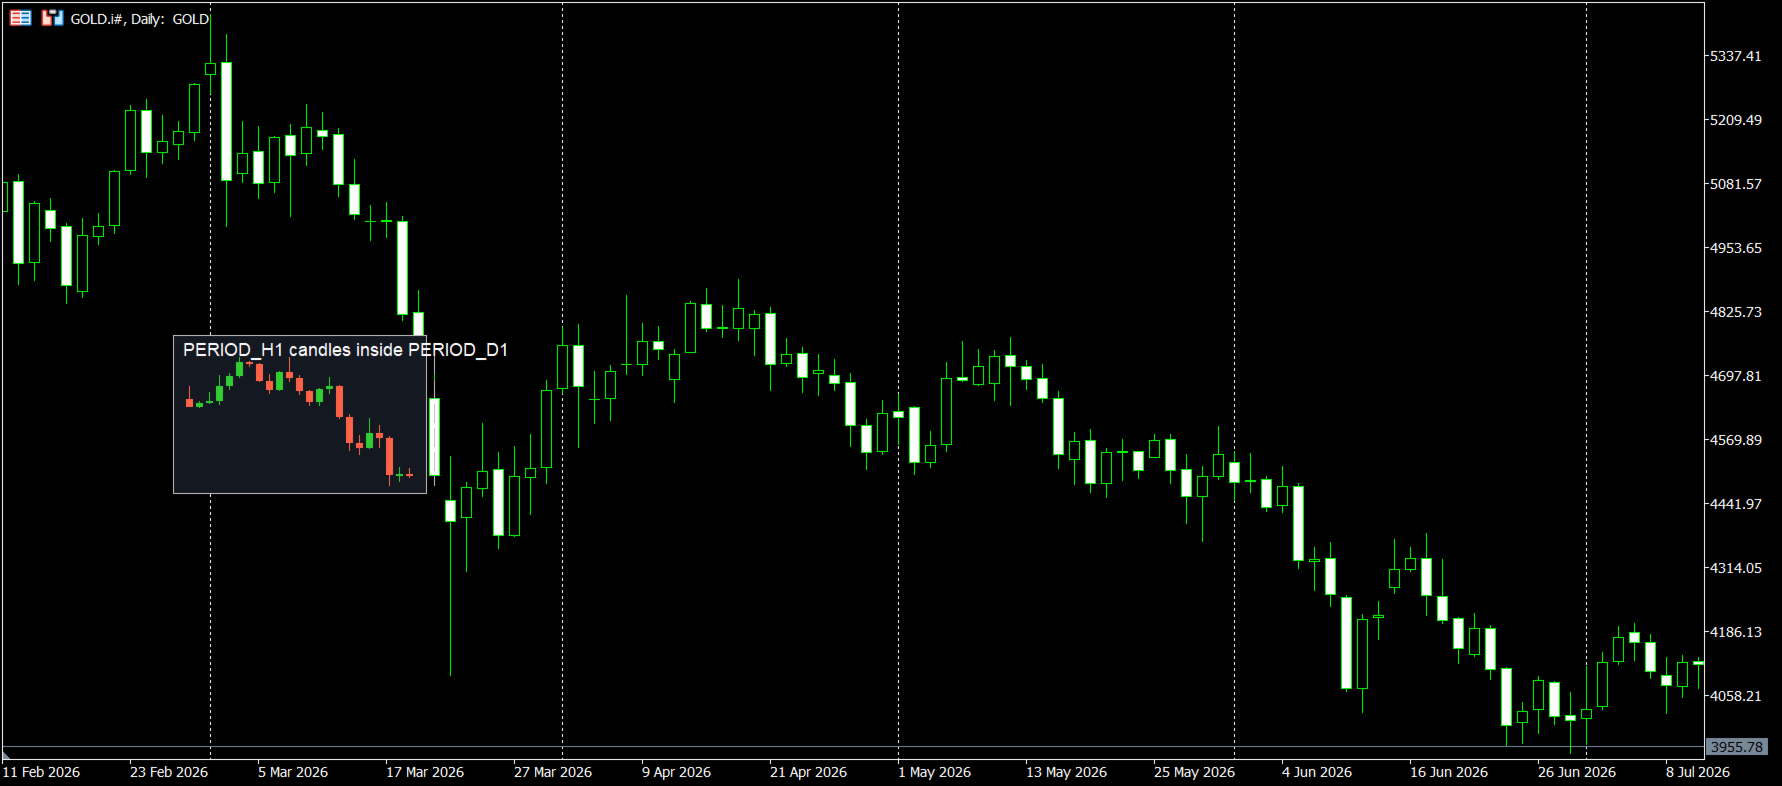
A legacy center-top floating panel mode is also available if you prefer a fixed overlay.
Why it’s useful
- Understand the internal structure of a daily/H4/H1 candle in seconds
- Spot impulse, pullback, rejection, and consolidation inside the selected bar
- Keep context: stay on the higher timeframe while reading lower-TF detail
- Faster analysis than opening a second chart and scrolling to the same period
How to use
- Attach the indicator to any chart.
- Set the child timeframe (e.g. H1 inside D1, M5 inside H1).
- Choose panel position: Right / Left (price-aligned) or Center top.
- Click a candle — the lower-TF candles appear in the panel.
- Zoom or scroll; the panel redraws and stays aligned.
Key features
- One-click candle selection
- Lower-TF candle preview for the selected bar range
- Panel position: left / right of selected bar, or center-top
- True price alignment with parent high/low (side modes)
- Custom bull/bear colors, wick display, bar width and spacing
- Auto-refresh on chart zoom, scroll, and scale changes
- Lightweight chart-window indicator (no extra subwindow)
Inputs
- Child candle timeframe — lower TF to display
- Panel position — Center top / Left of bar / Right of bar
- Child candle width / spacing — panel candle layout
- Gap from selected bar — distance in side modes
- Panel height / top — used only in center-top mode
- Title padding — space for the panel title
- Colors — bull, bear, panel background, border
- Show wicks — on/off
Notes
- Requires enough history for the selected lower timeframe.
- Side modes follow the selected bar’s screen position; if the bar is near the edge, the panel is kept inside the visible chart area.
- Designed for analysis and education; it does not generate trade signals.
Highlight / bullet ngắn (phần “What’s new” hoặc feature list)
- Click-to-inspect any candle
- Lower TF candles for the exact selected period
- Left/Right panel next to the bar
- Price-aligned with parent high & low
- Optional classic center-top overlay
- Fully customizable look