Optimization Robustness Map
- Utilità
-
Mohamed-amine Baddir
 Sviluppo Expert Advisor per MetaTrader 5 e li testo correttamente prima che tu li utilizzi per fare trading.
Cosa faccio:
- Trasformo la tua strategia, il tuo script TradingView o le tue regole scritte in un Expert Advisor MT5 pulito - Versione: 1.0
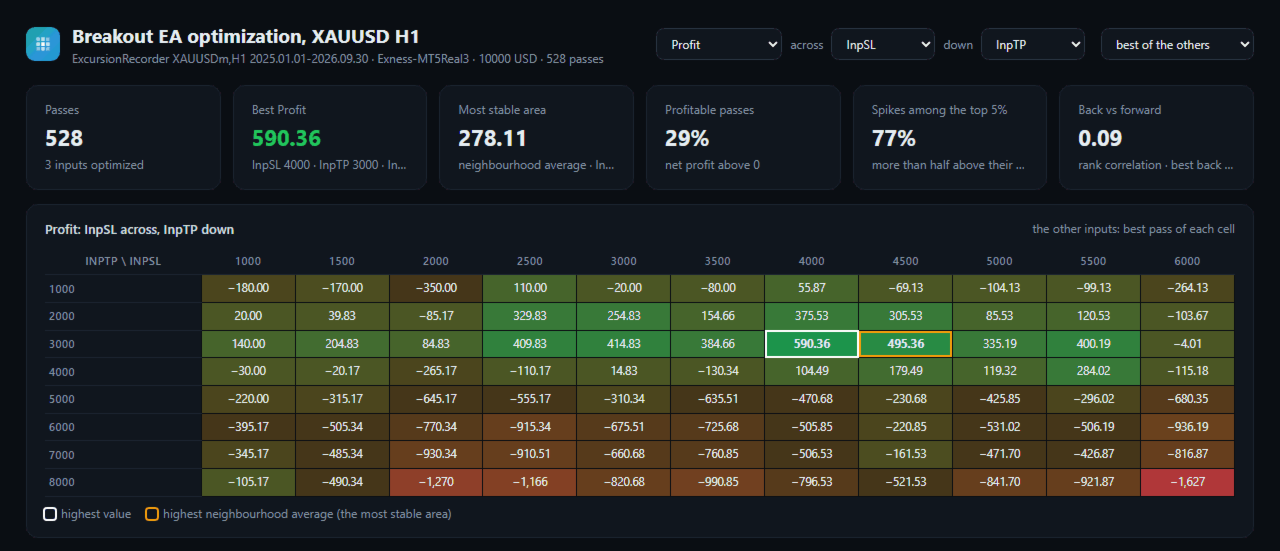
Optimization Robustness Map reads the results of a Strategy Tester optimization and shows whether the best pass sits on a plateau, where nearby inputs give similar results, or on a lone spike that a small change destroys. It draws a heat map of any two inputs, compares every pass with its neighbours, shows how each input moves the result and, when a forward period was tested, how well the back test predicted it. Everything is written to one HTML page.
How To Use
- In the Strategy Tester, after an optimization: Optimization results tab > right click > Export to XML. Save the file into MQL5\Files\OptimizationMap (File > Open Data Folder). With a forward period, also export the Forward results tab the same way, under the same name followed by .forward.xml (the Strategy Tester proposes this name).
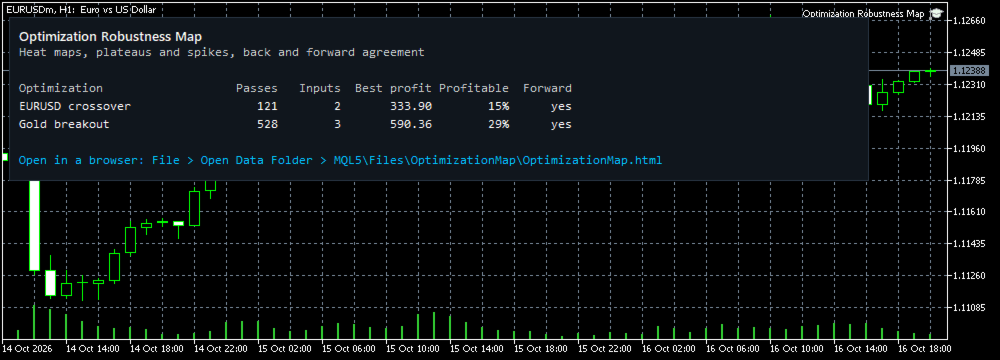
- Attach Optimization Robustness Map to any chart. Open MQL5\Files\OptimizationMap\OptimizationMap.html in any browser.
- At the top of the page, choose the optimization, the value to show (profit, profit factor, recovery factor, Sharpe ratio, drawdown, trades, result) and the two inputs of the map.
What The Page Shows
- A heat map of two inputs; with three inputs or more, each cell shows the best or the median pass of the other inputs.
- The highest pass and the most stable area (the highest neighbourhood average) marked on the map.
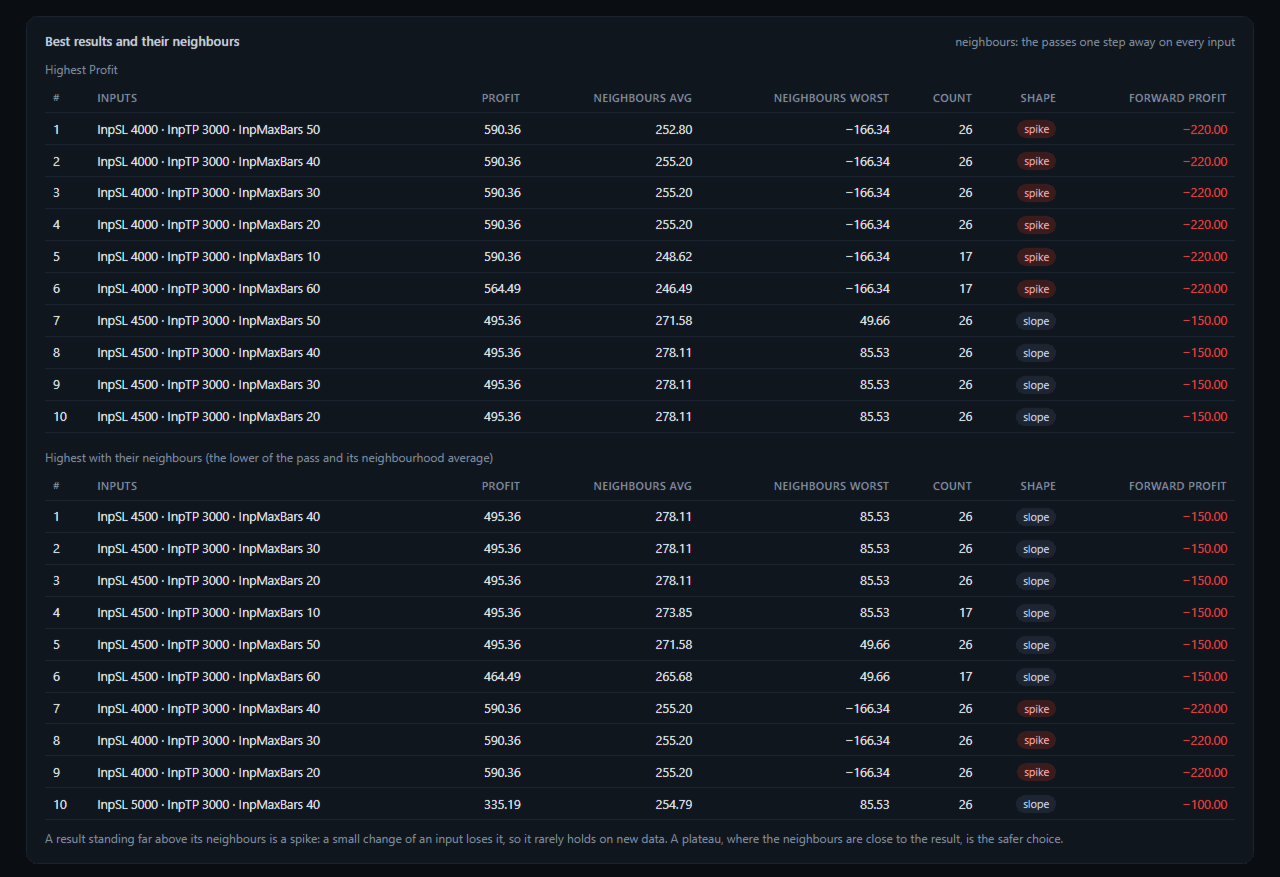
- The 10 best passes with the average and the worst of their neighbours, each marked as plateau, slope or spike.
- The 10 best passes ranked by the lower of their own result and their neighbourhood average.
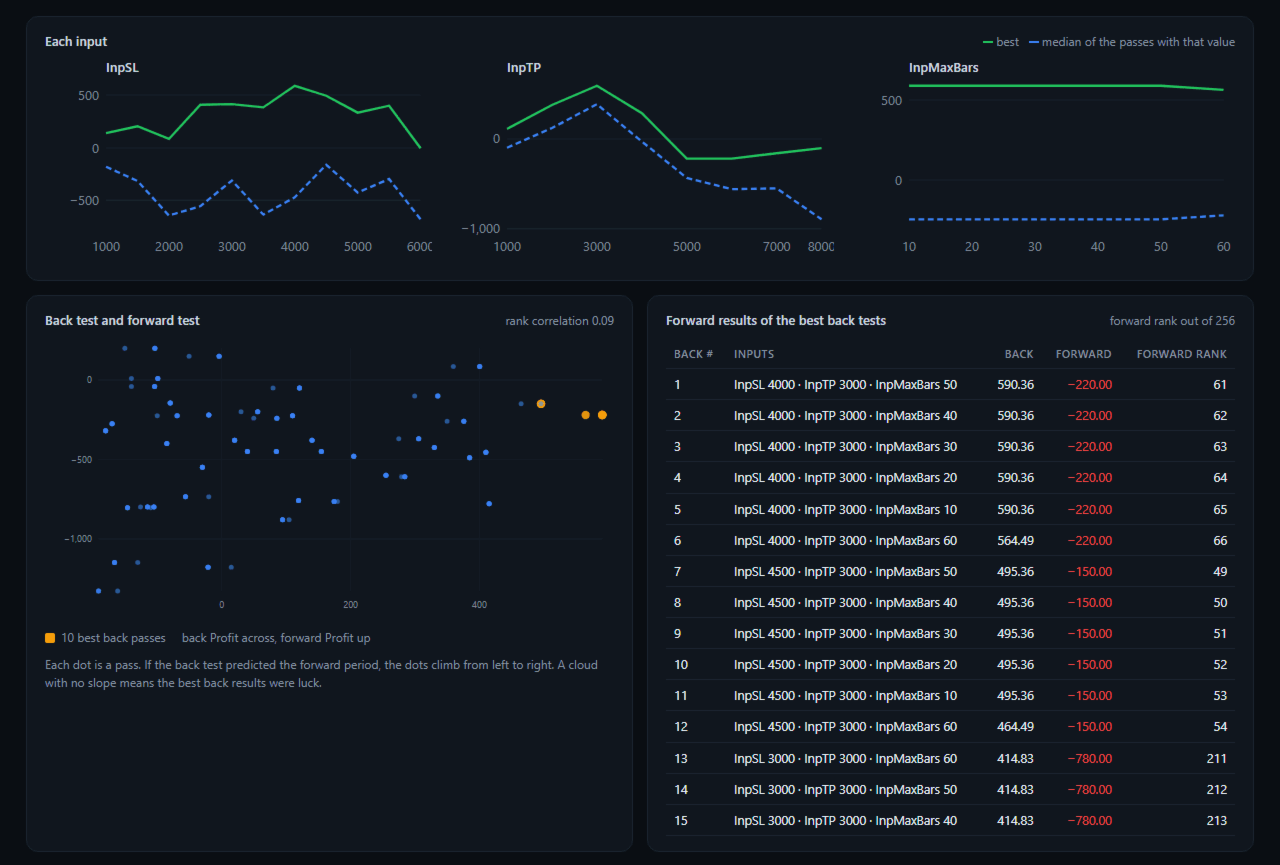
- For each input: the best and the median result at each of its values. A flat line shows an input that does not matter.
- Back and forward: every pass as a dot, the rank correlation of back and forward results, and the forward rank of the 15 best back passes.
- Headline figures: passes, best value, most stable area, share of profitable passes, share of spikes among the top 5%.
Good To Know
- Neighbours are the passes one step away on every optimized input (up to 6 inputs; with more, one input at a time).
- Works with complete and genetic optimizations; genetic ones have fewer neighbours per pass.
- Several optimizations can be compared in the same folder (up to 24 files and 200,000 passes per file).
- Files of other terminal languages are read by column position.
- The page is one file with no internet access needed. The utility reads files only. It does not trade and does not change any setting.
- The demo runs in the Strategy Tester: put exported files into the common folder Files\OptimizationMap (File > Open Common Data Folder); the page is written when the test ends.
- A plateau is a better candidate than a spike, but it does not promise future results. The screenshots show optimizations of an example strategy: in them the best back passes lost money in the forward period.
- To see why an Expert Advisor earns a different amount live than in the backtest, trade by trade, see Backtest vs Live by the same author.
Inputs
- Folder in MQL5\Files with the exported results
- Or the files, separated by ;
- Folder in the common Files folder of all terminals
- Page title