Triple Period VWAP
- Indicatori
- Versione: 1.10
- Aggiornato: 22 agosto 2026
- Attivazioni: 5

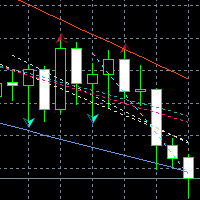
Triple Period VWAP plots three Volume Weighted Average Price lines at once: daily, weekly and monthly. Each line resets automatically at the start of its own period instead of rolling continuously, so you always see where the average price stands for the current day, the current week and the current month side by side.
Colors follow a familiar convention: magenta for the daily line, blue for the weekly line, and dark green for the monthly line. Line width and colors are configurable.
Features:
- Three independent VWAP periods on the same chart: daily, weekly and monthly.
- Each line resets exactly at the start of its period, no manual action needed.
- Zero configuration required to get started.
- Works on any symbol, timeframe and account type.
How traders use it:
Each VWAP line acts as a reference for the average price paid by market participants over that specific period. Price trading above all three lines is often read as broad strength across timeframes, while price below all three suggests broad weakness. Comparing where price sits relative to the daily, weekly and monthly lines helps frame the current move within shorter and longer term context at the same time.
This is a visual analysis tool. It does not open, modify or close trades.