Supply Demand Matrix
- Indicatori
- Versione: 1.1
- Attivazioni: 10

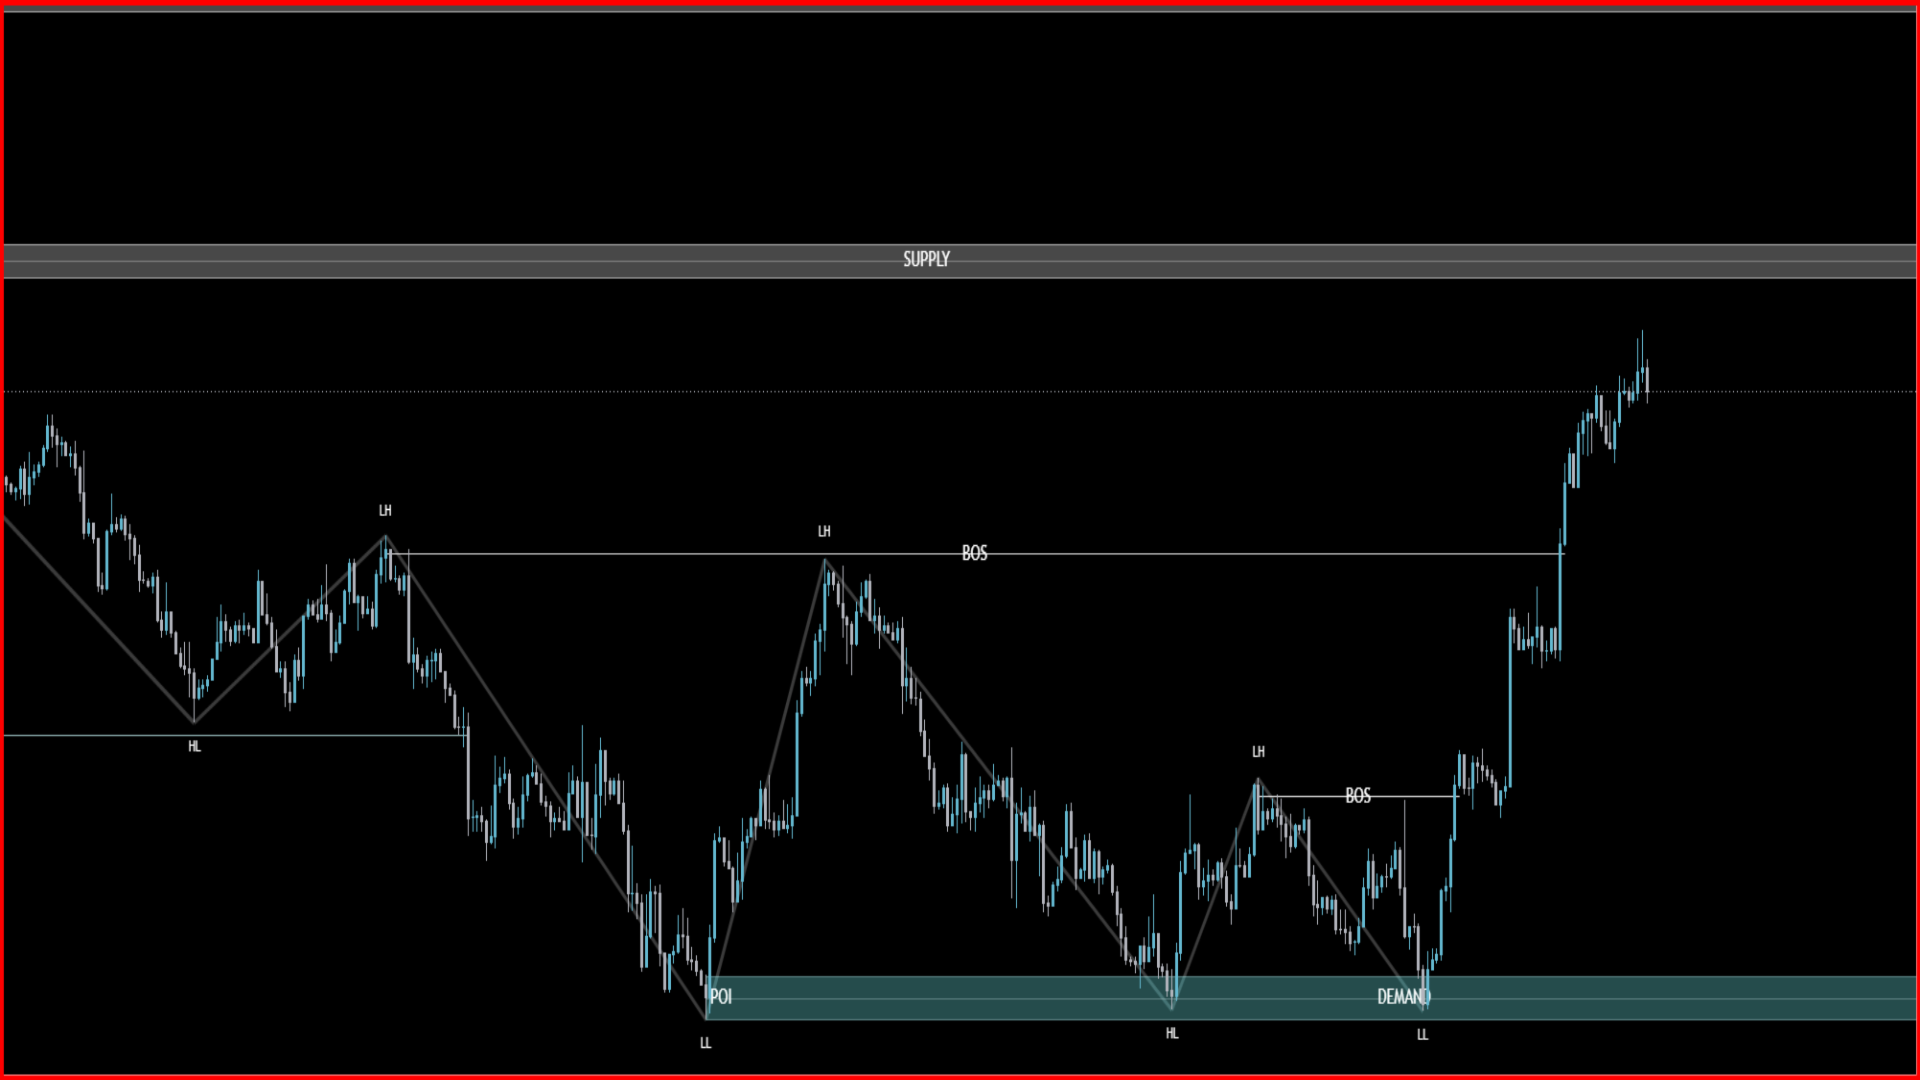
Auralis Supply Demand Matrix NR MT5 is a professional price action indicator designed to help traders identify supply and demand zones, swing structure, break of structure areas, and important market reaction points directly on the chart.
Supply and demand analysis is one of the most widely used concepts in price action trading. However, manually marking zones can take time and may become inconsistent. This indicator is designed to simplify that process by automatically detecting key swing highs and swing lows, then converting them into structured supply and demand areas.
The goal of the indicator is to give traders a cleaner chart view, helping them spend less time drawing zones manually and more time analyzing valid trading opportunities.
◆ Main Concept
The indicator detects recent market swing points using confirmed pivot logic. When a valid swing high is found, the indicator can create a supply zone. When a valid swing low is found, the indicator can create a demand zone.
These zones can help traders observe areas where price may react, reject, retest, or break through. The indicator also includes BOS logic, POI levels, optional ZigZag visualization, and optional swing point labels such as HH, HL, LH, and LL.
◆ Key Features
Supply and Demand Zones
The indicator automatically draws supply and demand zones based on confirmed swing points.
Supply zones highlight potential bearish reaction areas.
Demand zones highlight potential bullish reaction areas.
Zone width can be adjusted by the user.
The number of historical zones shown on the chart can be controlled from the settings.
Point of Interest Levels
Each supply and demand zone includes a POI level, helping traders see the central reference area of the zone.
This can be useful for observing potential retests, reactions, and price behavior around key levels.
Break of Structure
The indicator identifies when price breaks an active supply or demand zone and marks the event as a BOS area.
A break of structure can help traders recognize possible changes in market direction, trend continuation, or structural shifts.
Swing Point Labels
Optional swing point labels can be displayed on the chart, including:
HH — Higher High
HL — Higher Low
LH — Lower High
LL — Lower Low
These labels help traders read market structure more clearly and understand how price is developing over time.
Optional ZigZag Display
The ZigZag feature helps visualize the swing movement of the market.
This can make it easier to see the relationship between recent highs, lows, and structural transitions.
Clean Visual Customization
The indicator includes several visual settings so traders can adjust the chart display to match their style.
Users can customize:
Supply zone color
Demand zone color
BOS label color
POI label color
Price action label color
ZigZag color
◆ Non-Repaint Logic
Auralis Supply Demand Matrix NR MT5 is designed with confirmed-bar logic.
The indicator does not use the current live candle to confirm important signals.
Swing points are confirmed only after the required number of closed candles.
Historical confirmed zones are not moved after confirmation.
BOS events are confirmed using closed-bar data.
This makes the indicator suitable for stable chart analysis, historical review, and Strategy Tester observation.
◆ Settings
Swing High/Low Length
Controls the sensitivity of swing high and swing low detection.
A lower value creates more frequent zones.
A higher value creates fewer but more significant zones.
History To Keep
Controls how many recent supply and demand zones remain visible on the chart.
This helps keep the chart clean and avoids unnecessary visual clutter.
Supply/Demand Box Width
Adjusts the vertical size of the supply and demand zones.
The width is based on market volatility, allowing the indicator to adapt to different symbols and timeframes.
Show ZigZag
Enables or disables the ZigZag structure display.
Show Price Action Labels
Enables or disables swing point labels such as HH, HL, LH, and LL.
Visual Settings
Allows users to customize the appearance of zones, labels, POI levels, BOS markings, and ZigZag lines.
◆ How to Use
Use supply zones to observe potential short areas.
Use demand zones to observe potential long areas.
Watch how price reacts when returning to a zone.
Use BOS markings to identify possible structural changes.
Use swing point labels to understand the current market structure.
Use ZigZag to visually follow the market flow.
For stronger analysis, combine the indicator with trend direction, candle confirmation, liquidity context, multi-timeframe analysis, and proper risk management.
◆ Recommended For
Forex trading
Gold and commodities
Indices
Crypto CFDs
Price action trading
Supply and demand analysis
SMC-style market structure analysis
Breakout and retest observation
Multi-timeframe chart analysis
◆ Important Risk Notice
This indicator is not a trading robot and does not open or manage trades.
Supply and demand zones should not be used as standalone buy or sell signals. Traders should always wait for proper confirmation, market structure context, and risk management before making any trading decision.
No indicator can guarantee profitable results. Always test the indicator on your preferred symbols and timeframes before using it in live trading.
Auralis Supply Demand Matrix NR MT5 is designed to provide a clean, structured, and non-repainting view of supply and demand zones, helping traders analyze price action with more clarity and consistency.