Analogue Matcher AI Pattern Match Forecast

What if you could see the future by studying the past?

Every market pattern has happened before. Analogue Matcher finds it — automatically.

Using advanced Pearson Correlation and Linear Regression analysis, Analogue Matcher scans thousands of historical bars to find the price pattern that most closely matches what the market is doing right now — then projects it forward as a visual price path on your chart.

No guessing, no manual chart comparison. Pure mathematical pattern recognition.

How it works

  1. The indicator calculates a Linear Regression slope for the current price window
  2. It scans the entire lookback history and finds historical windows with the most similar slope
  3. It separates matches into bull analogues (patterns that went up) and bear analogues (patterns that went down)
  4. It projects both paths forward on your chart, scaled to current price levels
  5. It gives each match a confidence score based on R² similarity — so you know how strong the match is

Two modes

  • Dual Mode (recommended) — shows both the best bull analogue and the best bear analogue simultaneously. Compare both projected paths and trade the higher confidence direction.
  • Single Mode — shows only the single best match regardless of direction. Clean and simple for traders who want one clear signal.

What makes this unique

Most indicators use lagging signals — moving averages, RSI, MACD. They tell you what already happened.

Analogue Matcher is different. It uses the mathematical similarity between the current market structure and historical patterns to project what is likely to happen next, based on what actually happened in similar conditions.

  • Pearson Correlation (R²) scoring — only the most mathematically similar patterns are selected. No random matches.
  • Slope Tolerance filter — you control how similar the historical slope must be to the current slope before it qualifies.
  • Price-scaled projection — historical candles are scaled to current price levels so the projection is always relevant.
  • Confidence % shown for every match — instantly see how strong the analogue is.

What you see on the chart

  • Green candle path — bull analogue projection
  • Red candle path — bear analogue projection
  • Confidence score label on each path
  • Bias indicator — which direction has higher confidence
  • Clean info panel showing match details

Input parameters

Mode: Single Mode (best match only), Dual Mode (bull + bear simultaneously).

Projection Window: how many bars forward to project (default 50, recommended 30–100).

Lookback Period: how far back to search for matches (default 500 — more bars means better matches but slightly slower).

Slope Tolerance: how similar the slope must be (default 0.004 — lower means stricter matching with fewer but higher-quality analogues; higher means more matches with a wider search).

Colors: Bull path color (default green), Bear path color (default red), Transparency control.

How to use it

  1. Attach to any chart on any timeframe
  2. Switch to Dual Mode
  3. Wait for both bull and bear paths to appear
  4. Check which path has higher confidence %
  5. Use the higher confidence direction as your bias for the session
  6. Combine with your existing strategy for entry timing

Works on all assets

  • Forex — all currency pairs
  • Gold & Silver — XAUUSD, XAGUSD
  • Crypto — BTCUSD, ETHUSD, and all coins
  • Indices — US30, NAS100, SPX500
  • Any instrument available on your broker

Works on all timeframes from M1 to Monthly.

Important note

Analogue Matcher is a forecasting tool based on historical pattern similarity. Past patterns do not guarantee future results. Always combine with proper risk management and your own analysis. No indicator can predict the market with 100% accuracy.

Platform

MetaTrader 5 only. Works as an indicator — does not place trades.

Built by Aurex

Analogue Matcher is part of the Aurex toolkit — professional trading tools built by active traders for serious market participants.

Also available from Aurex: Elliott Wave Detector Auto MTF Analysis, Aurex Trade Journa


Prodotti consigliati
CosmiCLab SMC FIBO CosmiCLab SMC FIBO is a professional trading indicator designed for traders who use Smart Money Concepts (SMC), market structure analysis and Fibonacci retracement levels. The indicator automatically detects market swings and builds Fibonacci levels based on the latest impulse movement. It also identifies market structure changes such as BOS (Break of Structure) and CHOCH (Change of Character), helping traders understand the current market direction. CosmiCLab SMC FIBO also pr
RBreaker
Zhong Long Wu
RBreaker Gold Indicators is a short-term intraday trading strategy for gold futures that combines trend following and intraday reversal approaches. It not only captures profits during trending markets but also enables timely profit-taking and counter-trend trading during market reversals. This strategy has been ranked among the top ten most profitable trading strategies by the American magazine   Futures Truth   for 15 consecutive years. It boasts a long lifecycle and remains widely used and st
Reversal Master for MT5 Reversal Master for MT5 is a non‑repainting reversal indicator for MetaTrader 5. It helps you detect potential market reversal points and shows the maximum favourable price movement after each historical signal, so you can better understand how price behaved after similar situations in the past. The MT5 version keeps the familiar reversal‑signal logic of the original Reversal Master for MT4, but adds improved visualisation, historical statistics and a points summary panel
DAILY OH/OL SDEV QUANT MODEL - STATISTICAL TRADING WITH PRECISION RISK MANAGEMENT TRADE WITH MATHEMATICAL CERTAINTY - KNOW YOUR EXACT STOP-LOSS AND TAKE-PROFIT BEFORE YOU ENTER This indicator analyzes 5,000+ days of price history to give you: Exact entry levels (sigma bands locked at daily open) Exact stop-loss distance (from M
Noize Absorption Index - is the manual trading system that measures the difference of pressure between bears forces and bulls forces. Green line - is a noize free index that showing curent situation. Zero value of index shows totally choppy/flat market.Values above zero level shows how powerfull bullish wave is and values below zero measures bearish forces.Up arrow appears on bearish market when it's ready to reverse, dn arrow appears on weak bullish market, as a result of reverse expectation.
Trade smarter, not harder: Empower your trading with Harmonacci Patterns This is arguably the most complete harmonic price formation auto-recognition indicator you can find for the MetaTrader Platform. It detects 19 different patterns, takes fibonacci projections as seriously as you do, displays the Potential Reversal Zone (PRZ) and finds suitable stop-loss and take-profit levels. [ Installation Guide | Update Guide | Troubleshooting | FAQ | All Products  ] It detects 19 different harmonic pric
Structure King AI Signal Structure King AI Signal is a professional MetaTrader 5 trading indicator designed to help traders analyze market structure, trend direction, multi-timeframe confirmation and trade management from one clean dashboard. Key Features • Market Structure & Trend Analysis • BUY / SELL Signals • Multi-Timeframe (HTF) Confirmation • Entry Price Levels • Dynamic Stop Loss (SL) • TP1 / TP2 / TP3 Levels • ATR Volatility Analysis • ADX Trend Strength Filter • Adaptive Market Filter
Confluence Meter: una valutazione consolidata da 26 indicatori Confluence Meter calcola i segnali di 26 indicatori molto diffusi e li riunisce in una valutazione semplice del tipo «vendere / neutrale / comprare». Non serve aprire decine di finestre e confrontare i valori a mano. Basta un'occhiata al pannello per vedere da che parte pende il mercato sul timeframe selezionato. MT4-version:  https://www.mql5.com/en/market/product/199466 Our products: https://www.mql5.com/en/users/trendhunter/selle
VELOS Trading Indicator Precision. Speed. Confidence. The VELOS Trading Indicator is a professional, non-repainting MT5 trading system developed by DC Trading to help traders identify high-probability trading opportunities with confidence. Designed for both beginner and experienced traders, VELOS combines trend analysis, momentum confirmation, and volatility filtering into one intelligent indicator, delivering precise entry and exit signals while reducing false setups. Built for fast-moving m
An indicator of pattern #31 ("Long Island") from Encyclopedia of Chart Patterns by Thomas N. Bulkowski. The second gap is in the opposite direction. Parameters: Alerts - show alert when an arrow appears   Push - send a push notification when an arrow appears (requires configuration in the terminal) GapSize - minimum gap size in points ArrowType - a symbol from 1 to 17 ArrowVShift - vertical shift of arrows in points   ShowLevels - show levels ColUp - color of an upward line ColDn - color of a d
HAS RSI Signal — Indicatore di Tendenza Professionale con Calcolo SL/TP HAS RSI Signal è un potente strumento di trading che combina classici intramontabili con moderni algoritmi di filtraggio del rumore. L'indicatore analizza il mercato attraverso le candele Heiken Ashi Smoothed (HAS) e l'oscillatore RSI , fornendo al trader segnali di ingresso chiari durante le inversioni di tendenza o l'uscita dalle zone di ipercomprato/ipervenduto. Vantaggi Principali: Doppio Filtraggio: L'uso di Heiken Ashi
Your Trend Friend
Luigi Nunes Labigalini
5 (1)
The trend is your friend! Look at the color of the indicator and trade on that direction. It does not  repaint. After each candle is closed, that's the color of the trend. You can focus on shorter faster trends or major trends, just test what's most suitable for the symbol and timeframe you trade. Simply change the "Length" parameter and the indicator will automatically adapt. You can also change the color, thickness and style of the lines. Download and give it a try! There are big movements w
Il livello Premium è un indicatore unico con una precisione superiore all'80% delle previsioni corrette! Questo indicatore è stato testato dai migliori Specialisti di Trading per più di due mesi! L'indicatore dell'autore che non troverai da nessun'altra parte! Dagli screenshot puoi vedere di persona la precisione di questo strumento! 1 è ottimo per il trading di opzioni binarie con un tempo di scadenza di 1 candela. 2 funziona su tutte le coppie di valute, azioni, materie prime, criptovalu
YazanPro Pattern Scanner
Yazan Adnan Ramadan Ibrahim
Panoramica YazanPro Pattern Scanner è un indicatore per MetaTrader 5 pensato per i trader che lavorano con i pattern grafici su molti mercati. Controlla fino a 150 simboli su un massimo di 9 timeframe alla ricerca di pattern grafici classici e di 40 pattern di candele, e riunisce tutto in una tabella con la fase raggiunta da ogni pattern. Invece di aprire un grafico dopo l'altro, vedi dove un pattern si è appena completato, ha rotto, è in retest o è confermato, e un clic apre quel grafico con il
SMART TRADING SIGNALS MT5 Precision. Clarity. Confidence. Elevate Your Trading Experience with Smart Trading Signals Smart Trading Signals MT5 is a professional trading indicator designed to provide traders with a clearer, more organized view of market movements. Through an elegant visual interface, it presents trading opportunities and essential price levels in a comprehensive design that combines precision, clarity, and ease of use. Developed to be a practical trading companion, Smart Trad
Indicatore Crypto_Forex Pattern PINBAR per MT5, senza ridisegnare, senza ritardi. - L'indicatore "PINBAR Pattern" è un indicatore molto potente per il trading basato sull'azione dei prezzi. - L'indicatore rileva le PinBar sul grafico: - PinBar rialzista - Segnale a freccia blu sul grafico (vedi immagini). - PinBar ribassista - Segnale a freccia rossa sul grafico (vedi immagini). -   Con avvisi su PC e dispositivi mobili. - L'indicatore "PINBAR Pattern" è eccellente da combinare con i livelli d
STRICTLY FOR BOOM INDEX ONLY!!!!! Here I bring the Maximum Trend Arrows OT1.0 MT5 indicator. This indicator is made up of a combination of different trend indicators for entries and exits, for entries an orange arrow will paint on the chart below the current market and a red flag for closing of trades and it produces buy arrows only. When the orange arrow appears, it will appear along with it's sound to notify you. The 1H timeframe is recommended, don't use it anywhere else than on the 1H timefr
Pro Gold System Indicator
PEDRO JOAQUIM GONCALVES GOMES
ADVANCED FUNCTIONALITIES: Trend Score (0-100) with visual bar Intelligent signals with adjustable strength (1-10) Risk management with automatic TP/SL Audible and visual alerts Price zones with smooth filling Multi-indicator analysis (RSI, ATR, BB, EMAs) DESIGN FEATURES Modern Visual: Smooth and well-spaced lines (EMA with 2-3px width) Vibrant and professional colors (Sky Blue, Orange, Gold) Modern arrows (code 233/234) for buy/sell signals Configurable dark/light theme Adjustable transparency f
Trend Master V2
Oratile Pitsoane
What Is Trend Master Pro? Trend Master Pro   is a professional-grade trend trading indicator built for MetaTrader 5. It was designed with one goal in mind — to keep you on the right side of the market at all times by combining three powerful technical tools into a single, clean, easy-to-read display directly on your price chart. Instead of cluttering your screen with multiple separate indicators, Trend Master Pro fuses an   EMA Ribbon trend filter , a   ZigZag swing point engine , and a   breako
"Impulses and Corrections 5" is created to help traders navigate the market situation. The indicator shows multi-time frame upward and downward "Impulses" of price movements. These impulses are the basis for determining the "Base" , which is composed of zones of corrections of price movements, as well as "Potential" zones for possible scenarios of price movement. Up and down impulses are determined based on a modified formula of Bill Williams' "Fractals" indicator. The last impulse is always "U
SMC Indicator BOS & CHoCH analyze market structure using Smart Money Concepts The indicator combines BOS (Break of Structure), CHoCH (Change of Character), Fair Value Gaps (FVG), Liquidity Sweep logic and ATR filtering to provide a structured view of market movements and potential trading opportunities. The indicator automatically identifies swing highs and swing lows and monitors structural breaks in the market. BOS (Break of Structure) identifies potential continuation of the current market st
# DRAWDOWN INDICATOR V4.0 - The Essential Tool to Master Your Trading ## Transform Your Trading with a Complete Real-Time Performance Overview In the demanding world of Forex and CFD trading, **knowing your real-time performance** isn't a luxury—it's an **absolute necessity**. The **Drawdown Indicator V4.0** is much more than a simple indicator: it's your **professional dashboard** that gives you a clear, precise, and instant view of your trading account status. --- ## Why This Indicator
Qauters Theory GBPJPY
Brighton Mufaro Mudzingwa
QT PRO Quarters Theory GBPJPY · London Open Breakout Plots 250-pip major quarters, 125-pip half-quarters, and 25-pip minor levels on GBPJPY. Monitors the London session open (08:00 GMT) and fires a single buy or sell arrow when price breaks and closes beyond the first key level — one signal per day, no repainting How it works now: Arrows only appear between 08:00–12:00 GMT (London session) — nothing outside that window 1 arrow per day maximum — once the first valid break is found, that day is
Heiken_Ashi_Bars - Visualizzatore di Tendenze Avanzato per MT5 Panoramica Heiken_Ashi_Bars è un indicatore personalizzato potente e visivamente intuitivo progettato per filtrare il rumore del mercato ed evidenziare la vera tendenza di fondo. I grafici a candele tradizionali possono spesso essere erratici. Calcolando la media dei dati sui prezzi, questo indicatore uniforma l'azione dei prezzi, rendendo molto più semplice individuare continuazioni di tendenze, inversioni e zone di ingresso redditi
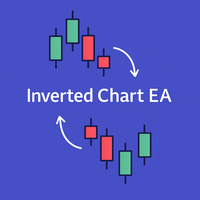
Inverted_Chart_EA Utility Expert Advisor Inverted_Chart_EA creates and maintains a mirror-inverted chart of any symbol and timeframe. It automatically generates a custom instrument (e.g. US30_INV ) and keeps its price history updated in real time, with bars mirrored around a chosen pivot. This utility gives traders a new way to analyze the market from a different perspective by flipping the chart upside down. Why use an inverted chart? Highlight hidden patterns – price formations that look ordin
Accesso Ufficiale all'Ecosistema BlueDigitsFx Ricevi aggiornamenti sull'infrastruttura, risorse operative, nuovi prodotti e accesso all'ecosistema ufficiale BlueDigitsFx. Ecosistema Telegram Sito Web Versione MT4 BlueDigitsFx Spike And Strike Reversal MT5 — Oscillatore Composito per l'Analisi delle Inversioni di Mercato e del Momentum BlueDigitsFx Spike And Strike Reversal è un oscillatore composito che combina molteplici segnali di indicatori per aiutare i trader a identificare potenziali i
TRI Visualizer
Yoshimi Mon 三 Ura
TRI Visualizer MT5 – Thermodynamic Market Analysis Overview The TRI (Thermal Range Indicator) Visualizer Enhanced is a rare market analysis indicator that goes beyond conventional technical analysis, applying principles of thermodynamics from physics. It interprets market price fluctuations as “thermodynamic energy,” enabling the highly accurate detection of subtle market changes that are often overlooked. Innovative Mechanisms 1. Dual Calculation Engines Classic TRI Mode Formula: |Close
The Rainbow Dragon Indicator by Quant Atlas Creator:  https://www.quant-atlas.com/ The Rainbow Dragon is a composite signal engine that aggregates the seven Rainbow indicators — Blue, Green, Indigo, Red, Violet, Yellow, and Orange — into a single confluence-based reading. Rather than relying on any one model, it treats each Rainbow component as an independent voter and fires only when enough of them agree, giving you a diversified, multi-method read on the market instead of a single point of vie
Fibo Channels
Jeffrey Quiatchon
Fibo Daily Channel Indicator The  Indicator is a powerful tool for traders, providing precise daily support and resistance levels based on Fibonacci retracement and extension calculations. This indicator automatically draws key pivot points (PP, R1, R2, S1, S2) as well as additional extension levels (R3, R4, S3, S4), helping traders identify potential reversal and breakout zones with ease. It includes customizable alerts and push notifications, allowing traders to receive updates whenever the pr
NQX Range Edge Hook Weekly Bias è un indicatore di segnali per MetaTrader 5: segnali di uncino sul bordo del range (segnala solo nella direzione del bias settimanale). Logica NQX proprietaria che rileva il prezzo che lascia il bordo del suo range recente, confermato dalla candela. Segnala solo nella direzione del bias settimanale. Disegna l'ingresso suggerito, uno stop corto e target ampi (3:1, 5:1, 10:1, fino a 20:1 in swing); decidi tu. Cosa disegna sul grafico - Una freccia sulla candela di s
Gli utenti di questo prodotto hanno anche acquistato
Trend Sniper X
Sarvarbek Abduvoxobov
4.86 (44)
Trend Sniper X è un indicatore trend-following multi-timeframe per MetaTrader 5 che aiuta i trader a identificare la direzione del trend e i potenziali punti di inversione con chiarezza e precisione. per MT4: https://www.mql5.com/en/market/product/193245 Informazioni sul prezzo: Il prezzo attuale è promozionale ed è soggetto a modifiche con il rilascio di futuri aggiornamenti e nuove funzionalità. Offerta Bonus: Per ricevere GRATIS l'Auto-Trade Assistant EA per questo indicatore, invia un messa
Entry Points Pro vi mostra dove entrare, dove mettere lo stop e con quale lotto operare — prima di piazzare l'ordine. PREZZO Ora 199 USD: 8 copie a questo prezzo, poi 249 USD. Il prezzo finale è di 349 USD. Guadagno facendo trading sui mercati e lo dimostro, quindi non ho bisogno di vendere questo indicatore a tutti. È uno strumento per trader che ragionano con la propria testa, non un pulsante magico. Nessuna rottura, nessun trade. Una freccia grigia è un segnale annullato: il prezzo non ha ro
Ultra Indicator
Ihor Otkydach
5 (1)
ULTRA è un indicatore tecnico che funziona secondo un approccio “tutto in uno”: analizza autonomamente il mercato, genera segnali di trading, visualizza i livelli per l’impostazione degli ordini stop-loss e suggerisce quando chiudere le operazioni per realizzare profitti o ridurre al minimo le perdite. In altre parole, non importa se non sai come analizzare il mercato, determinare i livelli — dove impostare lo stop-loss — o se hai difficoltà con la gestione del capitale. ULTRA farà tutto questo
Gann Made Easy è un sistema di trading Forex professionale e facile da usare che si basa sui migliori principi del trading utilizzando la teoria di mr. WD Gann. L'indicatore fornisce segnali ACQUISTA e VENDI accurati, inclusi i livelli di Stop Loss e Take Profit. Puoi fare trading anche in movimento utilizzando le notifiche PUSH. CONTATTAMI DOPO L'ACQUISTO PER RICEVERE GRATUITAMENTE LE ISTRUZIONI DI TRADING E OTTIMI INDICATORI EXTRA! Probabilmente hai già sentito parlare molte volte dei metodi d
Boba Analysis Suite
Trade Ready Solutions LLC
5 (2)
Boba Analysis Suite Boba Analysis Suite è un indicatore di analisi per MetaTrader 5. Riunisce la struttura del mercato, le zone di prezzo rilevanti e il contesto generale del mercato in un’unica visualizzazione del grafico. Sviluppato sulla base dell’esperienza pratica come trader e formatore di trading, supporta un processo di analisi strutturato: valutare la direzione del mercato, individuare livelli importanti e analizzare congiuntamente più intervalli temporali. Analisi nel contesto del merc
Azimuth Pro
Ottaviano De Cicco
5 (7)
Azimuth Pro V2: Synthetic Fractal Structure and Confirmed Entries for MT5 Overview Azimuth Pro is a multi-level swing structure indicator by Merkava Labs . Four nested swing layers, swing-anchored VWAP, ABC pattern detection, three-timeframe structural filtering, and closed-bar confirmed entries — one chart, one workflow from micro-swings to macro-cycles. This is not a blind signal product. It is a structure-first workflow for traders who care about location, context, and timing. 1. What Change
FiboSniper Pro
Van Minh Nguyen
5 (4)
FiboSniper Pro – Multi-Filter Fibonacci System with Auto SL/TP and Control Panel FiboSniper Pro è un indicatore tecnico che combina Fibonacci Envelopes dinamici con diversi filtri di conferma per generare segnali Buy e Sell selezionati. I livelli di Fibonacci vengono calcolati sulla base di Moving Average e ATR e successivamente filtrati tramite ADX, EMA, RSI, ATR, Volume, Time e struttura delle candele. L’indicatore visualizza direttamente sul grafico i livelli automatici di Stop Loss e Take Pr
M1 Sniper MT5
Oleg Rodin
5 (7)
M1 SNIPER   è un sistema di indicatori di trading facile da usare. Si tratta di un indicatore a freccia progettato per l'intervallo temporale M1. L'indicatore può essere utilizzato come sistema autonomo per lo scalping sull'intervallo temporale M1 e come parte del tuo sistema di trading esistente. Sebbene questo sistema di trading sia stato progettato specificamente per il trading sull'intervallo temporale M1, può comunque essere utilizzato anche con altri intervalli temporali. Inizialmente ho p
Apex Patterns PRO Acquista l'indicatore - Ottieni GRATUITAMENTE l'Expert Advisor basato su di esso. Intelligenza auto-ottimizzante per pattern grafici e breakout Gli scanner di pattern tradizionali si basano su input fissi, registrando spesso prestazioni inferiori quando la volatilità e le strutture del mercato cambiano. Apex Patterns PRO è progettato per adattarsi alle mutevoli condizioni di mercato combinando il riconoscimento dei pattern grafici strutturali, il filtraggio del momentum e l'au
SQN Max indicator for MT5 by ITC
Renaud Herve Francois Candel
Sqn Max Indicator Sqn Max is an exclusive indicator to trade the market with high effectiveness. The indicator is based on price action, volatility and trend. This indicator is as simple as possible but not too simple. The indicator can generate alerts to ease the trading process. You don't have to stay all day in front of your screen. The indicator can be used with any class of assets and with any time frame. It is possible to achieve better results trading our list of selected assets. We achi
Adaptive Price Action Engine Acquista un indicatore, ricevi l'EA gratis Analisi Auto-Ottimizzata del Trend e dei Pattern Candlestick Multi-Timeframe I mercati cambiano continuamente e non tutti i pattern di Price Action hanno lo stesso valore in ogni condizione di mercato. Adaptive Price Action Engine è progettato per adattarsi alle condizioni di mercato in continua evoluzione, combinando struttura del trend, analisi Multi-Timeframe, pattern Candlestick e ottimizzazione statistica in un unico fr
Divergence Bomber
Ihor Otkydach
4.89 (94)
Ogni acquirente dell’indicatore riceverà inoltre gratuitamente: L’utilità esclusiva “Bomber Utility”, che gestisce automaticamente ogni operazione, imposta i livelli di Stop Loss e Take Profit e chiude le posizioni secondo le regole della strategia I file di configurazione (set file) per adattare l’indicatore a diversi asset I set file per configurare il Bomber Utility in tre modalità: “Rischio Minimo”, “Rischio Bilanciato” e “Strategia di Attesa” Una guida video passo-passo per installare, con
Power Candles MT5
Daniel Stein
4.58 (12)
Power Candles V3 - Indicatore di forza ad ottimizzazione automatica Power Candles V3 trasforma la forza delle valute e degli strumenti in un piano di trading attuabile su ogni grafico a cui è collegato. Invece di limitarsi a colorare le candele, esegue un'auto-ottimizzazione in tempo reale in background e ti fornisce i migliori valori di Stop Loss, Take Profit e soglia di segnale per il simbolo che hai davanti. Basta un clic per adottarlo nel trading live: i raggi di ingresso, Stop Loss e Take P
Currency Strength Wizard   è un indicatore molto potente che ti fornisce una soluzione all-in-one per un trading di successo. L'indicatore calcola la potenza di questa o quella coppia forex utilizzando i dati di tutte le valute su più intervalli di tempo. Questi dati sono rappresentati in una forma di indice di valuta facile da usare e linee elettriche di valuta che puoi utilizzare per vedere il potere di questa o quella valuta. Tutto ciò di cui hai bisogno è collegare l'indicatore al grafico ch
Naked Forex Tweezer Pro Indicator Tweezer Pro Indicator is a pattern recognition indicator for Forex, Stocks, Indices, Futures, Commodities and Cryptos. The standard Tweezer is a two bar pattern. Our enhanced version is a multi-bar pattern. We filter the patterns for you so that you only get the     best and most effective patterns   and ignore the noise. The Tweezer pattern is a simple and effective pattern to trade. The strategy that comes with the Tweezer is based on price action. The Twe
Auto Optimized SpeedAngle è un sistema di vettorizzazione del momento di livello istituzionale che elimina l'overfitting ( curve-fitting ) attraverso l'ottimizzazione continua Walk-Forward (WFO). Invece di affidarsi a input statici che si degradano quando i regimi di mercato cambiano, l'indicatore recalibra dinamicamente i suoi parametri utilizzando la validazione Out-of-Sample (OOS), assicurando che i segnali visualizzati rappresentino reali vantaggi statistici anziché anomalie storiche. Quadro
Indicatore multi-valuta di forza e momentum MT5 Dynamic Forex28 Navigator è l'evoluzione dei nostri indicatori popolari da lunga data, che riunisce la potenza di cinque in uno: Advanced Currency Strength28 Indicator (700 recensioni) Advanced Currency IMPULSE with ALERT (530 recensioni) Currency Strength EXOTICS GOLD Impulse with Alert CS28 Combo Signals (bonus attuale) Non serve acquistare quattro indicatori e impilarli sui grafici. Tutto è riunito in un solo indicatore potente: la forza delle 2
ARICoins
Temirlan Kdyrkhan
ARICoin is a powerful trading companion designed to generate high-probability entry signals with dynamic TP/SL/DP levels based on volatility. Built-in performance tracking shows win/loss stats, PP1/PP2 hits, and success rates all updated live. Key Features: Buy/Sell signals with adaptive volatility bands Real-time TP/SL/DP levels based on ATR Built-in MA Filter with optional ATR/StdDev volatility Performance stats panel (Success, Profit/Loss, PP1/PP2) Alerts via popup, sound, push, or email Cust
PZ Swing Trading MT5
PZ TRADING SLU
5 (5)
Protect against whipsaws: revolutionize your swing trading approach Swing Trading is the first indicator designed to detect swings in the direction of the trend and possible reversal swings. It uses the baseline swing trading approach, widely described in trading literature. The indicator studies several price and time vectors to track the aggregate trend direction and detects situations in which the market is oversold or overbought and ready to correct. [ Installation Guide | Update Guide | Tro
Apollo SR Master è un indicatore di Supporto/Resistenza con caratteristiche speciali che rendono il trading con le zone di Supporto/Resistenza più semplice e affidabile. L'indicatore calcola le zone di Supporto/Resistenza in tempo reale senza alcun ritardo, rilevando i massimi e i minimi dei prezzi locali. Quindi, per confermare la nuova area SR formata, l'indicatore mostra un segnale speciale che segnala che la zona SR può essere presa in considerazione e utilizzata come un vero e proprio segna
Neuro Poseidon MT5
Daria Rezueva
4.68 (53)
Neuro Poseidon is a new indicator by Daria Rezueva. It combines precise trading signals with adaptive TP/SL levels - creating best possible trades as a result! Message me and get  Neuro Poseidon Assistant  as a gift to automize your trading process! What makes it stand out? 1. Proven profitability on all assets and timeframes 2. Only confirmed BUY and SELL signals present on the chart 3. Adaptive TP & SL levels generated by the software for each trade 4. Easy to understand - suitable for al
SIO Oscillator: oscillatore auto-ottimizzante dello squilibrio di semivarianza Acquista l’indicatore e ricevi GRATIS l’Expert Advisor (EA) basato su di esso. La maggior parte degli oscillatori tratta ogni movimento di prezzo allo stesso modo. SIO separa la pressione rialzista da quella ribassista e misura lo squilibrio tra le due, mostrando quale parte controlla davvero il mercato: compratori o venditori. Quando lo squilibrio raggiunge un estremo, SIO genera un segnale chiaro con livelli di ingr
Advanced Supply Demand MT5
Bernhard Schweigert
4.53 (15)
La migliore soluzione per qualsiasi principiante o trader esperto! Questo indicatore è uno strumento di trading unico, di alta qualità e conveniente perché abbiamo incorporato una serie di funzionalità proprietarie e una nuova formula. Con questo aggiornamento, sarai in grado di mostrare fusi orari doppi. Non solo potrai mostrare una TF più alta, ma anche entrambe, la TF del grafico, PIÙ la TF più alta: SHOWING NESTED ZONES. Tutti i trader di domanda di offerta lo adoreranno. :) Informazioni imp
ScalpPoint
Temirlan Kdyrkhan
ScalpPoint is a powerful trading companion designed to generate high-probability entry signals with dynamic TP/SL/DP levels based on volatility. Built-in performance tracking shows win/loss stats, PP1/PP2 hits, and success rates — all updated live. Key Features: Buy/Sell signals with adaptive volatility bands Real-time TP/SL/DP levels based on ATR Built-in MA Filter with optional ATR/StdDev volatility Performance stats panel (Success, Profit/Loss, PP1/PP2) Alerts via popup, sound, push, or emai
Astral Structure
Ottaviano De Cicco
Astral Structure Valuta il setup. Osserva il piano iniziale. Offerta di lancio - $99. $149 dopo il lancio. Un setup di struttura pone più domande insieme: il quadro più ampio concorda, dove si trova il riferimento di stop e come sono definiti i target? Astral Structure riunisce queste domande in un unico spazio per i trader discrezionali che basano le proprie decisioni sulla struttura del mercato. Concentrati sul setup rilevante. Esamina insieme l'ultimo setup idoneo, la sua direzione e la sua q
Superhero
Ihor Otkydach
5 (3)
L'indicatore SUPERHERO è un sistema di trading multivaluta progettato secondo un approccio "all-inclusive". L'indicatore analizza autonomamente il mercato e fornisce segnali su quando aprire e chiudere le posizioni. Utilizza ordini Stop Loss e Take Profit. Il rapporto R:R è 1:1. Questo sistema è in grado di inviare notifiche push sul tuo smartphone, consentendoti di effettuare operazioni "in mobilità" senza dover rimanere incollato al PC. È perfetto per le società di trading proprietario. UN OMA
Bill Williams Advanced
Siarhei Vashchylka
5 (11)
Bill Williams Advanced is designed for automatic chart analysis using Bill Williams' "Profitunity" system. The indicator analyzes four timeframes at once. Manual (Be sure to read before purchasing) Advantages 1. Analyzes the chart using Bill Williams' "Profitunity" system. Signals are displayed in a table in the corner of the screen and on the price chart. 2. Finds all known AO and AC signals, as well as zone signals. Equipped with a trend filter based on the Alligator. 3. Finds "Divergence Bar
Naked Forex Kangaroo Tail Pro Indicator Kangaroo Tail Pro Indicator is a pattern recognition indicator for Forex, Stocks, Indices, Futures, Commodities and Cryptos. The Kangaroo Tail is a multi-bar pattern. The Kangaroo Tail pattern is very effective and is very simple to trade. The strategy that comes with the Kangaroo Tail is based on price action. The indicator does what it was designed for: displaying Kangaroo Tail patterns.     Don't expect to follow the up and down arrows and make mone
AriFocus
Temirlan Kdyrkhan
AriFocus - Non-Repainting Buy/Sell Signals AriFocus - one clear signal. AriFocus marks buy and sell signals directly on the chart and suggests a stop-loss level for each one. Every signal is confirmed on bar close and never repaints. - Buy/sell arrows, confirmed on bar close - Suggested stop-loss level for every signal - Trend band and candle coloring to show direction at a glance - 10 ready-made presets, or your own settings (14 calculation methods) - Pop-up, push and email alerts with entr
RSI Thunder MT5
Muhammad Abdulrahman Omar Naima Allah Al-rais
RSI Thunder è un indicatore di trading avanzato progettato per fornire segnali chiari e affidabili. I segnali vengono generati solo alla chiusura della candela, evitando repaint. Combina RSI, EMA, ADX e ATR con un filtro di tendenza SMA40. Analizza le ultime cinque candele e conferma le operazioni solo quando il mercato mostra una struttura chiara. Le frecce di ingresso e il Take Profit automatico rendono l’indicatore facile da usare.
Altri dall’autore
Liquidity Swings - Unmitigated Zones [Aurex] This indicator identifies the most recent unmitigated pivot high and pivot low on your chart, then draws a visible zone around each level until price closes through it. How it works: Detects swing highs and lows using a configurable fractal lookback period Draws a zone box from the wick or full candle range at each pivot The level line stays solid while the zone is active and switches to dashed once price closes through it Tracks how many times price
FREE
Strong Liquidity Zones A professional non-repainting liquidity mapping indicator that detects and scores high-probability imbalance zones and stop-pool zones on the chart. The indicator identifies two core types of liquidity areas: • Imbalance Zones – price gaps (similar to Fair Value Gaps) that act as magnets • Stop-Pool Zones – areas around confirmed swing highs/lows where stop orders typically cluster Each zone receives a dynamic 0–10 score based on volume pressure, zone size, number of tests
FREE
Wyckoff Architectural Range Wyckoff Architectural Range is an automatic range-detection indicator built around Wyckoff market theory. It scans price action for valid consolidation ranges, then maps the range into a clear premium/discount structure so you can instantly see where price sits relative to fair value. What it does: Auto range detection — automatically identifies valid consolidation ranges based on volatility (ATR), so you don't have to draw them manually. Premium & Discount zones — sp
FREE
Most Elliott Wave tools just draw lines. This one validates every pattern against the 3 cardinal rules — or rejects it. Elliott Wave analysis is one of the most powerful — and most difficult — methods in technical trading. Most indicators fake it. They draw zigzag lines and call them waves without checking a single Elliott Wave rule. Elliott Wave Detector Pro is different. It was built from the ground up to detect, validate, and project Elliott Wave patterns the way a professional analyst would
Fibonacci Projection Volume Delta Profile Combine Fibonacci-based price projections with volume delta analysis to see where buying and selling pressure concentrates across key retracement zones. This indicator automatically detects swing highs and lows, plots retracement levels, and projects forward price targets using Fibonacci extensions — while overlaying a volume delta profile that shows the balance of bullish vs. bearish volume within each Fibonacci band. Use it to spot high-probability rev
FREE
AUREX STRONG GRADIENT CHANNEL — Linear Regression Channel, Sloped Volume Profile & Order Flow Stop trading price in isolation. Aurex Strong Gradient Channel fuses a statistically-fitted trend channel with a full volume profile and live order-flow read, then scores contrarian setups at the edges of the range — all in one indicator, one panel, one glance.  What it doe     Linear Regression Channel — a statistically fitted channel (not a fixed-lookback high/low box) that adapts its slope to the rea
FREE
MOST INDICATORS SHOW YOU ONE THING — PRICE OR VOLUME. THIS SHOWS YOU BOTH, TOGETHER. SMC Volume Profile Regression Channel builds a statistically-fitted price channel (linear or polynomial regression) around your chart, then overlays real-time volume pressure and a right-side volume distribution profile — so you can see structure and participation in a single view instead of switching between tools. WHAT IT DOES — Plots a regression channel (linear or quadratic curve fit) with adjustable standar
FREE
Aurex Resistance & Support Dynamic PRO An adaptive support/resistance zone indicator built on swing-pivot detection, ATR-scaled zone sizing, volume validation, and an automated mitigation protocol that removes zones once they've been invalidated. Zone detection Zones are anchored to confirmed swing highs and swing lows (symmetric pivot window, default length 10). Each zone's thickness is derived from a 50-period ATR rather than a fixed pip/point value, so zone width automatically adapts to the c
FREE
Aurex Market Structure - CHoCH/BOS (Fractal) A structure-detection indicator that identifies swing highs/lows using a symmetric fractal filter, then flags Break of Structure (BOS) and Change of Character (CHoCH) events when confirmed closes cross those swing levels. Detection method Swing points are located using a fractal window of configurable length: a high is registered when it is the local extreme across the surrounding bars on both sides, and the same logic applies inversely for lows. Once
FREE
Harmonic Pattern Scanner — Gartley, Bat, Butterfly, Crab (Auto XABCD Detection) Stop manually plotting Fibonacci retracements on every swing. This indicator scans your chart in real time, identifies X-A-B-C-D structures, and tells you exactly which harmonic pattern is forming — Gartley, Bat, Butterfly, or Crab — with entry, stop loss, and four take-profit targets calculated automatically. What it does Detects confirmed harmonic patterns the moment a D-point swing closes, and previews forming pat
Most traders lose not because of bad strategy — but because they never review their trades. Aurex Trade Journal fixes that automatically. Drop this EA on any chart and it silently logs every closed trade to a structured CSV file. Open it in Excel or Google Sheets and your edge becomes visible within minutes. What it logs Entry & exit price, direction, lot size Stop loss & take profit levels Trade duration (minutes) Profit in $ and % of account balance R:R ratio (calculated automatically) Win / l
FREE
Most breakout tools draw random lines. This one finds real channels. Price moves in channels, wedges, triangles, flags, and pennants. Every major breakout starts inside one of these patterns. Breakout Pattern Setup automatically detects converging price channels using a boundary-fit algorithm — the same mathematical approach professional analysts use manually — and alerts you the moment price breaks out with strength. No manual drawing, no guessing. Pure mathematical channel detection. How it wo
Aurex Fibonacci OTE Zone Smart Market Structure • Fibonacci OTE • CHoCH • Dynamic Swing Tracking Aurex Fibonacci OTE Zone is a professional MT5 chart indicator designed to help traders identify market structure, swing movements, Change of Character (CHoCH), and Fibonacci Optimal Entry (OTE) zones directly on the chart. Instead of manually drawing Fibonacci levels after every market move, the indicator automatically tracks the evolving market structure and updates the relevant Fibonacci levels as
Trend Market — Smart Money Concepts (SMC) Indicator with Order Blocks, FVG & Auto TP System Trend Market is a complete Smart Money Concepts toolkit built to help you read institutional price behavior with clarity — market structure, liquidity zones, and precise risk-based profit targets, all in one indicator.  The Strategy This indicator is built around real Smart Money Concepts (SMC) trading logic: Market Structure Detection (BOS / CHoCH) — Using fractal-based swing analysis, the indicator auto
Filtro:
Nessuna recensione
Rispondi alla recensione