Guarda i video tutorial del Market su YouTube
Come acquistare un Robot di Trading o un indicatore
Esegui il tuo EA
hosting virtuale
hosting virtuale
Prova un indicatore/robot di trading prima di acquistarlo
Vuoi guadagnare nel Market?
Come presentare un prodotto per venderlo con successo
Nuovi indicatori tecnici per MetaTrader 5 - 76

The Binary Tend Follower indicator has been designed especially for Binary options trading. The best time frame to use the indicator on is a 1M chart with 1Min expiry's as soon as the signal candle closes. There is no need to over complicate your trading as all the thinking has been done for you. The indicator was designed as simple as possible to take out all the subjectivity of trying to follow a complicated strategy, and allowing the trader to focus on extremely simple entry's. Buy: When the

This indicator uses a mathematical calculation algorithm . This algorithm calculates the remainder between the updated model and the actual values and produces the possible progress of the graph on the graph. It is not a super prophet in trading, but it is very good for the trader when entering the market and to analyze it before entering. Applicable for all currencies. Данный индикатор использует алгоритм математических вычислений . Данный алгоритм вычисляет остаток между обновленной моделью и

Kindly rate and comment about the product for upgradation & Support
The 5 EMA is plotted in green color ( Lime ).
The 14 EMA is plotted in red color ( Red ).
The 20 EMA is plotted in blue color ( Blue ).
The 200 EMA is plotted in yellow color ( Yellow ).
The Quarter EMA that provided calculates and plots four Exponential Moving Averages (EMAs) on the chart using different periods: 5, 14, 20, and 200. Each EMA is represented by a different color on the chart. Here's a description of each EMA:
FREE

This Indicator breaks down the movement into 3 waves: The primary wave suitable for long-term trading The intermediate wave suitable for intraday trading The minor wave for short-term trading
Supports and resistances:
Each wave is defined by major highs and minor lows. According to Dow's theory, an uptrend will be defined by minor lows higher and higher and a downtrend by major highs lower and lower.The indicator plots the next supports and resistances for each wave.
Trend channels (primary wa

The selective pin bar is designed to identify reversals. To use the selective pin bar effectively, traders typically look for Strong Rejection: The tail of the pin bar should extend significantly beyond the surrounding price action. It indicates that there was a sharp rejection of higher or lower prices during the trading period. A strong rejection suggests that the market sentiment may be changing.
FREE
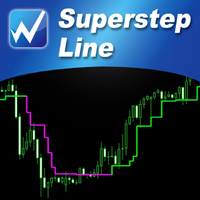
【SuperStep Line】Indicator Introduction : The color of the SuperStep line which is green and climbing up means that the price trend is going up.The color of the SuperStep line is purple and going down means that the price trend is going down.
It is very simple to use it to judge the market trend! What's even better is that the open parameters of the indicators allow investors to adjust. You can adjust 【SuperStep Line】 according to your needs. Adjust it faster to be closer to short-term market

MT4 Version GaussChannelPro is a powerful and innovative trading indicator designed to enhance your trading strategy with the precision of Gaussian-based channels. Leveraging the principles of Gaussian (normal) distribution, this indicator creates a unique channel on your price chart, offering valuable insights into market trends and potential turning points. Utilizing advanced statistical analysis, GaussChannelPro calculates the optimal channel boundaries based on historical price data, present

Ali Levels Pro is an indicator designed to identify and draw levels of interest including: Opening Range High/Low with seconds precision, Previous Session High/Low (if you are a Intraday trader who trades Indices or Commodities maybe you want to know yesterday New York Session high and low), Overnight Session High/Low, Previous Day High/Low, Previous Week High/Low, and Previous Month High/Low.
Traders use this levels as support and resistance levels. By searching for confluences between

FX Power: Analizza la Forza delle Valute per Decisioni di Trading Più Intelligenti Panoramica
FX Power è lo strumento essenziale per comprendere la reale forza delle principali valute e dell'oro in qualsiasi condizione di mercato. Identificando le valute forti da comprare e quelle deboli da vendere, FX Power semplifica le decisioni di trading e rivela opportunità ad alta probabilità. Che tu segua le tendenze o anticipi inversioni utilizzando valori estremi di Delta, questo strumento si adatta

Il Cattura Tendenza (The Trend Catcher): La strategia Trend Catcher con indicatore di allerta è uno strumento di analisi tecnica versatile che aiuta i trader a identificare le tendenze di mercato e i potenziali punti di ingresso e uscita. Presenta una strategia dinamica Trend Catcher che si adatta alle condizioni di mercato, offrendo una chiara rappresentazione visiva della direzione della tendenza. I trader possono personalizzare i parametri in base alle proprie preferenze e tolleranza al risch
FREE
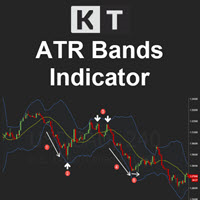
KT ATR Bands disegna le bande di volatilità utilizzando una combinazione di Average True Range (ATR) e media mobile. Sono spesso utilizzate per identificare potenziali punti di inversione e periodi di alta o bassa volatilità.
Funzionalità
Supporto multi-timeframe: Ad esempio, è possibile visualizzare le bande ATR del timeframe giornaliero su un grafico H1. Avvisi intelligenti: Puoi attivare o disattivare gli avvisi per ciascuna banda e impostare un intervallo minimo tra gli avvisi per evitare n
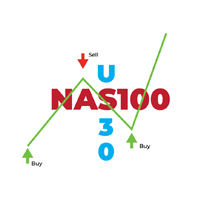
L'indicatore NAS30 Scalper è uno strumento all'avanguardia progettato per fornire segnali precisi di acquisto e vendita per strategie di scalping sui mercati NAS100 e US30. Questo indicatore sfrutta algoritmi avanzati per identificare tendenze di breve termine nel mercato e sfruttare rapidi movimenti dei prezzi, rendendolo perfetto per i trader che desiderano cogliere rapidamente opportunità di profitto.
Caratteristiche principali:
Segnali in tempo reale: Ricevi avvisi istantanei quando l'ind

Introduction
The Bounce Zone indicator is a cutting-edge non-repainting technical tool built to identify key areas on the price chart where market sentiment is likely to cause a significant price reversal. Using advanced algorithms and historical price data analysis, this indicator pinpoints potential bounce zones. Combined with other entry signal, this indicator can help forex traders place the best trades possible
Signal
A possible buy signal is generated when price is in the green zone an
FREE
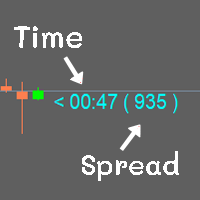
Show the time of candlesticks and spread. All data will be displayed in a rod. Can change color Can fix the size as needed
MT4 : Link https://www.mql5.com/en/market/product/102742 MT5 : Link https://www.mql5.com/en/market/product/102834
Most free code on various websites I didn't write it myself. I only do a little bit.
If you like it, please give 5 stars with it. Thank you.
FREE
Candle Scanner Dashboard is an incredibly powerful tool in the financial markets. It excels at detecting market reversals, trend changes, and retracements. The dashboard displays patterns as they are identified, and with a simple click on each pattern, you can view them on their dedicated charts to precisely locate their occurrences. With its capability to detect 11 popular bullish and 11 bearish patterns, you can trust the dashboard to handle pattern identification effortlessly. It provides an
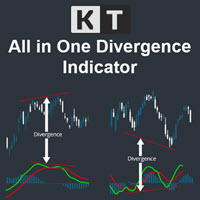
The KT All-In-One Divergence is designed to identify regular and hidden divergences between the price and 11 widely recognized oscillators. This powerful tool is indispensable for swiftly and accurately spotting market reversals. Its a must-have tool in any trader's arsenal, providing clear and accurate divergence patterns. Its accuracy and speed in identifying market reversals are remarkable, allowing traders to seize profitable opportunities confidently.
Features No Interference: You can ad
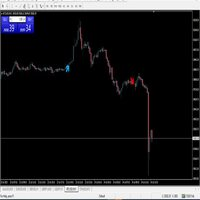
Hello There,
Today I want to show you my new researchable fore BUY SELL indicator,
it work all asset,
and also work Derive Volatility asset!
it work all time frame, but i recommend start 5 minute to H1
when you receive a signal just take trade and stay wait for your take profit
asset
All Major Pair And minor
IT WORK ALSO XAUUSD
Fantastic results,
for more info,,, message us
thank you

Adaptive Hull MA Pro – Trend & Momentum Filter
We value your feedback and believe that your experience with the Hull Moving Average (HMA) is essential to us and other traders. Help us continue to improve and refine our product by sharing your thoughts and insights through a review!
The Hull Moving Average (HMA) Indicator – Your Key to Smoother Trends and Profitable Trades! Are you tired of lagging and choppy moving averages that hinder your ability to spot profitable trading opportunities? Loo
FREE

Volume Cross Over is an indicator that measure positive and negative volume flow in a financial instrument, such as a stock, commodity, or index. It is base on the idea of On-Balance Volume developed by Joseph Granville. However instead of trending lines, this indicator shows volume cross over. When the closing price of an asset is higher than the previous closing price, then the Bull volume is greater than zero and Bear volume is negative. It suggests that buying volume is dominating, and
FREE
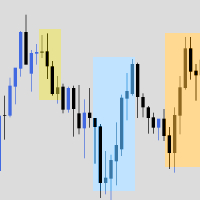
The indicator is a bundle of EIGHT different fundamental functions required for a trader: 1] Forex Session where you can determine your own timings/highlights. 2] High low marking from 1H to 1M 3] Sweetspot 4] Spread and Candle Stick Timer 5] Background logo for branding- You can place the images at any zone of the chart you want 6] Profit and Loss 7] Days names (SUN MON TUE…) on the chart 8] High/low break notification

The indicator is created using a unique algorithm that has no analogues. Based on the calculations, the contract price itself and the percentages displayed in it are calculated, which are displayed in the indicator in the form of histograms in two drawing options, as well as in six options for displaying prices on a chart in various combinations, which allows you to accurately see the interest of all trading participants in the form of drawing levels support and resistance. Trading decisions can

Introduction
The PF Maximizer is a game-changing non-repainting technical tool engineered to help traders distinguish genuine trend signals from erratic market fluctuations. By employing sophisticated algorithms and cutting-edge data analysis, this indicator efficiently filters out unwanted noise, empowering traders to identify the precise starting and ending points of substantial market moves.
Signal
Potential buy signal is generated when moving average is going up and the blue line cross a
FREE
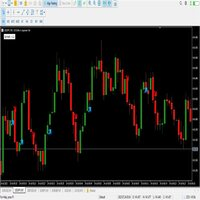
Alright. This indicator works on MT5 and is very easy to use. When you receive a signal from it, you wait for that candle with the signal to close and you enter your trade at the beginning of the next new candle. A red arrow means sell and a green arrow means buy. for easy identification of trade signal. Are you okay with that?
The indicator cost $500. We release new updates of the indicator every month and the updates are for free once you bought the indicator first time. This indicator was de

KT DMA is a modified and advanced version of the classic Displaced Moving Averages with buy/sell crossover alerts and a Multi-Timeframe scanner that shows DMA's direction across each real-time time frame. A Displaced Moving Average is a simple moving average that moves ahead or backward in a time frame (either short-term or long-term). It also allows you to predict price movement more accurately.
Features Depicts the trend direction using the alignment of three moving averages. Buy/Sell signals

1. GENERAL DESCRIPTION OF THE TREND RENEWAL INDICATOR The Trend Renewal Indicator (TRI) is a simple yet very powerful trend-following indicator that works on the MT5 trading platform of MetaQoutes (MLQ5). The TRI indicator suits small and large accounts, and is ideal for very large accounts. It has been used for decades by fund managers and institutional traders, but never offered to retail traders. The TRI works with any instrument, including currencies, crypto currencies, metals, hard and soft

KT Triple Top-Bottom identifies the triple top/bottom pattern with a breakout signal in the opposite direction. It is used to identify potential trend reversals.
A Triple Top pattern is formed when the price reaches a high point three times, while a Triple Bottom pattern occurs when the price comes to a low point three times.
Features The indicator detects the triple top/bottom pattern with high precision and accuracy. The indicator suggests a shift in momentum, with sellers or buyers taking

Introducing the Aroon Indicator - Your Ultimate Trend Analysis Tool!
Are you looking to take your trading game to the next level? Want to identify lucrative entry and exit points in the financial markets with ease? Look no further! The Aroon Indicator is here to revolutionize your trading strategy and help you make informed decisions like never before.
Developed by the brilliant mind of Tushar Chande, the Aroon Indicator is a powerful technical analysis tool designed to measure the strength a
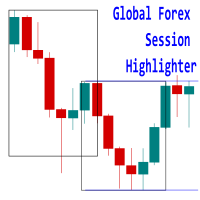
Introducing the 'Global Forex Session Highlighter' , a powerful tool designed to enhance your trading strategy by providing a visual representation of the Three major Forex trading sessions: Tokyo, London, and New York. This indicator is designed to help traders understand the dynamics of the global Forex market by highlighting the trading sessions directly on your MT5 chart. It provides a clear view of when each session starts and ends, allowing you to strategize your trades around the most act

Scopri il Canale di Regressione LT, un potente indicatore tecnico che combina elementi dell'analisi di Fibonacci, dell'analisi d'involucro e dell'extrapolation di Fourier. Questo indicatore è progettato per valutare la volatilità di mercato, migliorando al contempo la precisione nell'individuazione dei livelli di ipercomprato e ipervenduto attraverso l'analisi di Fibonacci. Sfrutta inoltre l'extrapolation di Fourier per prevedere le evoluzioni di mercato, integrando dati da questi indicatori. I
FREE

Ti presentiamo Quantum Heiken Ashi PRO Progettate per fornire informazioni chiare sulle tendenze del mercato, le candele Heiken Ashi sono rinomate per la loro capacità di filtrare il rumore ed eliminare i falsi segnali. Dì addio alle confuse fluttuazioni dei prezzi e dai il benvenuto a una rappresentazione grafica più fluida e affidabile. Ciò che rende il Quantum Heiken Ashi PRO davvero unico è la sua formula innovativa, che trasforma i dati tradizionali delle candele in barre colorate di faci

Questo indicatore è una versione demo di My candle completa che può essere scaricata qui: Candle Patterns Creator Con la versione completa, è possibile creare le proprie regole di candle e modificare un pattern di candle tradizionale per renderlo più preciso in base alla propria strategia. Nell'indicatore sono presenti diverse regole di candle di esempio, ma qui ne mostrerò solo alcune: Pattern Rule Candle Green C > O Candle Red C < O Doji C = O Hammer (C > O and (C-O) *2 < O-L and (C-O) *0.5 >
FREE

The main objective of this indicator is to determine entry and exit points, that is why ExactArrow draws nothing but arrows showing entry and exit points. In spite of apparent simplicity of the indicator, it has complicated analytic algorithms which determine entry and exit points. The indicator generates exact and timely entry and exit signals which appear on the current candle. The indicator generates an average of 1-2 candles before its analogues do. The indicator is very easy to use. Open Bu
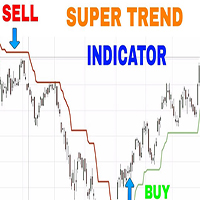
As the name suggests, it indicates the direction of the price movement in a market that is trending, that is following any particular path . It is plotted in stock price charts for investors to see marked current trend which is shown in red when prices have dipped and green when prices have risen.
Input Parameters:
CCI Indicator period ATR Indicator Period CCI Activation level Horizontal Shift of Indicator Bars
Otherwise ; You can use the Default settings

GeoInfo5 is one of the most informative indicators, it displays basic information about a trading instrument in a compact form. The version for the Meta Trader 4 terminal has gained wide popularity among traders. The indicator is free and will always be free. The launch version is now available for MetaTrader 5 as well.
displays information about the main parameters of the tool in a brief form in the line in the upper left corner of the chart: Spread, Swap for Buy order, Swap for Sell order, c
FREE

The Daily Highs and Lows Indicator is a versatile tool that combines support and resistance levels with real-time market dynamics. By incorporating previous daily highs and lows, it provides valuable insights into market psychology and identifies potential areas of price reversals or breakouts. With its ability to adapt to changing market conditions and customizable options, traders can stay ahead of trends and make informed decisions. This indicator is suitable for various trading styles and ti
FREE

Presenting the uGenesys Break of Structure and Change of Character Indicator The uGenesys Market Structure Indicator is the advanced solution designed specifically for forex traders seeking a competitive edge. This innovative tool goes beyond merely identifying Break of Structure (BoS) and Change of Character (CHoC); it also illuminates optimal entry and exit points on your forex charts, transforming your trading experience.
While the uGenesys Market Structure Indicator can reveal pivotal pat

3 candel indicator in 1 !!! The 3 most important candel indicator in 1 packadge. Help trader in chart visualisation, prevent reversal !!! Doji : Gravestone Doji, Long Legged Doji, Dragonfly Doji. Engulfing : Bullish, Bearish. Hammer : red hammer, green hammer. Fully parametrable indicator icon color config and alarm. Free life time update !!! Just try our demo for free.

The DVV indicator is a multifaceted informative indicator for the Forex market or the Cryptocurrency market . The indicator gives clear and reliable signals without redrawin g. The indicator can be used in bots by taking readings from its zero buffer.
Please note that for different currency pairs, the settings must be selected separately, this is not difficult.
Changing the input parameters greatly affects the display. I will show four options for using the indicator. The indicator has only o
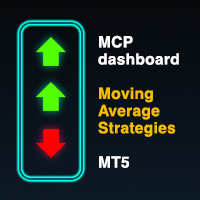
Multicurrency indicator in table format. Signals appear with confirmation, no repaints. Works on the current (open) timeframe. Notifications come for an open instrument. In the indicator settings, you can choose 1 of 4 Moving Average strategies. Strategies (represented in screenshots): Classic fast and slow moving average crossover Reverse signal of classic crossing (used for flat/sideways movement) Classic crossover relative to a slower moving average (Trend MA in settings) Price touching the f

Make Sure to Read the Description! UT Bot Plus contains free EA!
The EA can be downloaded from telegram channel: https://t.me/ +NSOJTvH39fNhZmU0
Unlock the Power of Automated Trading with UT BOT Indicator, Integrated with a FREE EA! ( Limited time offer ) This version has been expanded to include multiple additional filtering options. These options are fully configurable and can be switched on and off.
This versatile UT BOT indicator is crafted and optimized to work seamlessly with the FRE

Introducing the "Super Trend Filter Oscillator," your ultimate trading companion designed to enhance your technical analysis and help you make informed decisions in the financial markets. This innovative oscillator is crafted to provide valuable insights into market trends and price movements, assisting traders like you in identifying potential entry and exit points. Features: Trend Identification: The Super Trend Filter Oscillator excels in detecting prevailing market trends, whether they are b
FREE
ボリンジャーバンドは、価格変動を分析するためのテクニカル分析の1つのツールになります。
ボリンジャーバンドには、中心線と2つのバンドがあります。
中心線は、一般的には移動平均線(通常は20日間の単純移動平均)として計算されます。この中心線は、一定期間の価格の平均値を表しています。 ボリンジャーバンドのバンドは、中心線の上と下に等間隔で配置されます。通常は中心線から2つの標準偏差分だけ離れた位置に設定されます。 拡大(Expansion)とは、ボリンジャーバンドが広がる状態を指します。
つまり、上下のバンドが中心線から離れ、価格の変動範囲が広がっていることを示します。拡大は、相場が活発になり、価格の大幅な変動が起こりやすいことを示すことがあります。 収縮(Contraction)とは、ボリンジャーバンドが狭くなる状態を指します。
つまり、上下のバンドが中心線に近づき、価格の変動範囲が狭まっていることを示し、相場が方向感を失い、一時的に価格変動が鈍化していることを示すことがあります。 ボリンジャーバンドの収縮と拡大は、価格変動のパターンや相場の特徴を捉えるために重要な指標になり

The Spider ZIGZAG is an algorithm to determine how critical the current peak is by spreading several lines with different parameters instead of one line between each 2 peaks. 1. The more zigzag's lines meet at a peak the higher probability the market will go for correction or change direction. 2. Usually when 3-4 zigzag's lines meet at a peak, the market enters a correction period, this don't happen instantly, it might take some time. 3. Usually when 5-6 zigzag's lines meet at a peak, th
FREE

This MT5 version indicator is a unique, high quality and affordable trading tool. The calculation is made according to the author's formula for the beginning of a possible trend. MT4 version is here https://www.mql5.com/ru/market/product/98041 An accurate MT5 indicator that gives signals to enter trades without redrawing!
Ideal trade entry points for currencies, cryptocurrencies, metals, stocks, indices! The indicator builds buy/sell arrows and generates an alert. Use the standart B

Crash 500 indicator synthetic Update V2 No Repaint
This indicator works with a custom build in strategy
The indicator will only give a sell sign when market conditions are in place. Only for sell.
Medium to long trades use own proper risk management system. See screenshots for examples of arrow indicator.
Apply own risk management target profit and stop loss. When market conditions are met the sell sign will indicate you to enter a sell position and you will have to apply your risk manage

MT4 Version Understanding market sentiment is a critical aspect of successful trading. Market sentiment refers to the overall feeling or attitude of traders and investors towards a particular financial instrument, such as a stock, currency pair, or cryptocurrency. It is a collective perception of market participants' emotions and beliefs about the asset's future price direction. Market sentiment can be bullish (positive), bearish (negative), or neutral (sideways). Knowing the market sentiment ca
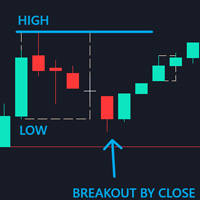
Control Candle is the candlestick which holds multiple inside bars and are in control until its high low range is broken by close of any candlestick. When control candle is broken, price may act on these control candle as support and resistance.
This indicator create rectangles on chart which will help you find control candles fast.
Control candle indicator box is customizable by color, style, width and other options in indicator settings.

Presentazione Quantum Trend Sniper Indicator , l'innovativo indicatore MQL5 che sta trasformando il modo in cui identifichi e scambi le inversioni di tendenza! Sviluppato da un team di trader esperti con un'esperienza di trading di oltre 13 anni, Indicatore Quantum Trend Sniper è progettato per spingere il tuo viaggio di trading verso nuove vette con il suo modo innovativo di identificare le inversioni di tendenza con una precisione estremamente elevata.
*** Acquista Quantum
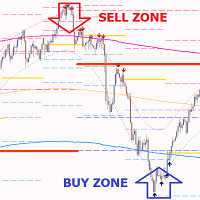
Gold PL MTF: questo è un ottimo indicatore tecnico azionario. L'algoritmo dell'indicatore analizza il movimento del prezzo dell'asset e riflette automaticamente gli importanti livelli pivot del timeframe specificato (TF) utilizzando il metodo di Fibonacci (sezione aurea).
L'indicatore descrive perfettamente la traiettoria del prezzo del timeframe selezionato (giorno, settimana, mese, anno), determina l'inizio di un trend e l'inizio di una correzione, che può svilupparsi in un trend opposto.
L

Calcola la variazione di prezzo su ogni timeframe: barre fluttuanti o ultime barre chiuse.
Utilità multifunzionale : 66+ funzionalità, inclusa questa tool | Contattami se hai domande | Versione MT4 Puoi selezionare lo spostamento della barra calcolata: Barre fluttuanti (attuali); Ultime barre chiuse (precedenti); Il tipo di valore di prezzo può essere selezionato usando l'interruttore blu nella riga superiore: Pip; Punti di mercato; Valore percentuale (%); Valore di prezzo; Il meto
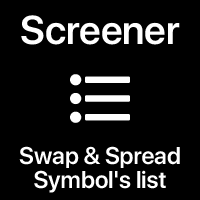
Selettore di mercato: Prezzo, Spread e Swap, per simboli selezionati (Market Watch) Puoi personalizzare l'elenco: imposta solo i simboli (coppie di valute) necessari. Il numero di simboli è illimitato. L'elenco può essere ordinato in ordine crescente o decrescente (nome del simbolo). Il pannello può essere spostato in qualsiasi posizione sul grafico. Puoi anche minimizzare il pannello. C'è un 'opzione per notificare l' aumento della dimension e del spread rispetto al valore medio. La mia #1 Ut

Visualizzazione delle transazioni distribuite per livelli di prezzo. Puoi impostare qualsiasi periodo per il calcolo: tra due linee verticali o un intervallo di tempo fisso. I livelli dell'istogramma sono relativi: una barra più larga significa un volume di trading maggiore. Gli estremi della distribuzione possono essere usati come livelli di supporto e resistenza.
Tutti gli stili, le dimensioni e i colori sono personalizzabili. Utilità multifunzionale : include 66+ funzioni | Contattami s

Presentiamo il Didi Index Volume, un indicatore di analisi tecnica sviluppato dal trader brasiliano Odir Aguiar, che si distingue per il suo approccio avanzato e potente nell'individuazione delle opportunità nei mercati finanziari. Disponibile su diverse piattaforme, il Didi Index Volume è diventato uno strumento essenziale per i trader che cercano informazioni precise e preziose per le loro strategie di trading.
L'indicatore combina il rinomato Didi Index, creato da Odir Aguiar, con l'intellig

Informazioni generali Vi presentiamo il nostro indicatore di analisi tecnica all'avanguardia che predice le tendenze utilizzando molteplici fonti dai grafici tecnici, appositamente sviluppato per le coppie di valute EURUSD, EURJPY ed EURGBP nel mercato forex. Questo strumento all'avanguardia è progettato per fornire ai trader informazioni accurate e affidabili sulle potenziali tendenze di mercato e sulle variazioni dei prezzi, consentendo loro di prendere decisioni consapevoli riguardo alle prop

Introducing the Kangaroo Hunter - Your Ultimate Edge in Forex Trading ATTENTION Forex Traders! Are you in constant pursuit of high-probability trade setups? Or maybe you're a novice trader struggling to pinpoint precise entry and exit points? Our solution, the Kangaroo Hunter, is about to revolutionize your trading journey. This meticulously designed indicator simplifies and refines the art of identifying the often elusive Kangaroo Tail patterns in the Forex market, pushing your trading strateg

Man Trend uses at its core the process of identifying the rate of change in price growth and allows you to find entry and exit points from the market.
The indicator was created on the basis of the original indicators for searching for extreme points, the indicator is well suited for determining a reversal or a large sharp jerk to one of the sides, thanks to it you will know when this happens, it will notify you with the appearance of a blue dot to buy red to sell.
This is a fundamental techni

Introducing the "Cybercycle Trend" Forex Oscillator, a powerful technical indicator designed to enhance your trading experience in the foreign exchange market. This innovative tool utilizes advanced algorithms to identify and analyze market trends, providing you with valuable insights and helping you make informed trading decisions.
The Cybercycle Trend Forex Oscillator is specifically designed to detect and measure cyclical price movements in the forex market. By incorporating this oscillator
FREE

Introducing the Power Trade Plus indicator designed by a small group of traders with a few years of experience trading the market profitably. The Power Trade Plus is derived from the Power Trade indicator, the indicator strive in powerful sniper entries and take profit levels, with an algorithm that's can determine the markets volatility and Provides entries based on the current market volatility. This indicator is much more effective in stock ,currencies and indices.

Entry Pro Indicator is a powerful multi-functional trading tool designed to increase your market entry accuracy. It combines the power of several key market trend indicators, including ATR Trailing Stop and both fast and slow EMA, to provide comprehensive market insight. It offers easy-to-interpret market entry signals represented by colored arrows. Also, it's fully customizable, allowing you to adjust ATR and EMA periods to suit your trading strategy. Trend filters and alerts can be toggled on

Meet the Tweezer Hunter, an essential tool for every Forex trader looking to make accurate, trend-following trades. This powerful, intuitive indicator helps traders spot potential trend reversals before they happen, providing a significant advantage in the fast-paced world of Forex trading. The Tweezer Hunter is more than your average tweezer candle indicator; it's designed with a built-in trend identification feature that accurately detects whether the market is bearish or bullish. By integrat

This indicator uses candlesticks with large real bodies to predict possible market structure shift. Displacement is a very powerful move in price action resulting in strong selling or buying pressure. Generally speaking, displacement will appear as a single or a group of candles that are all positioned in the same direction. These candles typically have large real bodies and very short wicks, suggesting very little disagreement between buyers and sellers. Often, a displacement will occur just af
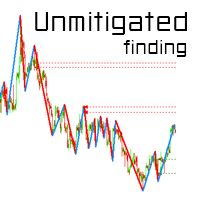
SMC Unmitigated Finding is a indicator for find unmitigated supply and demand in previous legs of price
Settings Zigzag Settings ZZDepth - by Default is 12.
ZZDeviation - by Default is 5.
ZZBackStep - by Default is 3. Horizontal Line Settings SupportColor- color for Support line.
ResistanceColor - color for Resistance line. Settings Num of Show - Number of Support & Resistance Show.

C300 SYNTHETIC INDICATOR 1MIN CHART Update V2 No repaint
*The indicator will not give a sell sign if the market conditions are not in place. *With all 3 strategy criteria in place the strategy based indicator signals 1-3 trades per day. *The drawdown can range to very high you need to place your own target profit and stop loss according to your risk management system . *The indicator is designed for only C300 and the 1min chart .
NB :Note this strategy based indicator will be free only for

Gioteen Volatility Index (GVI) - your ultimate solution to overcoming market unpredictability and maximizing trading opportunities. This revolutionary indicator helps you in lowering your losing trades due to choppy market movements. The GVI is designed to measure market volatility, providing you with valuable insights to identify the most favorable trading prospects. Its intuitive interface consists of a dynamic red line representing the volatility index, accompanied by blue line that indicate
Cos'è l'indicatore Currency Magician Matrix? Un indicatore Currency Magician Matrix è uno strumento grafico che mostra la forza di una valuta. Gli indicatori comuni di solito mostrano la forza di una valuta rispetto a un'altra valuta, tuttavia, con alcuni calcoli è possibile trovare la forza assoluta di ogni singola valuta. Pertanto, un indicatore Currency Magician Matrix (o metro) è uno strumento che cerca di esprimere la forza assoluta di una valuta, in modo da poter confrontare questa forza c

Presentazione Quantum Breakout PRO , l'innovativo indicatore MQL5 che sta trasformando il modo in cui scambi le zone di breakout! Sviluppato da un team di trader esperti con un'esperienza di trading di oltre 13 anni, Quantum Breakout PRO è progettato per spingere il tuo viaggio di trading a nuovi livelli con la sua strategia innovativa e dinamica della zona di breakout.
Quantum Breakout Indicator ti fornirà frecce di segnalazione sulle zone di breakout con 5 zone target di

Questo è un sistema multiuso che si adatta sia ai trader manuali Forex sia como sistema scalper o una strategia per ottenere uno slancio molto forte, trader di opzioni binarie o per essere utilizzato dagli EA universali nel trading di automazione. Questo è un sistema multiuso che si adatta sia ai trader manuali Forex sia como sistema scalper o una strategia per ottenere uno slancio molto forte, trader di opzioni binarie o per essere utilizzato dagli EA universali nel trading di automazione.
J

ICT, SMC, Smart Money Concept, Support and Resistance, Trend Analysis, Price Action, Market Structure, Order Blocks, Breaker Blocks, Momentum Shift, Strong Imbalance, HH/LL/HL/LH, Fair Value Gap, FVG, Premium & Discount Zones, Fibonacci Retracement, OTE, Buyside Liquidity, Sellside Liquidity, Liquidity Voids, Market Sessions, NDOG, NWOG,Silver Bullet,ict template
Nel mercato finanziario, un'analisi di mercato accurata è cruciale per gli investitori. Per aiutare gli investitori a comprendere me
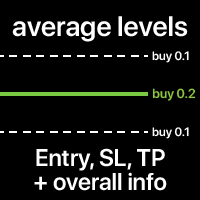
I livelli medi di Entry, SL e TP di tutte le operazioni sul simbolo. I livelli possono essere calcolati insieme o separatamente per operazioni di acquisto e vendita. Puoi opzionalmente visualizzare informazioni aggiuntive: prezzo del livello, dimensione totale dei lotti, P/L fluttuante. Gli stili e i colori dei livelli sono personalizzabili. Utilità multifunzionale : include 66+ funzionalità | Contattami se hai domande | Versione MT4 Nelle impostazioni dell'indicatore, puoi configurare: L
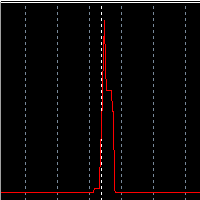
Hello! My name is Saullo and I am an MQL5/4 programmer specializing in custom services for Metatrader.
This is a very simple indicator that shows on the chart the history of the spread of each candle of the chart's asset.
Follow me on instagram: @saullo_algotrader
If you need custom development services for metatrader contact me on instagram. Thank you very much!
FREE
Il MetaTrader Market offre un luogo pratico e sicuro dove acquistare applicazioni per la piattaforma MetaTrader. Scarica versioni demo gratuite di Expert Advisors e indicatori direttamente dal tuo terminale e testali nello Strategy Tester.
Prova le applicazioni in diverse modalità per monitorare le prestazioni ed effettuare pagamenti per i prodotti desiderati, utilizzando il sistema di pagamento MQL5.community.
Ti stai perdendo delle opportunità di trading:
- App di trading gratuite
- Oltre 8.000 segnali per il copy trading
- Notizie economiche per esplorare i mercati finanziari
Registrazione
Accedi
Se non hai un account, registrati
Consenti l'uso dei cookie per accedere al sito MQL5.com.
Abilita le impostazioni necessarie nel browser, altrimenti non sarà possibile accedere.