 MetaTrader 5
 Experts
 Indicatori
 librerie
 Utilità
 Widget
 Regole
Guarda i video tutorial del Market su YouTube
Come acquistare un Robot di Trading o un indicatore
Esegui il tuo EA
hosting virtuale
hosting virtuale
Prova un indicatore/robot di trading prima di acquistarlo
Vuoi guadagnare nel Market?
Come presentare un prodotto per venderlo con successo
Indicatori tecnici a pagamento per MetaTrader 4 - 140
 I segnali degli indicatori tecnici elencati di seguito hanno un ruolo cruciale nell'apertura e nella chiusura delle transazioni nella piattaforma MetaTrader 4. L'essenza degli indicatori è una trasformazione matematica del prezzo di un simbolo finanziario finalizzata a prevedere i cambiamenti di prezzo.

BREAKOUT SNIPER PRO Smart BUY STOP & SELL STOP Trading System Catch the Breakout. Plan Your Entry. Manage Your Risk. BREAKOUT SNIPER PRO is a professional trading indicator designed for traders who want to capture potential market breakout opportunities with a structured pending order strategy. Using BUY STOP and SELL STOP levels, the indicator helps identify potential entry opportunities before price reaches key breakout levels. It automatically displays the suggested entry price, Stop Loss (SL

SUPPORT RESISTANCE EDGE Advanced Support & Resistance Trading Indicator Identify Key Market Levels. Understand Price Behavior. Make Smarter Trading Decisions. SUPPORT RESISTANCE EDGE is a professional trading indicator designed to help traders identify important Support and Resistance levels and better understand market price structure. Support and Resistance are among the most widely used concepts in technical analysis. These key price levels can help traders recognize areas where buying or sel

Smart Trend Filter Smart Trend Filter is a technical indicator for MetaTrader designed to help traders identify market trends, recognize potential BUY and SELL opportunities, and visualize trade risk and reward directly on the chart. Combining Moving Average (MA) and Average True Range (ATR) concepts, the indicator provides a dynamic trend-following framework with visual trading signals, adaptive trailing stop levels, and multiple take-profit targets. Whether you trade Forex, Gold, or other fina

Account Summary Panel: Your Trading Results at a Glance Stop digging through the History tab. This indicator puts your daily, weekly and monthly performance on your chart in one clean dashboard, updated automatically as you trade.
Your capital, your rules Set your own Initial Balance, whether that’s your full account or just the amount assigned to this month’s plan. Every percentage is measured against the number you choose.
Built-in goal tracking Enter one Weekly Goal % and the panel does th

Come si legge l'indicatore (Guida Rapida) Sullo schermo, la mappa volumetrica si legge seguendo questi punti chiave: La Linea Rossa Superiore (VAH - Value Area High / Offerta): Rappresenta il confine superiore del 70% dei volumi scambiati. Funziona come una forte resistenza e zona di offerta : quando il prezzo sale fino a testarla, i venditori istituzionali tendono a respingerlo verso il basso . La Linea Arancione Centrale (POC - Point of Control): È il livello con il volume più alto in assoluto

Draws the levels. Tracks the outcomes. Promises nothing.
Multi Timeframe Trendline Sniper Gold (MTS) is a liquidity and structure mapping tool for MetaTrader 4. If you trade gold by hand, MTS removes the chart work: no more flipping between M5, M15, M30, H1 and H4 to mark trendlines and liquidity before every session. The map is drawn on your M1 chart, labeled, and tracked, so you can focus on the decision and not on the marking.
MTS draws levels and context. It places no orders and does not

Supply and Demand Master — Non-Repaint Zone Indicator for MT4 Institutional-grade supply and demand zone indicator for MT4 Real-time pending signals, 100% non-repainting confirmed zones, 6 alert channels, signal arrows, and a live status panel. Works on every symbol and timeframe. [THE TRUTH MOST RETAIL TRADERS NEVER LEARN]
Markets don't move on news, indicators, or patterns. They move on ORDERS — and the orders that move price are left sitting at SUPPLY AND DEMAND ZONES.
Supply and Demand M

WANT TO GET HILO FLOW MANAGEMENT WITHOUT PAYING FOR THE INDICATOR LICENSE? Discover our partnership with TMGM and learn how to request your Hilo Flow Management license for MetaTrader 4 or MetaTrader 5 at no additional license cost, subject to the partnership requirements. ACCESS THE COMPLETE STEP-BY-STEP GUIDE:
https://dougscalper.com.br/hiloflow/ To qualify, you must open an eligible account through the partnership link, make an initial deposit of US$200 with TMGM, and submit your license req

Come funziona l’indicatore Big Stoch visualizza fino a quattro mini-pannelli dell’oscillatore Stocastico direttamente sul grafico principale dei prezzi. Ogni pannello viene calcolato usando i dati del proprio timeframe e dispone di parametri %K, Slowing e %D indipendenti. È quindi possibile osservare, ad esempio, M15, M30, H1 e H4 nello stesso momento senza cambiare il timeframe del grafico principale. I valori dell’oscillatore vanno da 0 a 100. MT5-version: https://www.mql5.com/en/market/produc

Charts247 Market Structure Sessions
The full Charts247 market structure: swings, CHoCH and BOS, intraday highs and lows by session, structure trend, session read, zigzag counter, break count, alerts and a control panel. Closed candles only.
Charts247 Market Structure Sessions shows market structure the way the Waves of Success method reads it, and places each intraday high and low in the session where it printed. Everything is calculated on closed candles; nothing on history is redrawn. What

Rumer Magic Lines - Previous Day High Low, Swing Levels, Session Opening Candles and Smart Arrows for MT5
Rumer Magic Lines is an automatic support and resistance indicator for MetaTrader 5. It draws the previous day high and low, the previous day midline, the true swing high and swing low, and the first M15 candle of the Asia, London and New York sessions on your chart, then tracks a three-stage price action setup at those levels and shows it with colour-coded arrows, stop and target lines an

Charts247 Wave Master MTF
A complete 0-5 wave count with a built-in rules panel: it reads both directions on your chart and on a higher timeframe, grades every wave, maps the major structure and marks where price spent the most time. Closed candles only. Most wave tools leave you with numbers on a chart and the hard part still to do: is this wave worth trading, which side has the trend, and does the bigger timeframe agree? Wave Master MTF answers all three on one screen. It runs the Waves of S

Charts247 Break and Count
Spots the moment a rising support (or falling resistance) gives way, marks the entry candle and its stop, then maps the reversal level and counts the lows (highs) beyond it: buy low, no trade, buy low, continuation. Closed candles only.
A support line that has held three times is one of the most watched structures on any chart. When it breaks, two trades follow: the break itself, and later the reversal from the exhaustion lows. Break and Count marks both, on fixed ru

Charts247 Daily Currency Matrix Every currency and every pair starts the day at zero and moves in pips, on one screen: see which currency is driving the market today, which pairs carry the move, and whether the H4 candles agree. Strongest to weakest, updated every second. A pair is only ever two currencies pulling against each other. When EURUSD rises, is the euro strong or the dollar weak? The Daily Currency Matrix answers that before you open a single pair chart: it resets every currency and

A Malaysian SnR (MSNR) indicator that draws A, V, gap and OCL levels from three timeframes, keeps track of which levels are still fresh, and reads the MSNR storyline for you. The MSNR radar watches your Market Watch and shows which symbol sits at a fresh D1 or H4 level right now. Every level and every storyline turn is confirmed on a closed candle, so the levels you see on past candles are the same levels the chart showed live. What you get All MSNR level types: A levels (resistance), V levels (

Supreme Range Profile Structure finds sideways ranges from the market's own swings, shows where the volume traded inside each one, marks the moves that left the range and failed, and draws a position tool when a range finally breaks. A range is drawn only when recent swing highs and lows cluster tightly, alternate often enough, span enough bars and fit an ATR width window, so it marks a real balance rather than any pause. Breaks and failed breaks are decided on a closed bar and stay where they

Supreme Dynamic Profile builds a volume profile of the most recent bars and turns it into a set of key levels. It finds the point of control, the value area and the volume peaks of the profile, keeps them on the chart as zones and lines, and marks every bar where price breaks a level, rejects it or comes back to retest it. A table in the corner sums up where price stands against the profile. Every level and every marker is decided when a bar closes and stays where it was drawn.
- MT5 version -

Supreme Power House reads market structure, grades every signal against seven filters and draws a complete trade plan for each one. It prints a BUY or a SELL when a candle closes beyond the latest swing: a change of character (CHoCH) when the break turns the structure, a break of structure (BOS) when it continues it. Each signal comes with an entry, a stop, up to three targets and a grade from A to C, surrounded by an adaptive trend ribbon, ICT zones and a dashboard of six timeframes. Everythin

Charts247 Liquidity Engine Where the liquidity rests, when it is taken, and the entry that follows: the Waves of Success Alt count, liquidity rays and sweep count, Free State entries with entry and stop, a location gate, internal 2X setups and a higher-degree Free State structure. Closed candles only. Price moves from one pool of liquidity to the next. The highs and lows where stops collect get taken, and the move that follows a sweep is where the opportunity sits. Charts247 Liquidity Engine fo

Charts247 Price Value Bands
Is price cheap, fair or stretched right now? Fair value with value bands measured from how far price really travels, the share of closes beyond each band, return arrows, a two-close T3 line, confirmed peaks and the M5 Fibonacci. Nothing repaints. Every market swings around a fair value. Most of the time it stays close; now and then it stretches far away, and from there it usually comes back. Charts247 Price Value Bands shows how far is far for the symbol and timefra

One chart. Nine timeframes. One clear reading. Most traders work with RSI in one window, ADX in another, sessions on a third chart and a calculator open on the side. By the time everything is checked, the picture is scattered and the decision is made in a hurry. Legion SuperPanel puts all of that in one panel on your chart and tells you, in plain words, where the readings agree and where they do not. You stop switching windows and start reading the market as a whole. The panel is read-only. It d

MARKESS HUNTER - Daily Session & Killzone Map Markess Hunter Daily Session & Killzone Map is inspired by the patterns that occur in each market session. We believe each market session has its own character. These patterns, statistically, generate certain levels that can be used as a Killzone area. These levels are calculated based on time per session and statistical mathematical calculations of the daily average (ADR). Each session has its own color and its own levels, making it easy to disting

REAL RAW | Suite Professionale Volumi & Order Block Istituzionali REAL RAW è un indicatore di trading professionale di altissima precisione, progettato per i trader più esigenti che pretendono la massima trasparenza dai mercati. Sviluppato senza l'ausilio di filtri matematici ritardati o alterazioni artificiali, questo strumento lavora su dati istituzionali grezzi al 100% , svelando le reali impronte dello "Smart Money", le grandi aree di liquidità e le zone di accumulo dove vengono movimentati

WZY Whale Fall Structure Lines for MetaTrader 4
A clearer way to read the chart.
WZY Whale Fall Structure Lines is a visual market-structure companion for traders who want important price areas to stay visible without covering the chart with manual drawings or extra indicator panels. It brings a calm, organized layer of support and resistance context to the main chart, so you can spend more time reading price and less time maintaining annotations.
When the market moves quickly, attention bec

Panoramica Gnomon Diurnal Cone mostra quanto il prezzo si allontana normalmente dall'apertura del giorno a ogni ora della giornata. Per ogni fascia intraday prende gli ultimi N giorni completi e disegna l'escursione mediana sopra e sotto l'apertura (cono centrale) e un percentile scelto (cono esterno). Il cono di oggi viene fissato all'apertura del giorno solo con giorni conclusi, quindi non si ridisegna mai, e viene proiettato fino alla fine della giornata. Un budget di range confronta il range

Ottieni TUTTI i miei strumenti MT4 & MT5 GRATIS — Scopri come qui
Guida a più timeframe e simboli: Guida all’uso di Multi-Timeframe e Scanner - Disponibile in 12 lingue Scopri la versione MT5 qui: Trend Fair Value Gap Delta Multi TF Scanner per MT5 Scopri la versione MT4 qui: Trend Fair Value Gap Delta Multi TF Scanner per MT4 Scopri altri prodotti qui: Tutti i p rodotti oppure Indicatori di trading, offerte speciali e novità I nuovi strumenti costeranno $30 durante la prima se

What this is Draws the high and low of a configurable session window together with the recent range history, so the levels that price has repeatedly reacted to are visible without hand-drawing them every day. What it does Marks the high and low of a configurable session for the last N sessions as extending levels. Historical session ranges kept as live trend lines, configurable wrap-around sessions. Runs as an Expert Advisor attached to a single chart. No DLL calls. No external services. No netw

ROCKET4 SUPER TREND CHANNEL See the Trend. Read the Momentum. Trade with Confidence. Stop guessing the market direction. Start reading it with a clearer view. ROCKET4 SUPER TREND CHANNEL is a professional technical indicator for MetaTrader 4 that combines a dynamic trend channel with momentum-based scalp signals in one powerful chart interface. Designed for traders who want to identify market direction, follow trend development, and recognize potential trading opportunities without cluttering th

ICT Killzones Pro Auto DST MT4 Know When to Trade. Keep Your Chart Clean. Stop cluttering your charts with session boxes and vertical lines. ICT Killzones Pro Auto DST brings a cleaner approach to trading session visualization. Designed for traders using Inner Circle Trader (ICT), Smart Money Concepts (SMC), liquidity analysis and price action , this MetaTrader 4 indicator displays the four key ICT trading windows as elegant, color-coded horizontal lines in a separate window beneath your chart.

What this is Ranges compress before they expand. This indicator finds the bars where the Bollinger band width is in the lowest percentage of a lookback window and where the compression has lasted for a minimum number of bars, then draws each zone as a box with the upper and lower breakout levels extended to the right and the box height in points. What it does Marks historical squeeze zones where Bollinger width sits in the lowest x% of the lookback, boxes each run, extends the two breakout level

What this is An ATR value of 12 points means very different things on EURUSD H1 and on gold M5. This indicator turns ATR into a percentile: the current ATR is ranked against the previous bars, and the result is plotted on a 0 to 100 scale with four bands. 20 means the market is quieter than 80 percent of the recent past; 90 means it is near the most volatile reading of the window. What it does Plots the percentile rank of ATR over a lookback window as a 0-100 oscillator with LOW / NORMAL / ACTIV

What this is A currency is not strong or weak on its own; it is strong or weak against the others. This dashboard builds one score per major currency by measuring the change of every pair that currency appears in and crediting the base side with that change while debiting the quote side by the same amount. Averaging those credits gives eight numbers that can be compared directly. What it does Builds one strength score per currency from the change of every pair it appears in, and ranks all eight

What this is Every symbol has a typical day. When a symbol has already travelled most of that distance, the rest of the day usually holds less, and a breakout strategy that works on a fresh day can stall on a spent one. This indicator measures the average daily range from history and projects half, three quarters and all of it above and below today open, so the scale of the current move is obvious at a glance. What it does Measures the average daily range over N days and projects 50%, 75% and 10

What this is Pivot levels give a reference frame for the day without any indicator clutter: where the previous period balance sits, and where the likely support and resistance are. This indicator draws daily, weekly and monthly pivots at once, in classic, Fibonacci, Camarilla or Woodie form, labelled with their prices. What it does Draws daily, weekly and monthly pivots at once in one of four methods: classic, Fibonacci, Camarilla or Woodie. Three timeframes of pivot structure in one tool with t

What this is Weekend gaps are one of the few market events that can be measured exactly on your own chart. This indicator marks every gap between the Friday close and the Monday open, draws it as a zone, and reports what share of the recent gaps were filled and how long the fill took on average for this symbol. What it does Finds every weekend gap, draws it as a zone and reports what share of the last N gaps were filled and how many bars the fill took on average. Converts a folk belief into a pe

Fibonacci Trend Multi Timeframe
A NEW INDICATOR EITHER FOR THE BEGINNERS OR PROFESSIONALS. This indicator supports Multi-Timeframe analysis . This way, for example, while viewing a 1-hour (H1) chart, you can calculate the Fibonacci trend and levels from a 4-hour (H4) or Daily timeframe in the background and receive signals accordingly. Indicator shows Fibonacci retracement levels inside an adaptive trend structure. It combines a smoothed price midline, volatility-based outer bands, and Fibonac

VWAP Sentinel è un sistema completo di analisi VWAP che combina diversi livelli di calcolo VWAP, livelli VWAP storici persistenti, analisi delle deviazioni e una matrice VWAP dinamica multi-simbolo in un unico strumento di trading integrato. Questo indicatore va ben oltre il semplice VWAP. VWAP Sentinel introduce una struttura di calcolo multi-core che conserva i valori di riferimento VWAP precedenti e i relativi livelli di deviazione, mantenendoli visibili sul grafico fino a quando il prezzo no

Livelli pivot giornalieri, settimanali e mensili in stile Classic, Fibonacci, Camarilla o Woodie, disegnati prima dell'inizio della sessione, con etichette e prezzi chiari.
AurumEdge Level Grid MT4 disegna i livelli pivot che molti trader usano come supporti, resistenze e obiettivi. Ogni livello è calcolato dal periodo precedente, quindi è sul grafico prima che il prezzo ci arrivi.
COSA MOSTRA - Pivot (P), resistenze da R1 a R3 e supporti da S1 a S3 (Camarilla aggiunge R4 e S4) - Pivot giorna

Etichetta i massimi e minimi di swing (HH, HL, LH, LL), segnala le rotture di struttura e i cambi di carattere e mostra il trend del timeframe superiore. Nessun repaint.
AurumEdge Trend Compass MT4 legge la struttura di mercato per voi, così vedete a colpo d'occhio se il mercato sta facendo massimi e minimi crescenti o massimi e minimi decrescenti.
COSA MOSTRA - Etichette di swing: HH (massimo più alto), HL (minimo più alto), LH (massimo più basso), LL (minimo più basso) - BOS (rottura di str

AXOS Pure Price Action – Professional Smart Money & Price Action Indicator for MetaTrader 4 (MT4) Price Action Analysis | Smart Money Concepts (SMC) | ICT-Style Market Analysis | Supply & Demand Zones | Liquidity Sweeps | Break of Structure (BOS) | Change of Character (CHoCH) | Fair Value Gaps (FVG) | Premium & Discount | Volume Analysis | Zone Touch Signals Introduction AXOS Pure Price Action is a professional technical analysis indicator developed for MetaTrader 4 (MT4) . It combines price act
Auto Order Block with break of structure based on ICT and Smart Money Concepts (SMC)
Futures Break of Structure ( BoS )
Order block ( OB )
Higher time frame Order block / Point of Interest ( POI ) shown on current chart
Fair value Gap ( FVG ) / Imbalance - MTF ( Multi Time Frame )
HH/LL/HL/LH - MTF ( Multi Time Frame )
Choch MTF ( Multi Time Frame )
Volume Imbalance , MTF vIMB
Gap’s Power of 3
Equal High / Low’s

Mostra i livelli di sessione e giornalieri dove si trova la liquidità, segnala quando il prezzo li spazza e evidenzia i fair value gap. Nessun repaint.
AurumEdge Sweep Radar MT4 traccia i livelli di riferimento chiave che molti trader intraday osservano, e vi segnala quando il prezzo attraversa uno di essi e viene respinto.
COSA MOSTRA - Massimo e minimo della sessione asiatica, con il range asiatico ombreggiato - Massimo e minimo del giorno precedente (PDH / PDL) - Sweep di liquidità: una fr

Ombreggia l'area in cui un pullback ha più probabilità di girare, prima che il prezzo ci arrivi, e la valuta in base a quanti strumenti indipendenti concordano su quell'area.
AurumEdge Turning Zones MT4 trova l'ultimo swing significativo e segna la sua zona di pullback. Poi controlla se altri strumenti indicano la stessa area, e rende la zona più luminosa quando lo fanno.
COSA MOSTRA - L'ultimo swing significativo (una linea tratteggiata dall'inizio alla fine) e i suoi livelli di ritracciamen

Segnala le candele di rifiuto che si formano in aree di prezzo significative, valutate A, B o C in base a quante aree concordano. Confermato alla chiusura della candela: non viene mai ridisegnato.
AurumEdge Rejection Signal MT4 cerca candele con una lunga ombra che sono entrate in un'area e sono state respinte. Le mostra solo quando si formano in un punto significativo.
LE AREE CHE CONTROLLA - Livelli pivot giornalieri (P, da R1 a R3, da S1 a S3) - La zona di pullback dell'ultimo swing (dal 6

AurumEdge Market Scanner MT4 vi risparmia di sfogliare un grafico dopo l'altro. Un solo pannello mostra dove si trova il trend su molti simboli e timeframe contemporaneamente, così potete dedicare il vostro tempo ai grafici che contano.
Ogni riga mostra - Il trend su ogni timeframe (predefiniti M15, H1, H4, D1): forte rialzo, rialzo, nessun trend chiaro, ribasso, forte ribasso - RSI su un timeframe a scelta (predefinito H1), evidenziato a 70 e oltre o a 30 e sotto - Range del giorno: quanta

Ten Moving Averages Display up to ten moving averages on one chart, with separate settings for each line. This indicator does not open or close trades, provide entry/exit signals or promise profit. Settings For each line, choose:
- Type: RMA (Wilder / smoothed), SMA, EMA, WMA, HMA (Hull) or VWMA.
- Length and color. HMA uses a minimum length of 2.
- Price or timeframe: Normal MA, Chart and Multitimeframe MA use the chart close. Open, High, Low, Close, hl2, hlc3, ohlc4 and hlcc4 use the selected
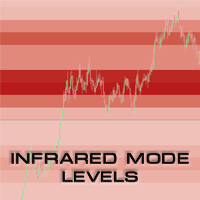
UPDATE 3 - Scan what you see - the indicator will scan and draw levels for all VISIBLE bars on the chart, rather than Current Bar - till first visible bar on the chart (historical bar on the left side). Assumption is, if you are going back in history and you want to check levels, you care about that specific moment in time and what the levels were during that moment (excluding data of the future which is not visible). UPDATE 2 - version 2.1 introduces the "Always ON" feature. If enabled, you ca

Big BB — mini-pannelli di Bande di Bollinger su quattro timeframe in un unico grafico Big BB colloca pannelli compatti direttamente sul grafico dei prezzi. Ogni pannello mostra le candele recenti di un timeframe scelto insieme alle Bande di Bollinger di quel timeframe. Non serve passare da M15 a M30, H1 e D1: tutti sono visibili contemporaneamente. Ogni timeframe ha il proprio periodo e la propria deviazione delle Bande di Bollinger. Versione per MetaTrader 5: https://www.mql5.com/en/market/pro

Indicatore Crypto_Forex HTF Stocastico per MT4. - L'oscillatore stocastico è uno dei migliori indicatori sul mercato, strumento perfetto per molti trader. HTF significa - Higher Time Frame. - Zona di ipercomprato: sopra 80; ipervenduto uno: sotto 20. - L'indicatore HTF Stocastico è eccellente per i sistemi di trading Multi-Time Frame, in particolare con voci Price Action. - Questo indicatore consente di collegare lo stocastico da un time frame più alto al grafico corrente, ovvero un approccio d

SMC Liquidity Sweep with Buy Sell Zones è un indicatore di trading istituzionale avanzato e all-in-one, nativo per MetaTrader 5 (MT5). Colma il divario tra la classica analisi dei punti di swing e la moderna metodologia della price action istituzionale. Identificando automaticamente i cambiamenti strutturali, gli eventi di liquidità, gli Order Blocks (OB) e i Fair Value Gaps (FVG), questo indicatore fornisce ai trader zone di esecuzione chiare e basate su regole. Progettato con un'interfaccia ut

Velox Momentum Confluence Engine puts six momentum and money-flow readings on one scale and blends them into a single score from -100 to +100. Instead of six separate windows, you read one line, its signal line, and how many of the six agree with the move. A signal needs the score to cross its signal line with enough agreement behind it. Each signal maps an ATR stop and three targets, the candles take the score's colour, and a dashboard shows the state of every component and filter.
- MT5 vers

Supreme Pressure Signals looks for one event: a burst that runs out of fuel. A bar's high or low travels far beyond a volatility band around its average, the next bar stops expanding, and the indicator marks a signal against the burst, back toward the average. Around that core it maps pressure clusters at swing points, tracks timed session ranges, rates every signal from 0 to 10 with up to four stars, and draws a ticket with an entry, a stop and three targets.
- MT5 version - Trading guide - U

Supreme Momentum Confluence turns six oscillators into one reading. RSI, the smoothed stochastic, CCI, the MACD histogram, rate of change and the Money Flow Index are each rescaled to the same -100 to +100 range and averaged by weight. One line, its signal line and the share of the six that agree then tell you what six windows would. A signal needs that line to cross its signal line with enough of the weight behind it. Each signal maps an ATR stop and three targets, the candles take the score's

Gold Signal Alerts · Pocket Signals · Away From Screen Alerts
Clear BUY/SELL signals for Gold (XAUUSD) and other pairs, sent straight to your phone. No need to sit at your screen. Full description: Trade without being chained to your computer.
This indicator watches the market for you and sends a push notification to your phone when a BUY or SELL setup appears. Set it up once, then get on with your day. What you get Mobile push notifications with direction, entry, stop loss and multiple take-p

Trend Change Indicator — reversal signals at daily imbalance crossings A multi-symbol indicator: works on any instrument — forex pairs, metals, indices, oil and crypto. The logic is the same across all markets: the indicator detects imbalances (Fair Value Gaps — sharp moves leaving a "gap" between one candle's close and the next candle's open) and highlights the moment market sentiment shifts, when an opposite-direction zone overlaps the previous one. Recommended usage The indicator runs on any

Big KC — pannelli dei Canali di Keltner per più timeframe Big KC mostra i Canali di Keltner di un massimo di quattro timeframe contemporaneamente, in un pannello compatto posizionato direttamente sul grafico dei prezzi. Non serve cambiare grafico né aprire finestre aggiuntive: volatilità e direzione di più timeframe sono visibili allo stesso tempo. Ogni timeframe ha le proprie impostazioni del canale. MetaTrader 5 version: https://www.mql5.com/en/market/product/207053
Come funziona L'indicator

DRX DrawPad: strumento di disegno sul grafico e pianificatore di trade Risk/Reward per MetaTrader 5 DRX DrawPad trasforma MetaTrader 5 in uno spazio di analisi visiva completo. Disegni, misuri e pianifichi i trade direttamente sul grafico MT5, in modo rapido e preciso, senza alcun software esterno. Disegno a mano libera, trendline, frecce, Fibonacci, zone, testo, righello di misura e un pianificatore di posizioni Long/Short con calcolo automatico del lotto, tutto in un pannello scuro e compatto

AlphaWave – Indicatore di trend senza repaint con segnali di acquisto/vendita e avvisi per MT5 AlphaWave è un indicatore di trend per MetaTrader 5 che ti mostra la direzione del trend a colpo d'occhio e ti dà un segnale chiaro di BUY o SELL quando il trend cambia. Trasforma il prezzo in un'unica onda fluida: ciano quando il trend è rialzista, corallo quando è ribassista. Vedi subito da quale lato del mercato dovresti stare, su qualsiasi simbolo e qualsiasi timeframe. AlphaWave è pensato per lo s

Know exactly who is strong and who is weak, before you place a single trade. User guide and articles Currency Strength Meter user manual How to pick the strongest vs weakest pair Using currency strength when trading gold Every forex pair is a tug of war between two currencies. Trade the wrong side of that fight and the best setup in the world will not save you. DuoFX Currency Strength Meter cuts through the noise: it scans all 28 major and cross pairs, crunches the strength of all eight majors (

SOHRABI FVG BTB BO MT4 Bring chart-timeframe and higher-timeframe price zones together in one view. SOHRABI FVG BTB BO MT4 automatically identifies and displays FVG, BTB and BO zones using defined candle-based rules. It helps you review historical formations, follow active zones and compare your current chart with a selected higher timeframe. Zone formation is confirmed using closed candles. After confirmation, price touches and full coverage update each zone’s displayed status. Three Zone Types

Currency Strength Meter per MetaTrader 4 combina le 28 coppie delle 8 valute principali (USD, EUR, JPY, GBP, AUD, NZD, CAD, CHF) in una linea di forza per ciascuna valuta, con una tabella di classifica per il timeframe del grafico, M15, H1, H4 e D1. La formula completa è pubblicata più sotto. È pensato per i trader MT4 che confrontano le valute prima di scegliere quale coppia osservare e che vogliono sapere esattamente come vengono ottenuti i numeri. È un supporto all'analisi: non indica quando

Trade History Stats Panel per MetaTrader 4 legge le operazioni chiuse nello storico del tuo conto e le riassume in un pannello sul grafico: numero di operazioni, percentuale di successo, profit factor, P/L medio per operazione, drawdown della curva delle operazioni chiuse, tempo di mantenimento, acquisti / vendite, e tabelle per mese, simbolo, giorno della settimana e ora. È pensato per i trader che vogliono riesaminare le proprie operazioni passate, come un diario di trading che si compila da

Prop Challenge Loss Tracker per MetaTrader 4 mostra, in un pannello sul grafico, quanto margine resta prima di raggiungere il limite di perdita giornaliera e il limite di perdita massima di una challenge per conto finanziato (prop), e invia alert progressivi man mano che i limiti vengono consumati. È pensato per i trader che affrontano una challenge prop e vogliono vedere a colpo d'occhio il margine di perdita rimanente, impostato secondo le regole del proprio programma. È solo uno strumento di

Market Structure Liquidity Map per MetaTrader 4 disegna sul grafico la struttura di mercato in stile smart money concepts (SMC): etichette degli swing, break of structure (BOS), change of character (CHoCH), massimi e minimi uguali, livelli del giorno e della settimana precedenti, liquidity sweep e fair value gap (FVG) non colmati, con una piccola tabella per il timeframe del grafico e due timeframe superiori. È pensato per i trader MT4 che leggono struttura e liquidità a mano e vogliono che gli

RSI, MACD or Stochastic divergence across 28 pairs, gold and up to 9 timeframes. One grid. No repainting. User guide and articles Divergence Scanner user manual Regular divergence for reversals Hidden divergence for trend continuation Divergence is one of the oldest warnings in trading: price makes a new high, momentum does not. But hunting for it means flicking through dozens of charts and squinting at an oscillator on each one, and by the time you find it, it is gone. DuoFX Divergence Scanner

Most arrow indicators give you one buy arrow. This one gives you two, and the difference matters. BUY+ means price crossed the trend band while already above the 200 EMA, so you're going with the bigger trend. Plain BUY is the same cross below it, so you're fighting it. Same for SELL and SELL+. On top of that there's a multi-timeframe dashboard and ten extra modules. They're all off when you load it. Turn on the two or three you actually use. I checked the maths with a separate Python version of

Ottieni TUTTI i miei strumenti per MT4 & MT5 GRATIS — Scopri come qui
Guida a più timeframe & simboli: Guida all'uso di Multi-Timeframe & Scanner - Disponibile in 12 lingue Vedi la versione MT5 qui: Zero Lag Trend Signals Multi TF Scanner per MT5 Vedi la versione MT4 qui: Zero Lag Trend Signals Multi TF Scanner per MT4 Vedi altri prodotti qui: Tutti i prodotti oppure Indicatori di trading, offerte speciali & novità I nuovi strumenti costano $30 durante la prima settimana oppu

Ottieni TUTTI i miei strumenti MT4 & MT5 GRATIS — Scopri come qui
Guida per più timeframe e simboli: Guida utente Multi-Timeframe & Scanner - Disponibile in 12 lingue Vedi la versione MT5: Trend Reversal Probability Multi TF Scanner per MT5 Vedi la versione MT4: Trend Reversal Probability Multi TF Scanner per MT4 Altri prodotti: Tutti i prodotti oppure Indicatori di trading, offerte speciali e novità I nuovi strumenti costeranno $30 durante la prima settimana oppure per i p

Ultra Confluence is a trend indicator for MetaTrader 4 built around a trailing stop that picks its own width. A normal SuperTrend uses one ATR multiplier forever. This one runs nine of them side by side (1.0 to 5.0 in steps of 0.5), keeps score of how each has been doing, sorts them into three groups with k-means clustering on every bar, and trails price with the average multiplier of the best group. Around it sit an ATR-based Ichimoku cloud, a liquidity and sentiment volume profile, volume-colo

Divergence Detector per MetaTrader 4 individua divergenze regolari e nascoste tra gli swing del prezzo e un oscillatore a tua scelta (RSI, istogramma MACD, Stochastic %K, OBV, CCI o Momentum) e le disegna sul grafico del prezzo e nella finestra dell'indicatore, con una piccola tabella per altri quattro timeframe. È pensato per i trader MT4 che cercano le divergenze a occhio e vogliono che vengano individuate con regole fisse e visibili sulle barre chiuse. È solo uno strumento di visualizzazione
MetaTrader Market - i robot di trading e gli indicatori tecnici per trader sono disponibili nel tuo terminale di trading.
Il sistema di pagamento MQL5.community è disponibile per tutti gli utenti registrati sul sito MQL5.com che effettuano transazioni su MetaTrader Services. Puoi depositare e prelevare denaro usando WebMoney, PayPal o una carta di credito.

Ti stai perdendo delle opportunità di trading:
- App di trading gratuite
- Oltre 8.000 segnali per il copy trading
- Notizie economiche per esplorare i mercati finanziari
Registrazione
Accedi
Accetti la politica del sito e le condizioni d’uso
Se non hai un account, registrati