Rumer Magic Lines MT4
- Indicatori
- Versione: 1.0
- Attivazioni: 5

Rumer Magic Lines - Previous Day High Low, Swing Levels, Session Opening Candles and Smart Arrows for MT5
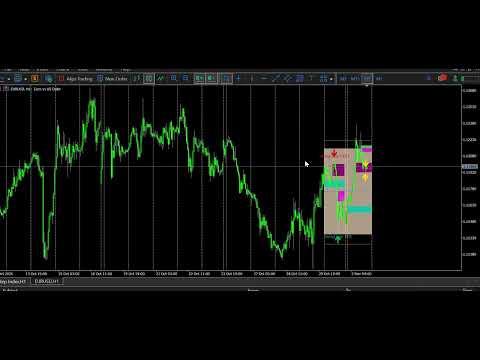
Rumer Magic Lines is an automatic support and resistance indicator for MetaTrader 5. It draws the previous day high and low, the previous day midline, the true swing high and swing low, and the first M15 candle of the Asia, London and New York sessions on your chart, then tracks a three-stage price action setup at those levels and shows it with colour-coded arrows, stop and target lines and alerts.
Open any chart, attach the indicator, and the map is ready. No scrolling back through history. No hand-drawn lines. No wondering whether you marked the right candle.
WHAT YOU SEE ON YOUR CHART
1. The four magic lines. The previous day high, the previous day low, the swing high above the range and the swing low below it, drawn as clean horizontal rays. They refresh by themselves at the start of every trading day and start at yesterday's open, so you can see which day each level came from.
2. The daily range box and midline. The space between yesterday's high and low is shaded as one transparent zone, with a separate midline for bias. Above the middle, buyers have the upper hand. Below it, sellers do. The fill transparency is adjustable, so the box never hides your candles.
3. The first M15 candle of every session. Asia, London and New York opening range boxes are drawn around the first 15 minute candle of each session and extended across the day. You see at a glance where each session began, and how price behaves around those session highs and lows. Session open hours are set in your broker's server time, so it fits any broker.
4. Three-stage arrows. When price reacts at a level, the first arrow appears. When the next candle confirms, the second arrow appears. When the setup completes, the third arrow marks it and the stop loss and take profit lines are drawn for you. Hammer, shooting star and engulfing candles get their own colours, so you can tell which kind of confirmation you are looking at without reading a single number.
5. Outsized candle highlights. Any M15 candle that uses up a large share of the daily ATR is boxed in gold and labelled with its percentage, green for bullish and red for bearish. Quiet chop and real momentum look different the moment the candle closes.
6. Alerts at every stage. Popup alerts on your screen and push notifications to your phone, with a separate switch for each stage, so you can step away from the chart and come back when it matters.
WHY TRADERS USE RUMER MAGIC LINES
- Save time every day. The levels you used to draw before the session are on the chart before you sit down.
- Same map on every chart. Forex pairs, gold, silver, indices, crypto CFDs and synthetic indices all get the same layout, so your routine does not change with the symbol.
- See the whole day in one picture. Previous day range, swing levels and three session opens together show where price has been and where it is likely to be watched by other traders.
- Less screen time. Alerts do the watching, and you act only when a setup reaches a stage you care about.
- Fully adjustable. Every line, box, colour, width and alert can be switched on or off, so the chart shows only what you use.
- Light and clean. Everything is a standard chart object. It stays in place when you scroll, zoom or change timeframe, and there are no external files, no DLLs and no account or symbol lock.
WHO IS IT FOR
Day traders and scalpers who plan around previous day high and low. Session traders who follow the Asia, London and New York opening range. Price action traders who read hammer and engulfing candles. Swing and intraday traders who want swing high and swing low levels marked on the chart. Anyone who trades more than one symbol and wants consistent levels everywhere.
HOW TO USE
1. Attach Rumer Magic Lines to any chart. The pattern arrows read the M15 timeframe, and the lines and boxes show on any timeframe.
2. Set the Asia, London and New York open hours to your broker's server time (defaults 0, 8 and 13).
3. Choose which items to show: range box, midline, swing lines, session boxes, candle highlights.
4. Turn on the alerts you want: popup, push, or both.
5. Trade your own plan. Use the lines and arrows as reference points together with your own analysis and risk management.
IMPORTANT
Rumer Magic Lines is a charting and pattern-marking tool. It does not open or close trades. Markers and alerts show where a pattern formed on past and current candles. They are not a prediction and not financial advice. Trading leveraged products carries a high risk of loss. Test on a demo account first.