Double top bottom scanner with RSI filter
- Indicateurs
- Jan Flodin
- Version: 2.9
- Mise à jour: 8 décembre 2023
- Activations: 10
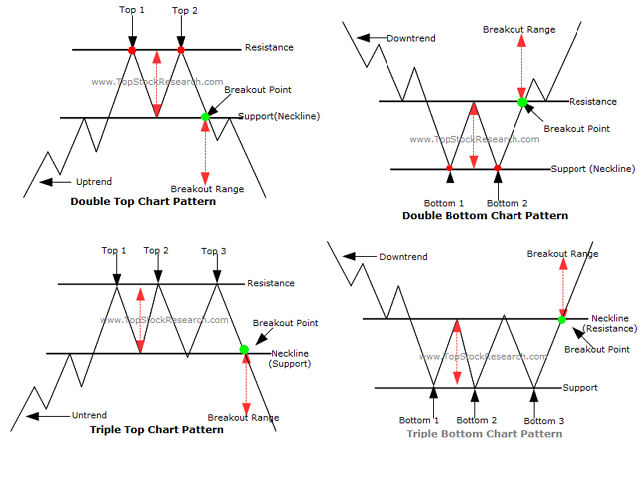
Cet indicateur à plusieurs périodes et à plusieurs symboles identifie les formations haut/bas doubles ou triples ou une cassure de décolleté suivante (haut/bas confirmé). Il offre des filtres RSI, pin bar, engloutissant, pince à épiler, étoile du matin/soir ainsi que des options de filtre de divergence MACD, Awesome (AO) ou RSI qui permettent de filtrer uniquement les configurations les plus fortes. L'indicateur peut également être utilisé en mode graphique unique. Veuillez en savoir plus sur cette option dans le produit blogue. Combiné à vos propres règles et techniques, cet indicateur vous permettra de créer (ou d'améliorer) votre propre système puissant.
Caractéristiques
- Peut surveiller tous les symboles visibles dans votre fenêtre Market Watch en même temps. Appliquez l'indicateur à un seul graphique et surveillez instantanément l'ensemble du marché.
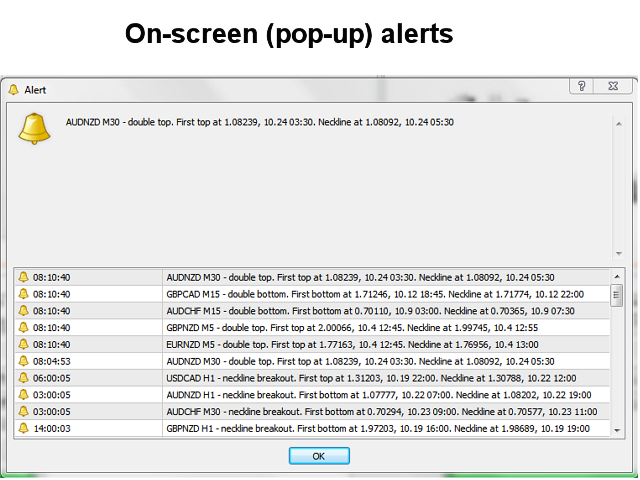
- Peut surveiller chaque période, de M1 à MN, et vous envoie une alerte en temps réel lorsque le deuxième ou le troisième haut/bas est identifié ou lors de la rupture de l'encolure. Tous les types d'alertes natives de Metatrader sont pris en charge.
- Peut utiliser RSI, une sélection de différents modèles de bougies et divergences pour identifier correctement les renversements potentiels.
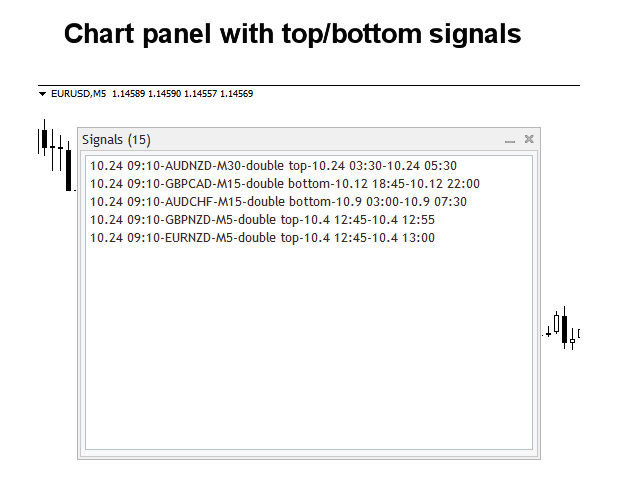
- L'indicateur comprend un panneau interactif. Lorsque vous cliquez sur un élément, un nouveau graphique s'ouvrira avec le symbole et la période en question.
- L'indicateur écrit les signaux dans un fichier texte qui peut également être utilisé par un Expert Advisor (EA) pour le trading automatique. Par exemple ce produit.
Paramètres d'entrée
La description et l'explication des paramètres d'entrée peuvent être trouvées ici.
Important
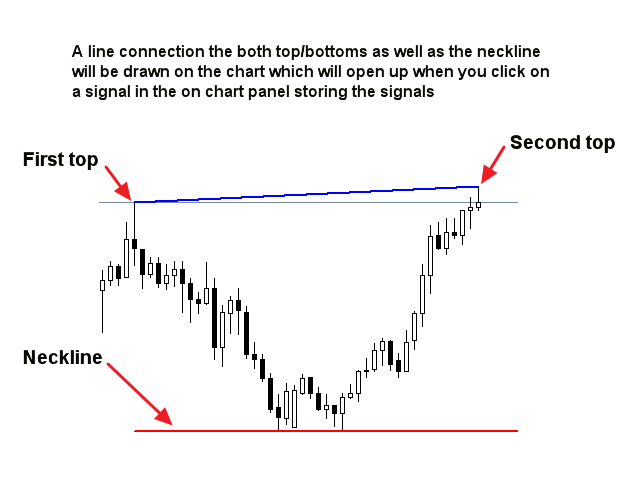
Veuillez noter qu'en raison de la multifonctionnalité, ni les conseils d'achat et de vente ni les lignes et les flèches ne seront tracés sur le graphique où l'indicateur a été installé. Une ligne entre les extremums ainsi que l'encolure sera tracée sur le graphique qui peut être ouvert à partir du panneau.
Il est fortement conseillé de placer l'indicateur sur un graphique propre (vide) sans aucun autre indicateur ou conseiller expert dessus qui pourrait interférer avec le scanner.


It's not just a simple scanner for DB & DT. It has the ability to notify early, allowing for processing time. It becomes very powerful when you apply the provided filters. On this note, I would like some confirmed settings... The fact that the signals are recorded and remain in the MT4 window is a fantastic idea. The way the indicator operates is close to the trader and deviates from the mindset of simple programming. Kudos to the creator. Excellent work!!! The best in its category. I will also purchase the scanner for S&R. It saves me from tasks I've been doing for years on my charts.