Suvashish Halder
Suvashish Halder
4.7 (171)
  • Informations
3 années
expérience
87
produits
41
versions de démo
0
offres d’emploi
0
signaux
0
les abonnés
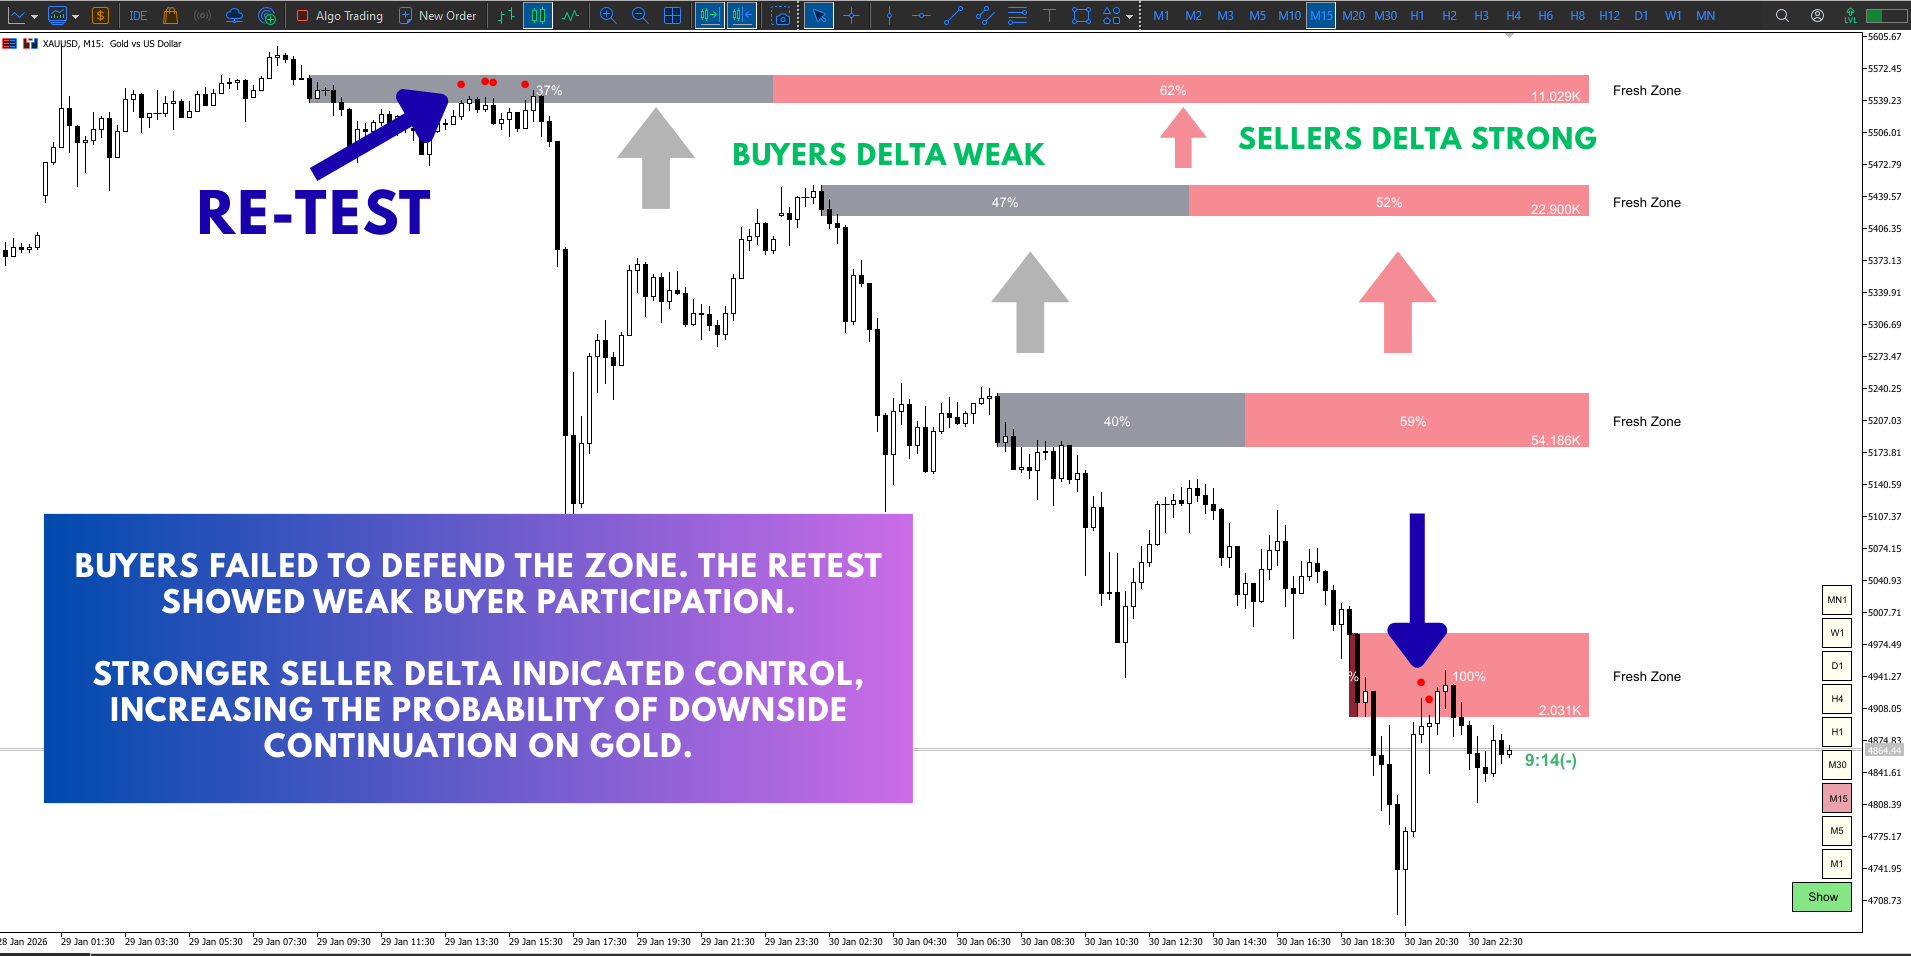
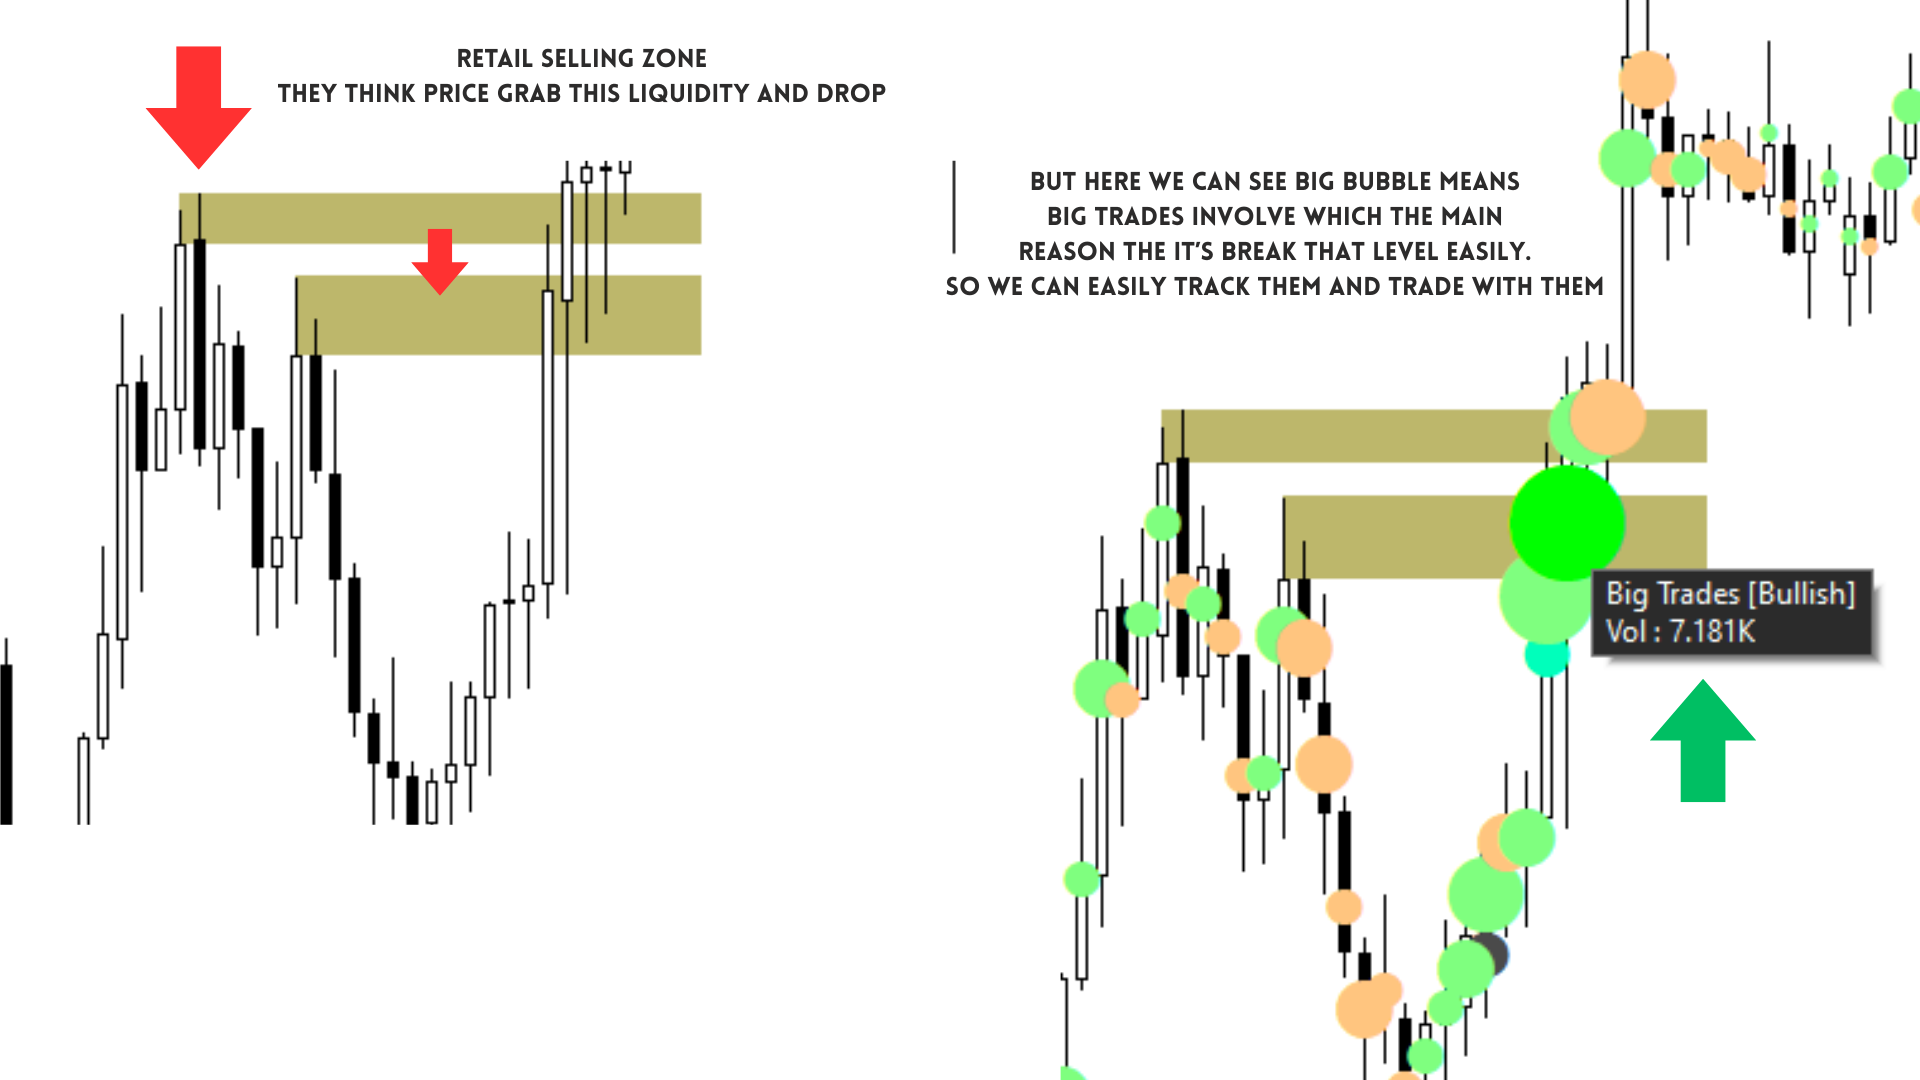
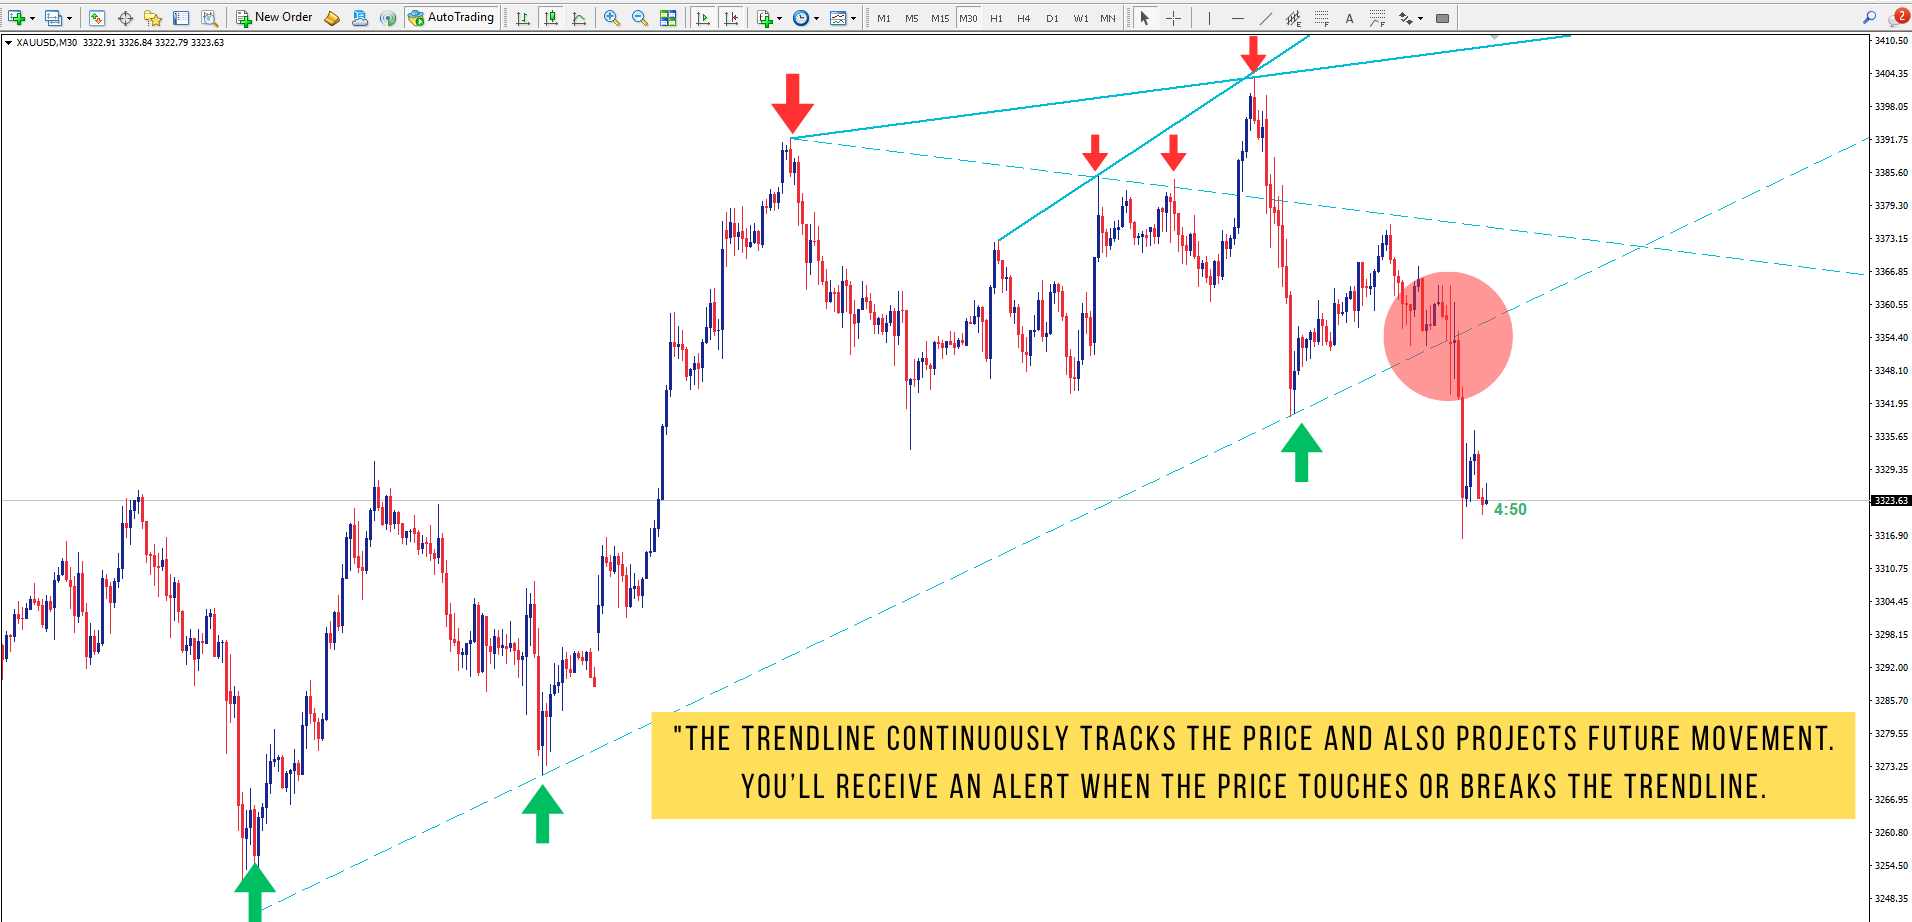
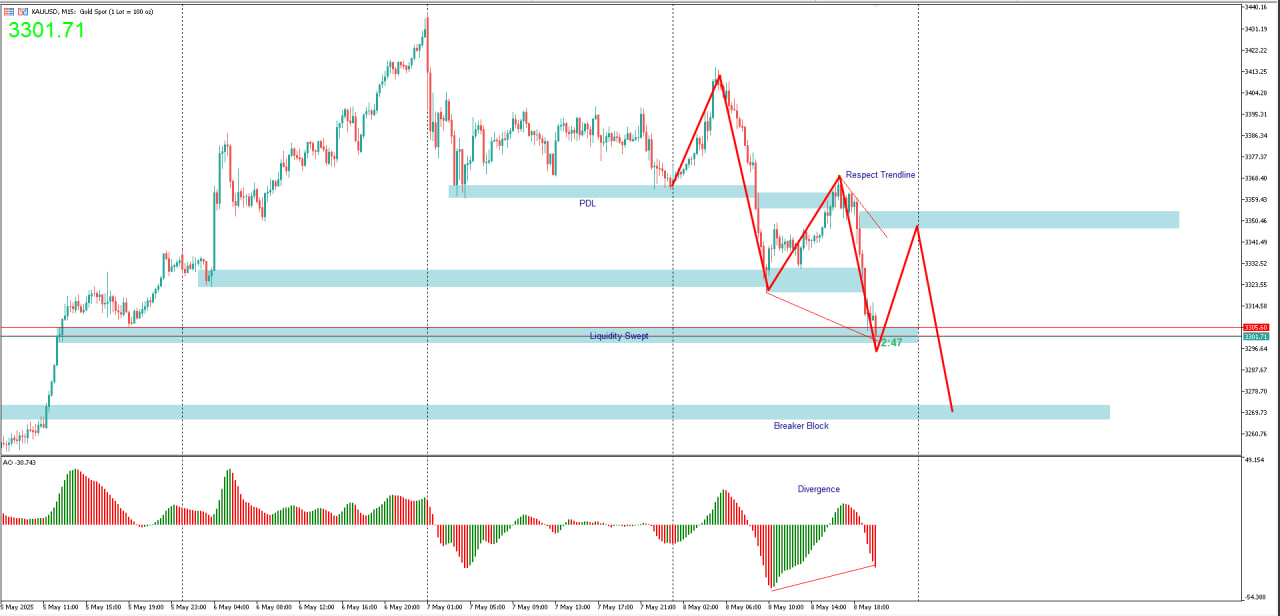
💧 PRO TIP - Don't Open Orders Where You See, Open Them Where Others Can't!

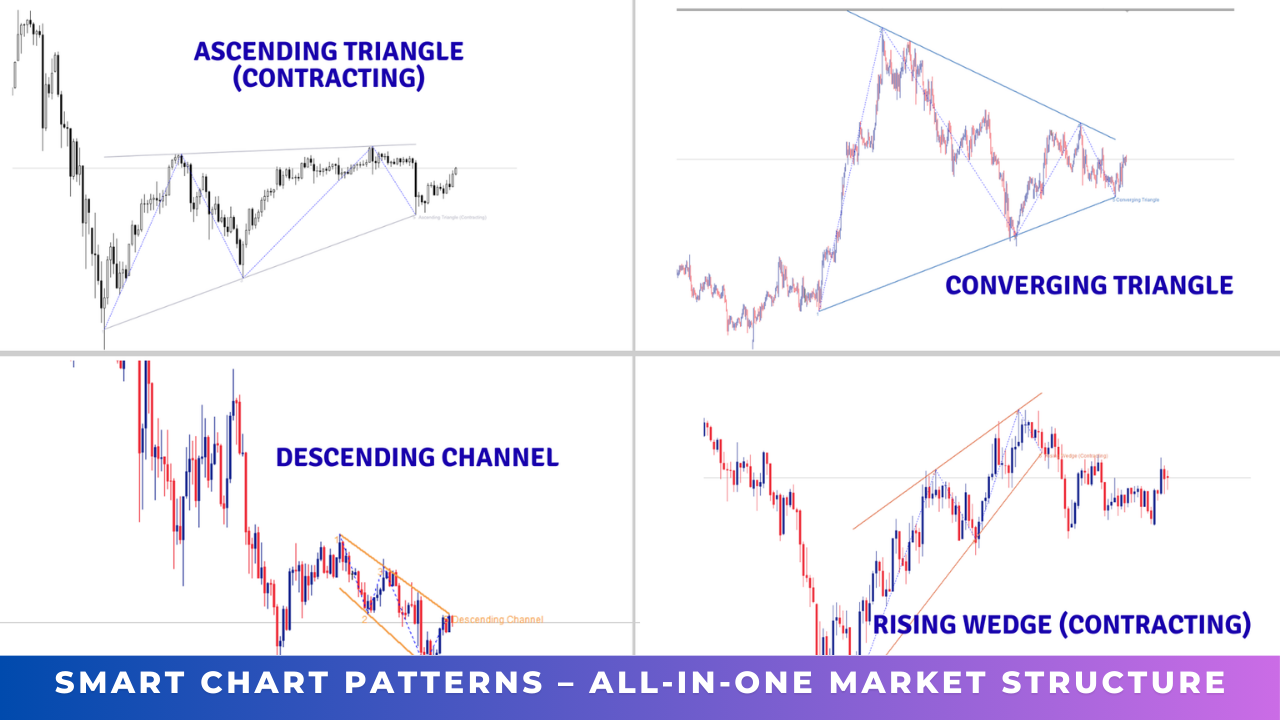
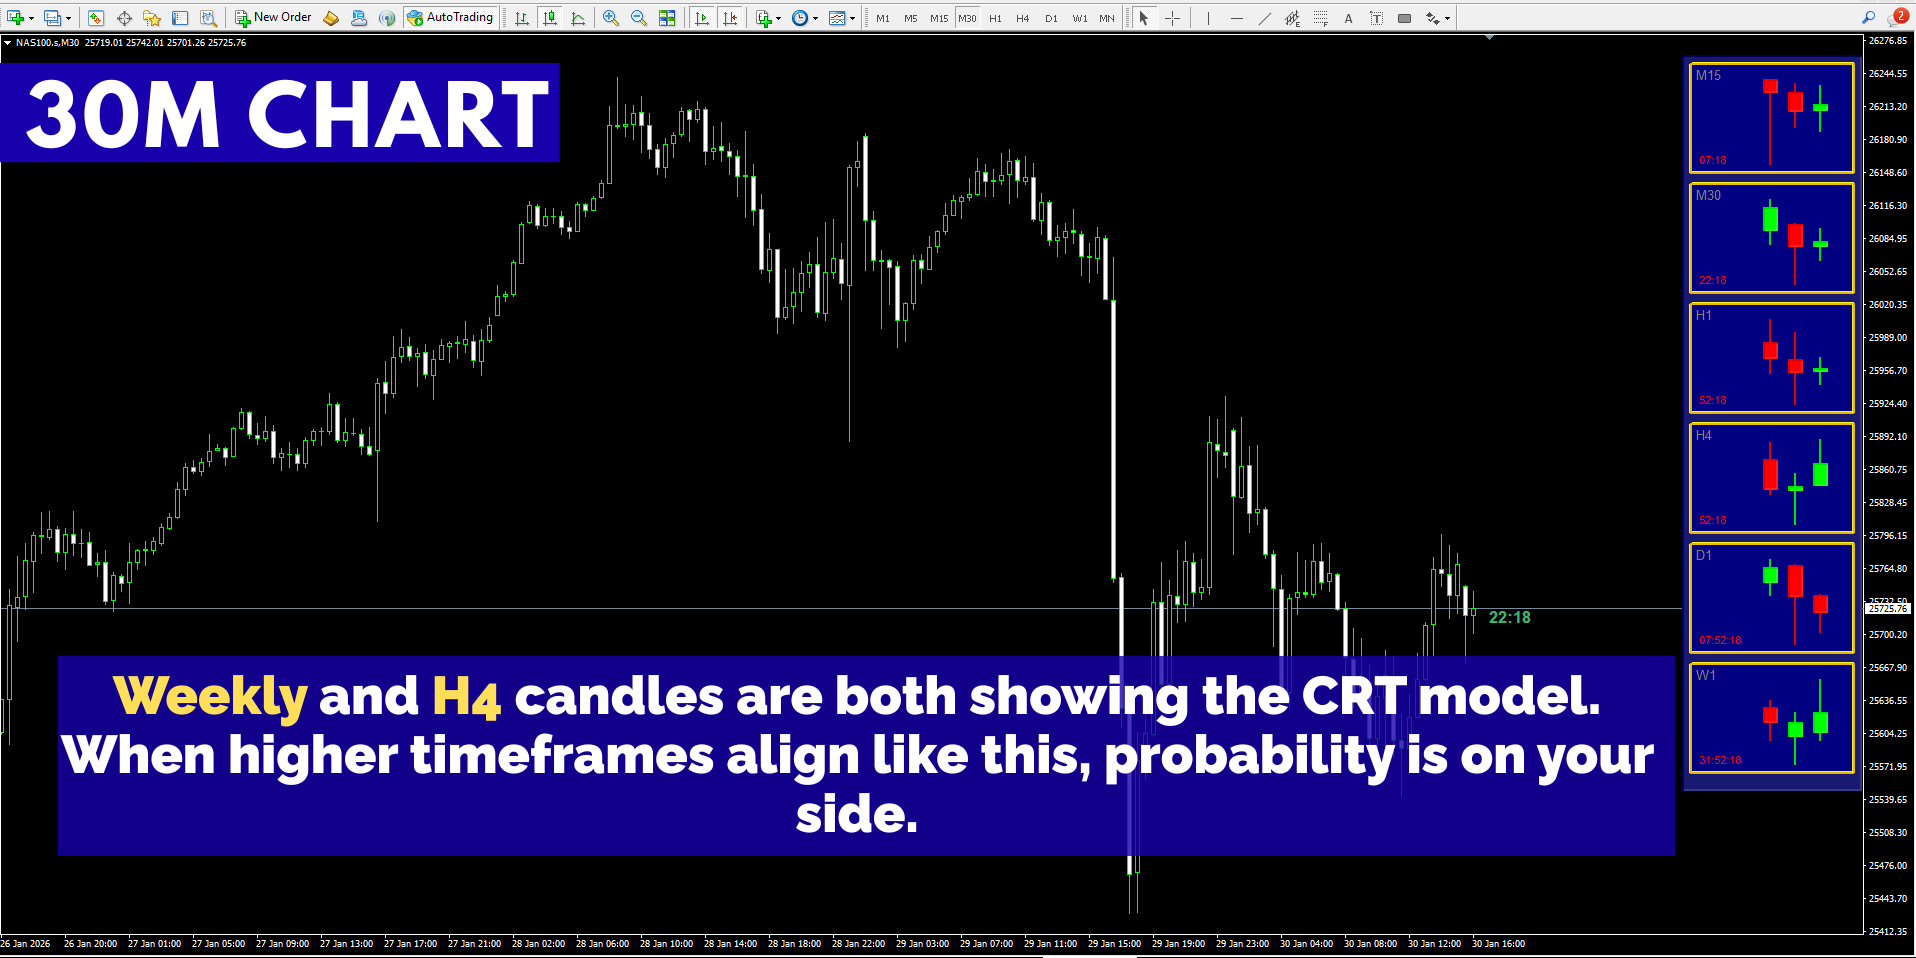
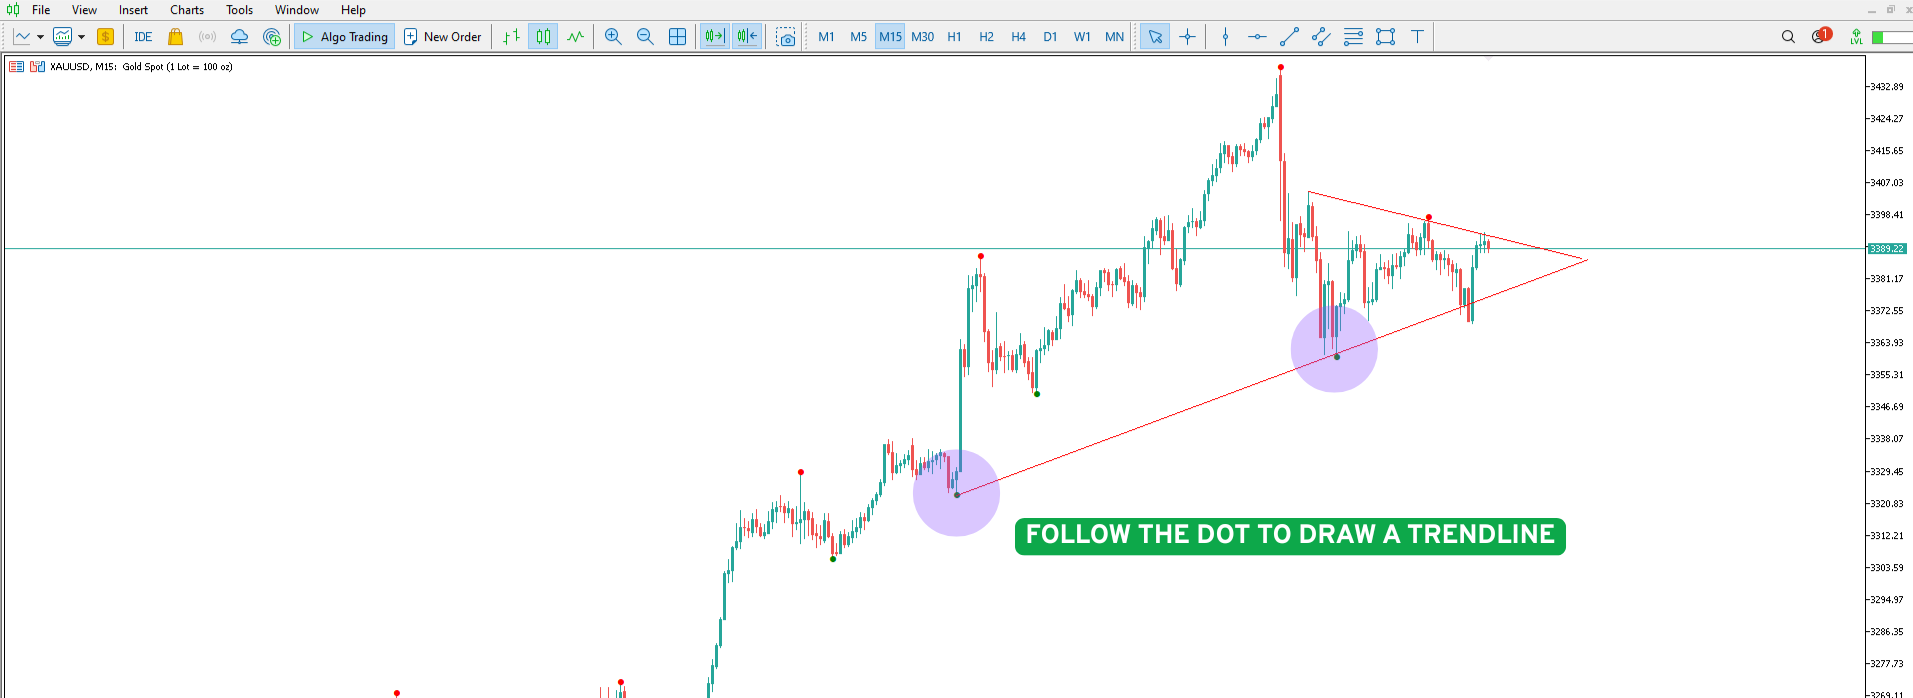
📈 Decoding Market Phases Like Never Before – The SuvashishFx Revolution!

🛑 Join To Learn Market Depth - https://www.mql5.com/en/channels/suvashishfx

👋 Hello, I'm Suvashish Halder – a Chart Analyst, Trader, and Data Expert 📊, dedicated to transforming market insights into profitable strategies.

Trading is a journey of continuous learning, where every day brings new discoveries. Patience, discipline, and risk management are the key pillars of success in this ever-evolving landscape.

Beyond trading, I develop innovative tools designed to enhance traders' experiences. While some tools may be game-changers, others may not fit every strategy—but the goal is to explore, learn, and grow together.

Wishing you all the best on your trading journey. Happy trading, and thank you! 🙏
Suvashish Halder
Suvashish Halder
📌 Another day, another opportunity — not just for trading, but for understanding the market. Use volume footprint analysis to know when it’s time to buy or sell.
✅ MT4 - https://www.mql5.com/en/market/product/138564/
✅ MT5 - https://www.mql5.com/en/market/product/138565/
Suvashish Halder
Suvashish Halder
📌 Volume with Supply and Demand is a powerful combination — but does it win every time? Absolutely not. That’s exactly why we use a stop-loss: to protect our capital when the market proves us wrong.
Suvashish Halder
Suvashish Halder
📊 Gold - When you trade with volume, results often speak for themselves — clean, confident setups. But remember, no strategy wins 100% of the time. Losses are part of the game. Stay disciplined, stay focused 💹
Suvashish Halder
Suvashish Halder
📉 XAUUSD (Gold) Technical Analysis – 15-Minute Chart
🗓️ Date: May 8, 2025
🔎 Structure Break, Trendline Respect, Bearish Continuation Setup

🔹 Market Structure Overview
The chart shows a clear shift to bearish market structure, with consistent lower highs and lower lows.

Price has decisively broken below the Previous Day Low (PDL), signaling strong bearish momentum rather than just a liquidity sweep.

The bearish move respected the descending trendline, confirming sellers are still in control.

🧊 Key Price Zones
PDL Break: The break of the previous day low confirms strength to the downside. This level may now act as resistance.

Breaker Block: Price temporarily reacted here and formed a small bullish correction, but overall trend remains bearish.

Supply Zone (Resistance): The zone around 3350–3360 could cap any bullish pullback and act as the next area of interest for short entries.

🔺 Awesome Oscillator (AO) Observation
A bullish divergence is visible on the AO: while price made a lower low, the oscillator made a higher low.

This suggests a potential short-term retracement, not necessarily a reversal of the main trend.

🔀 Projected Price Movement (Marked in Red)
A minor retracement toward the supply zone is expected.

If price respects this resistance area and fails to break higher, we could see a continuation move down, possibly targeting the next demand zone near 3270–3260.

✅ Bearish Bias Confluences
Break of structure and PDL confirms bearish trend.

Respect of descending trendline adds strength to the bearish outlook.

AO divergence aligns with a retracement setup before further decline.

📌 Conclusion: Gold remains bearish after breaking key support at the Previous Day Low. Watch for a corrective move into resistance before continuation lower. Stay patient and wait for bearish confirmation at key levels.
Suvashish Halder
Suvashish Halder
🚀 New Tool Alert: Swing High Low Indicator (FREE) 📉📈

✅ MT5 Version - https://www.mql5.com/en/market/product/138184/
✅ MT4 Version - https://www.mql5.com/en/market/product/138187/

Easily spot market reversals and direction with precision!

🔺 Red arrow = Swing High
🔻 Green arrow = Swing Low
📊 Clean chart waves highlight compression zones before breakouts
📈 Connect the dots to draw trendlines and reveal the market’s moving direction

Perfect for traders who want to stay ahead by reading structure, not noise.
Suvashish Halder
Suvashish Halder
🤔 Have you ever asked yourself why your supply and demand zones fail, even when everything looks “perfect”? The truth is, you're not wrong — you're just watching the reaction, not the reason.
✅ MT4 Version - https://www.mql5.com/en/market/product/138041/
✅ MT5 Version - https://www.mql5.com/en/market/product/136117/
Suvashish Halder
Suvashish Halder
Step 1 ✅ Passed — Let’s go!
Trade with confidence, not guesses.
Manage your risk — it could be a game changer.
Good luck, everyone! 🚀📈💪
Suvashish Halder
Suvashish Halder
📍 Welcome to Volumatic Trend (COMPLETELY FREE)
📈 Trend Following with Volume Logic
🔔 Smart Alerts for Trend Shifting
⏱️ Multi-Timeframe Analysis (MTF)
✅ MT4 - https://www.mql5.com/en/market/product/136210/
✅ MT5 - https://www.mql5.com/en/market/product/136211/
Suvashish Halder
Suvashish Halder
🚀 NEW RELEASE: Level Box Tool - Completely FREE!!!

✅ I’ve just published the Level Box Tool — a clean, powerful utility for technical traders who use rectangles, levels, and trendlines in their strategy.
✅ MT4 Version - https://www.mql5.com/en/market/product/136009/
✅ MT5 Version - https://www.mql5.com/en/market/product/136010/
Suvashish Halder
Suvashish Halder
🚨 Gold rejected perfectly from the 8/8 "Maximum Resistance" level at 3125.00!
Before you hit buy, think twice — this level is no joke. It often acts as a strong reversal zone. Watch for signs of weakness or confirmation before jumping in.

📉 Buy smart, not blindly.
👉 Available for MT4 and MT5
✅ MT4 - https://www.mql5.com/en/market/product/132809/
✅ MT5 - https://www.mql5.com/en/market/product/132810/
Suvashish Halder
Suvashish Halder
🧠 Patience: the most underrated trading strategy.
Suvashish Halder
Suvashish Halder
📈 Details Posted on Channel
🛑 Join To Learn Market Depth - https://www.mql5.com/en/channels/suvashishfx
Suvashish Halder
Suvashish Halder
Two days ago, I shared a setup on AUDJPY using the 5-minute timeframe—here’s how it played out 😄
Suvashish Halder
Suvashish Halder
🛑 Join To Learn Market Depth - https://www.mql5.com/en/channels/suvashishfx

Let's Learn Today! 📚

I've opened a new position 📈, and you might be wondering why 🤔. Let me break it down simply:

First, I checked the Higher Timeframe. I noticed the price performed a Liquidity Sweep 💦—basically, it cleared out previous liquidity—and then entered a Supply Zone. This gave me an important hint that sellers 🐻 might step in here.

Next, I switched to a Lower Timeframe [5M] to hunt for my entry confirmation. What did I find? Price broke through an early Demand Zone, but then struggled to retest that same zone. Instead, it created a Fair Value Gap (FVG) 🔥—another strong confirmation signal.

And guess what else I noticed on the left side of the chart? A clear Head and Shoulders pattern 👤 was forming. Seeing all these confirmations together—Liquidity Sweep, Supply Zone entry, FVG formation, and a Head and Shoulders pattern—gave me confidence 💪 to take this trade.

That's why I jumped in 🚀. Easy, right? 😄
Suvashish Halder
Suvashish Halder 2025.03.20
The risk-reward ratio was 1:5, meaning I aimed for 200 pips. Right now, it's up 170 pips in profit. Check my recent post for details!
Suvashish Halder
Suvashish Halder
🚀 Let's go short! The price has already touched the previous supply zone and dropped 📉. On the next touch, it aggressively rejected downward again 🔻. This confirms our short setup, targeting the next liquidity level 🎯. We'll look to buy at the demand area after a liquidity sweep 💰. As always, manage risk and protect your account 🛡️. Good luck! 🍀
Suvashish Halder
Suvashish Halder
📌 TP HIT - CHECK PREVIOUS POST