Stop Survival Sizer
- Indicateurs
- Version: 1.0
- Activations: 5

Stop Survival Sizer answers one practical question before you enter a trade: how wide must my stop be so that, on this symbol and timeframe, normal noise would have hit it no more often than I accept? And how many lots does that stop allow for my risk?
Instead of a fixed "2 x ATR" rule, it measures. For each of the last N bars (500 by default) it treats the bar close as a hypothetical long entry and a hypothetical short entry. It records how far price moved against each entry during the next H bars (10 by default), in units of that bar's ATR. From this distribution it picks the smallest stop multiple that would have been hit no more often than your target (20 % by default). It does this separately for longs and shorts. Rising and falling markets often have quite different adverse moves.
What you see on the chart
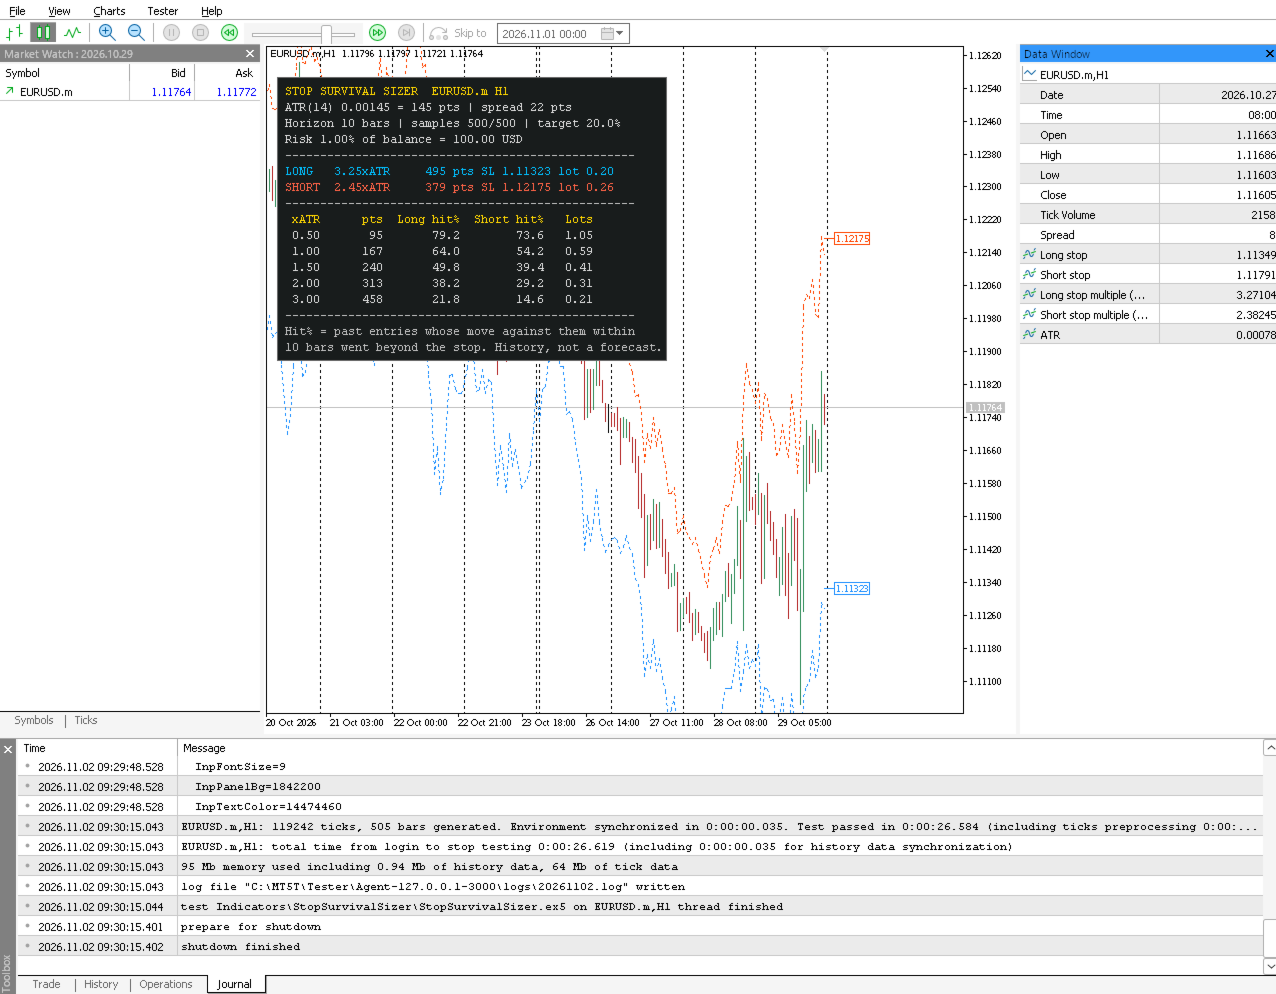
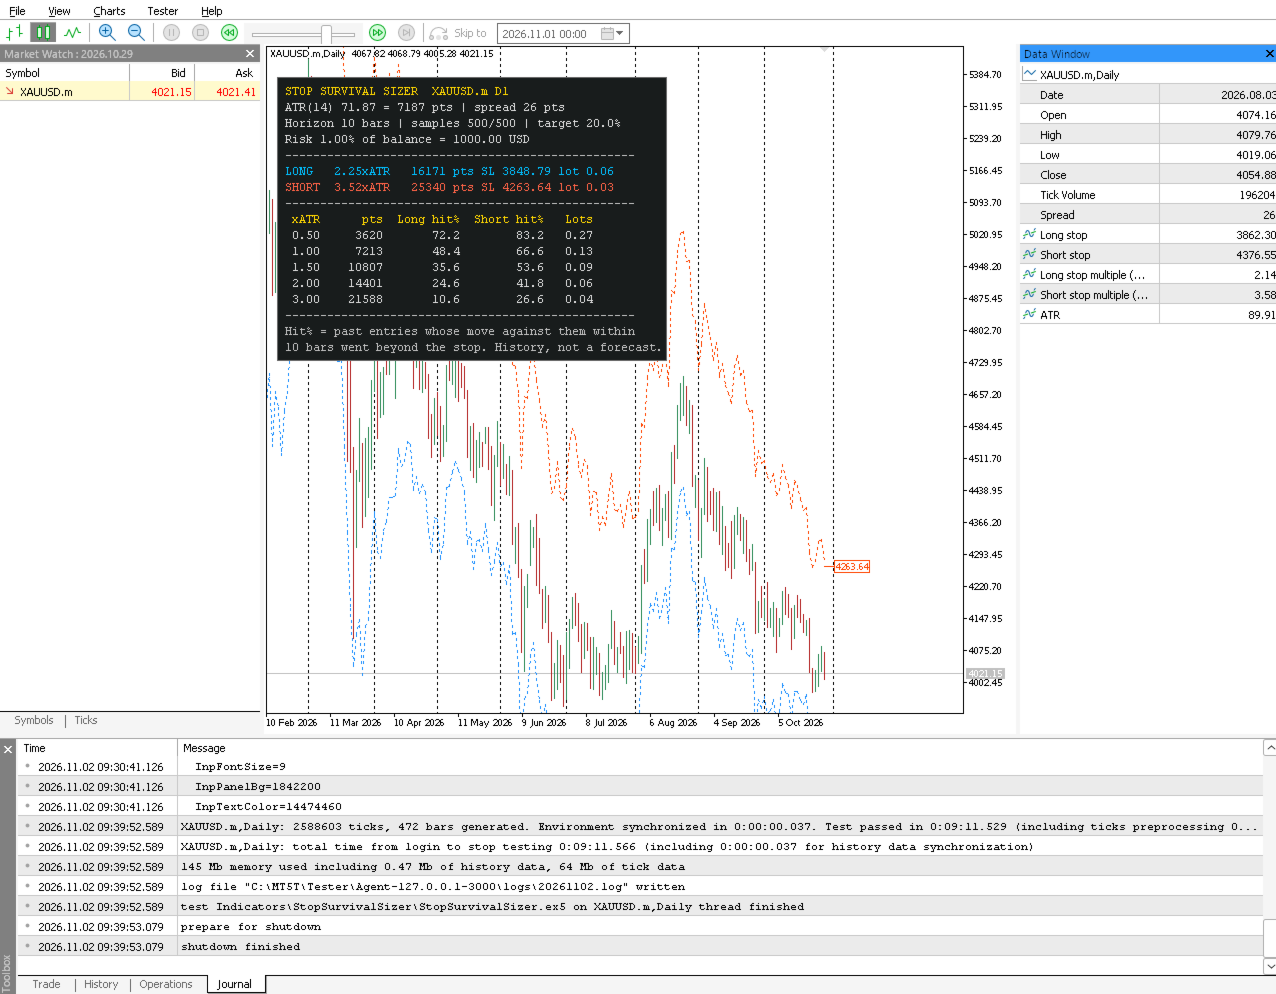
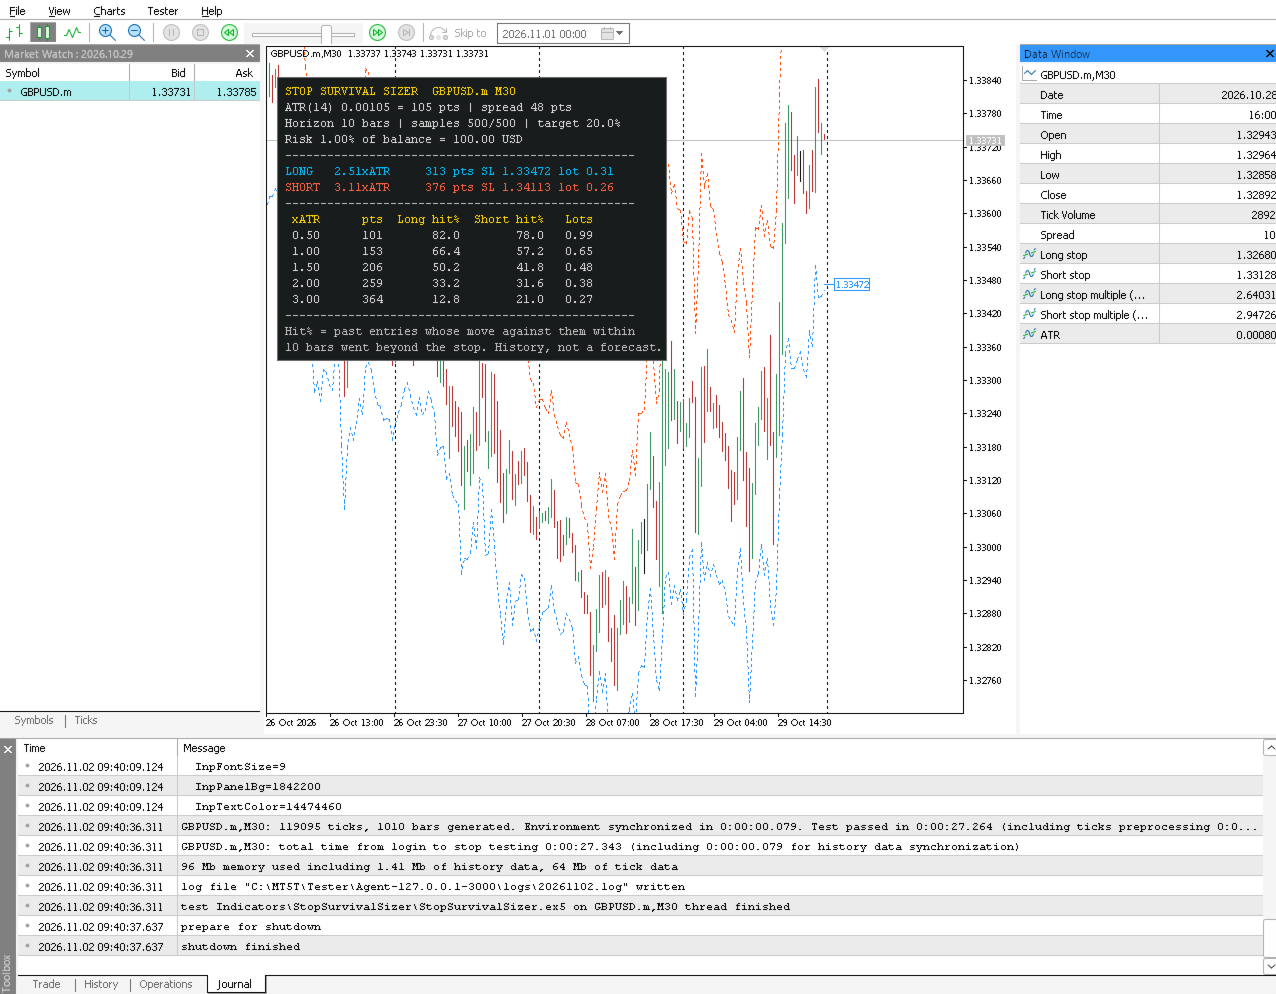
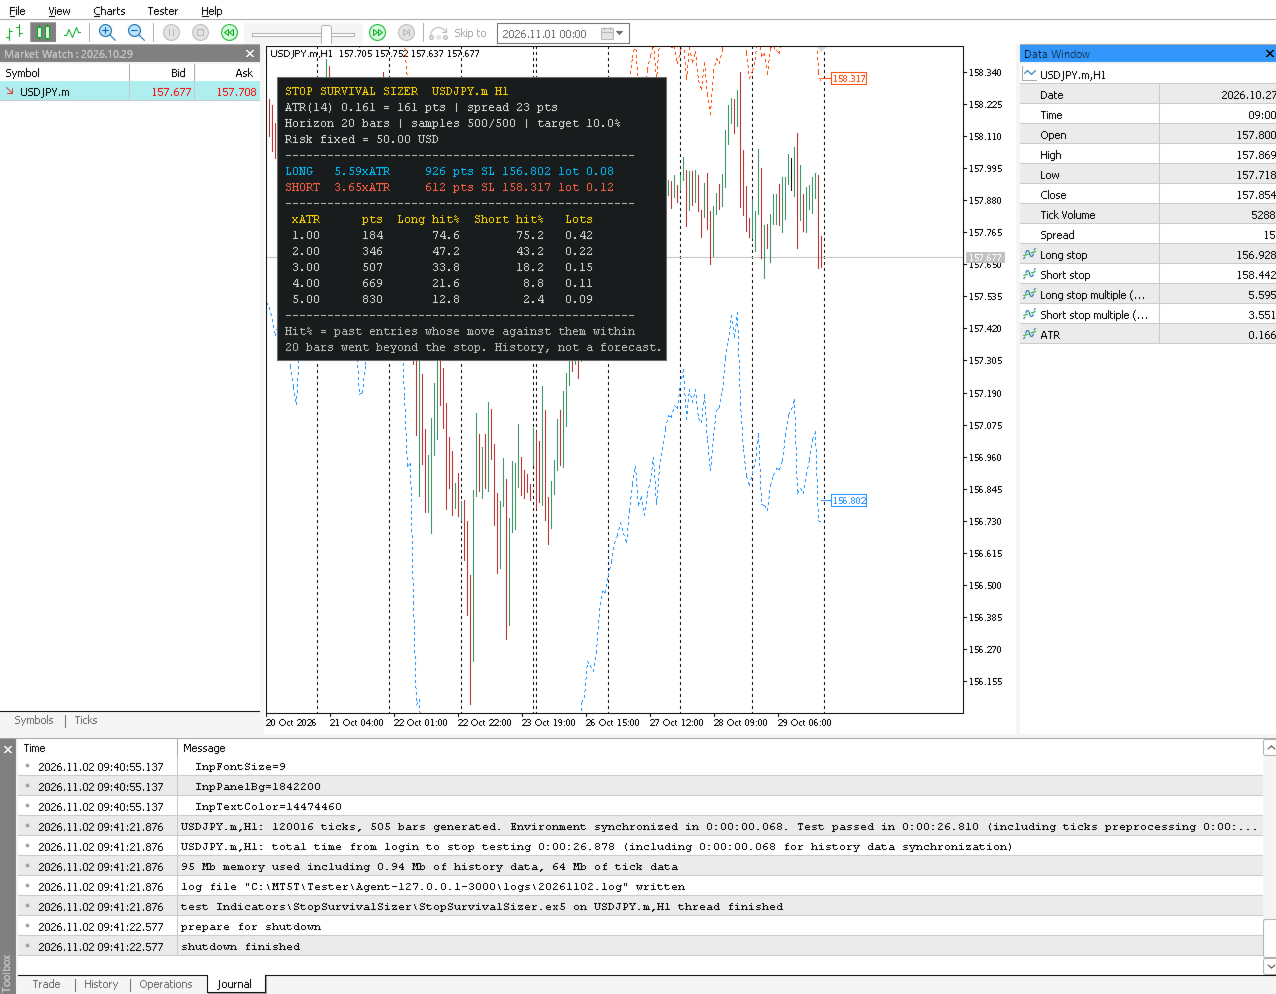
- Long stop line (blue, dotted): bar close minus the recommended long multiple x ATR.
- Short stop line (orange-red, dotted): bar close plus the recommended short multiple x ATR.
- Price labels at the last bar with the current long and short stop prices.
- Panel:
- the recommended long and short stop in ATR multiples and in points, with stop prices from the current ask/bid and the lot size for your risk;
- a table of 5 stop sizes you choose (0.5 / 1 / 1.5 / 2 / 3 x ATR by default) with the historical long and short hit rates, distance in points and lot size;
- ATR, spread, horizon, number of valid samples and the risk amount.
Features
- Empirical stop multiples for longs and shorts, recalculated once per bar.
- Lot size from percent of balance, percent of equity or a fixed amount of money. Uses the terminal's OrderCalcProfit (tick-value fallback), so it handles forex, metals, indices and cross-currency accounts. Lots are rounded DOWN to the broker's lot step and capped at the maximum. If even the minimum lot would risk more than you allow, the panel shows "<min" instead of rounding up.
- Optional: add the current spread to the stop distance.
- Hit-rate table for 5 user-defined stop sizes.
- Closed bars do not repaint. A bar's multiples use only samples whose whole holding horizon closed before that bar opened, and they are fixed when the bar opens.
- 5 buffers for Expert Advisors (iCustom). All inputs are plain numbers, switches or colours, in a fixed order.
- Efficient: after the first pass, only new samples and new bars are calculated. The number of bars calculated is limited (5000 by default).
- No DLLs, no external files, no web requests. It never opens, changes or closes trades.
Inputs (in iCustom order)
1. ATR period (Wilder), default 14
2. Holding horizon, bars after entry, default 10
3. Past entries sampled (one per bar), 30..20000, default 500
4. Target stop-hit rate %, 1..99, default 20
5. Risk base: 0 = percent of balance, 1 = percent of equity, 2 = fixed money; default 0
6. Risk per trade % (balance/equity modes), default 1.0
7. Risk per trade money (fixed mode), default 100
8. Add current spread to stop distance, default true
9-13. Table rows 1-5: stop x ATR, defaults 0.5, 1.0, 1.5, 2.0, 3.0 (0.05..50)
14. Bars to calculate (most recent), 100..1000000, default 5000
15. Show panel, default true
16. Show stop price labels at the last bar, default true
17. Panel X offset (px), default 10
18. Panel Y offset (px), default 30
19. Panel font size, 6..24, default 9
20. Panel background colour
21. Panel text colour
Invalid inputs are refused at start with a clear message in the Experts log.
Buffers for iCustom (read closed bars at shift 1 or more)
0 - Long stop price (close - long multiple x ATR)
1 - Short stop price (close + short multiple x ATR)
2 - Long stop multiple (x ATR)
3 - Short stop multiple (x ATR)
4 - ATR (Wilder)
EMPTY_VALUE means "no recommendation yet" (fewer than 30 valid samples, or the bar is outside the calculated range).
Example: iCustom(_Symbol,_Period,"Market\\Stop Survival Sizer",14,10,500,20.0) - the remaining inputs keep their defaults.
How to use it
- Choose a horizon that matches how long you usually hold a trade (in bars), and a hit-rate target you can live with.
- Before entering, read the recommended stop and lot for your direction. Alternatively, check how often your planned stop size would have been hit, using the table.
- A tighter stop allows more lots but is hit more often. The table shows the trade-off in numbers.
Limitations (please read)
- Hit rates are historical frequencies, not forecasts or probabilities of your next trade. Market behaviour changes, and a stop that survived 80 % of past samples can be hit on the next trade.
- The samples are hypothetical entries at every bar close, not your entry signals. If your entries are selective (breakouts, pullbacks), their adverse moves can differ.
- Only the adverse move within the horizon is measured. Take-profits, trailing stops, exits before the horizon and the order of highs/lows inside a bar are not modelled.
- Bar highs and lows are from the chart's (bid) prices. The spread is added only as the current spread (optional). Slippage, gaps over weekends/news, commission and swap are not included in the lot size.
- The stop lines on the forming bar move with its close (the multiple itself is fixed for the bar). Closed-bar values do not change.
- At least 30 valid samples are needed before anything is shown (about 55 bars with the default inputs); the full 500-sample window needs about 525 bars. Until then the panel says "Collecting samples".
- Lot sizes use the current account balance/equity and the symbol's contract settings. In the Strategy Tester, they use the tester deposit.
- This is an analysis tool. It does not trade and does not promise profit.
Testing performed (version 1.00)
- Compiles with 0 errors and 0 warnings (MetaEditor build 6292).
- 14 unit tests of the calculation core passed (ATR vs brute force, incremental ATR, adverse excursion vs brute force, quantile minimality on 400 random cases, lot rounding).
- Run directly in the Strategy Tester on EURUSD (M1, H1), GBPUSD (M30), XAUUSD (D1) and USDJPY (H1), every tick and real ticks, deposits of 1, 500 and 10000 USD, all three risk modes, large sample/horizon settings: no errors in the journal. Invalid inputs were refused cleanly.
- Repaint check over 6 runs (53,154 closed bars): bar-by-bar values were identical to those of the same instance and a fresh instance at the end of the test (0 mismatches). 503 independent recalculations from raw prices also matched (0 mismatches).
- Screenshots are from the MetaTrader 5 visual Strategy Tester. Not yet run on a live chart over time.