 MetaTrader 5
 Experts
 Indicateurs
 Bibliothèque
 Utilitaires
 Widgets
 Règles
Regardez les tutoriels vidéo de Market sur YouTube
Comment acheter un robot de trading ou un indicateur
Exécutez votre EA sur
hébergement virtuel
hébergement virtuel
Test un indicateur/robot de trading avant d'acheter
Vous voulez gagner de l'argent sur Market ?
Comment présenter un produit pour qu'il se vende bien
Indicateurs techniques pour MetaTrader 5 - 208
 Les signaux provenant des indicateurs techniques jouent un rôle crucial dans l'ouverture et la clôture des transactions sur les marchés boursiers et les marchés forex. L'essence des indicateurs est une transformation mathématique du prix d'un symbole financier visant à prévoir les changements de prix futurs. Testez les indicateurs techniques pour mieux prédire le comportement du marché et en tirer profit.

Build a clear POC and value area from the chart range you choose. BrioQuant Range Volume Profile maps the selected MT5 volume feed across price and marks the POC, VAH and VAL. Profile the visible chart, a draggable fixed range, today or the latest number of bars, with configurable value-area shading and labels. Features: Modes: Visible Range, Fixed Range (drag two handles on the chart), Today, Last N Bars POC, configurable value-area percent, VA shading, price labels Instance tag lets two copies

Compare POC and value-area placement across Asia, London and New York sessions. BrioQuant Session Volume Profile builds a profile for the selected Asia, London or New York session, or place one profile inside every recent session window. Compare how POC and value area move, overlap or remain stable from session to session while retaining the range modes for individual chart studies. Two session workflows in addition to the range modes: Session mode: Asia, London or New York. Auto follows the act

# ATR Trend Bands & EMA Indicator for MetaTrader 5 (MQL5)
A professional, volatility-adaptive trend-following indicator for MetaTrader 5. It identifies breakout momentum using dynamically adjusting **Average True Range (ATR) Bands** combined with **Exponential Moving Average (EMA)** multi-timeframe trend filters.
---
## Features
- **Adaptive ATR Channels:** Dynamically tracks trailing support/resistance bands that expand during high volatility and contract during consolidation. - **Dynam

Analyze up to 4 Stochastic timeframes side-by-side in a single window. Perfect your entry timing, confirm higher timeframe trends, and streamline your analysis without switching charts. MultiStochViewer is an essential visual tool designed for Forex, Index, and Commodity traders who rely on the Stochastic Oscillator to validate trade setups. Instead of cluttering your screen with multiple indicator windows or constantly switching timeframes, MultiStochViewer organizes and displays 4 custom Stoch

EFX RETAIL GRADE SIGNAL DASHBOARD v5.2.5 — Multi-Layer Decision Engine with V11 Divergence Fusion, CSD Trust Matrix & Precision Entry System Institutional Logic. Retail Accessibility. Transforming market complexity into clear trade probability.

Analyze up to 4 Relative Strength Index (RSI) timeframes side-by-side in a single window. Identify overbought and oversold confluence, confirm momentum, and streamline your analysis without switching charts. MultiRSIViewer is a essential visual tool designed for Forex, Index, and Crypto traders who rely on the Relative Strength Index (RSI) to validate momentum and spot market reversals. Instead of cluttering your workspace with multiple indicator sub-windows or constantly switching timeframes, M

Candle Patterns Pro v4 is a professional candlestick pattern detection indicator for MetaTrader 5, designed to help traders identify classic and less common price-action formations directly on the chart. The indicator automatically scans the market for multiple candlestick formations, highlights detected patterns, and provides a live Pattern Counter panel showing how many detected patterns are present on the chart. Key Features Classic Candlestick Patterns Candle Patterns Pro v4 detects a wide r

Adaptive Swing Density Heat Map
MT5 Structural Density Indicator — Swing Clustering, Participation Tracking, Acceptance vs Rejection & Color-Coded Heat Map Adaptive Swing Density Heat Map analyzes swing point density across price levels, then tracks how price actually interacts with each zone — measuring participation, acceptance, and rejection. The result is a heat map of structural zones, color-coded by density strength. Not all support and resistance levels are equal — this indicator quantif

Session Edge Lab Statistical Session Analysis for MetaTrader 5 Session Edge Lab is an advanced intraday statistical analysis indicator for MetaTrader 5. Unlike traditional session indicators that only display trading hours or simple breakout levels, Session Edge Lab studies historical market behavior and compares the current session structure with similar historical situations. The indicator helps traders understand current market context, identify historical tendencies, and evaluate possible co

Scalping Agent See where XAUUSD stop-hunts strike next and how they performed in the past. XAUUSD does not move like other markets. Its strongest intraday moves happen when price sweeps through a swing level and accelerates. The classic "liquidity sweep" that fuels breakout momentum. Scalping Agent continuously tracks the market swing structure, projects the levels where the next sweep can trigger, and shows you statistics data of how past signal on your chart actually played out. No repaintin

Automatically identify classic trend continuation patterns directly on your MetaTrader 5 chart. The Rising/Falling Three Methods Indicator is a technical analysis tool designed to automatically detect the classic Rising Three Methods (R3M) and Falling Three Methods (F3M) candlestick patterns. The indicator analyzes candle structure, body size, intermediate candle containment, and the final resolution candle to identify potential bullish and bearish continuation formations. Key Features Rising Th

Launch price: 30 USD - price will increase after the first purchases, so early buyers lock in this rate.
Volume Vacuum Profile is a session-by-session Volume Profile indicator for MetaTrader 5. It combines the daily Point of Control (POC), a full volume histogram and automatic Low Volume Node (LVN) detection - the liquidity vacuum zones where price tends to move fast due to a lack of resting orders.
Key features: - Volume histogram built from 1-minute data for each trading day, independent of

DKX Directional Trend Indicator is a classical and powerful trend-following tool designed for MetaTrader 5. By incorporating a weighted average of High, Low, Open, and Close prices with a 20-period decaying weight matrix, this indicator effectively smoothes out short-term market noise while retaining high sensitivity to major price direction shifts. Key Features: Noise-Free Trend Following: Uses a custom weighted algorithm (3*Close + Low + Open + High) to accurately reflect true market equili

Cause and Effect Wyckoff is a professional indicator designed for MetaTrader 5 (MT5), focused on automatically identifying consolidation areas and analyzing the potential market movement that follows a breakout. Inspired by the Cause & Effect concept, the indicator detects potential accumulation/distribution ranges, measures their duration and size, and tracks the subsequent market movement after the breakout. Key Features Automatic Cause Detection Automatically identifies consolidation areas an

LAUNCH PRICE: $45 for a limited time (regular price will increase once initial reviews are in). Institutional Climax Bars recolors every candle on your chart based on real institutional volume effort, so you see at a glance where big-money activity is building up, peaking, or absent.
WHAT IT DOES The indicator classifies every candle into 5 volume-intensity levels, inspired by Volume Spread Analysis (VSA) and Wyckoff volume theory: - White / Deep Sky Blue: low or neutral activity (normal market

Gold Sniper Levels PRO is a professional MetaTrader 5 indicator designed specifically for Gold (XAUUSD). It automatically identifies and displays important psychological levels, round numbers, intermediate levels, and attention zones directly on your chart, giving you a cleaner and more organized view of the Gold market. Designed for Gold Trading Gold Sniper Levels PRO uses a structured multi-level system specifically optimized for XAUUSD: Main Levels: 10.00 price intervals
Intermediate Levels:

Take your Forex chart analysis to the next level with FOREX ROUND LEVELS PRO — a professional indicator designed exclusively for currency pairs. Identify important psychological round-number levels automatically and visualize Main, Intermediate, and Minor levels directly on your MT5 chart. KEY FEATURES Automatic Level Detection — automatically adapts the level system to the currency pair you are trading.
Main Psychological Levels — highlights major round-number areas with strong visual emphasis.

Take your index trading analysis to the next level with INDEX ROUND LEVELS PRO, a professional MT5 indicator designed exclusively for traders who operate on major stock market indices. The indicator automatically identifies important psychological round-number levels and displays them directly on your chart, creating a clean and objective view of potential price reaction areas. KEY FEATURES Automatic Round Level Detection
Main, Mid & Minor Levels
Customizable Number of Levels Above & Below Price

Opening Range Boxes Multi-Session Indicator Advanced multi-session opening range breakout indicator with automatic timezone detection, dynamic TP/SL projections, and real-time breakout alerts. Supports up to 5 configurable sessions for Forex, Gold, Silver, and Crypto instruments. Full Description: Opening Range Boxes Multi-Session Indicator is a comprehensive visual trading tool designed for traders who implement the Opening Range Breakout (ORB) strategy. This indicator automatically identifi

Liquidity Structure & Flow Mt4 Here indicator visualizes institutional market depth, volume concentration, and whale order flow directly on your MT5 cumulative volume engine . Core Components & Meanings Visual Element Meaning Orange Horizontal Line ( POC ) Point of Control : The exact price level where the highest volume was traded. Acts as a price magnet and institutional support/resistance. Background Heatmap Glow (Teal / Red) Liquidity Nodes : Bright areas indicate heavy liquidity/acceptan

Volume Pressure Pro See who really controls the market — before the move becomes obvious. Most indicators show you where price has been . Volume Pressure Pro shows you who is winning the battle right now — buyers or sellers. This is not another repainted RSI or MACD clone. It is a proprietary algorithm built from scratch, and its formula remains a trade secret — which is exactly why its signals look like nothing else on your chart. What you get Clear BUY/SELL signals — a green arrow to buy

Woodie CCI System MTF The Woodie CCI System MTF is a trading framework designed to reduce chart clutter and decision paralysis. Built on Ken Wood’s proven methodology and expanded with modern multi-timeframe analytics, it combines the fast Turbo CCI, slow CCI, automated trend detection, and a live multi-timeframe dashboard into a single, high-performance MT5 indicator.
Core Trader Questions Answered What is the current primary trend?
Answered by the Automated Histogram: The histogram shifts c

Woodie CCI MTF Plus
The Woodie CCI MTF Plus is an advanced, multi-timeframe trading engine engineered to eliminate chart clutter and trading hesitation. Expanding on Ken Wood’s core methodology, this upgraded system integrates the classic Woodie CCI engine with a Dynamic Multi-Timeframe (MTF) Dashboard , Trend Age Tracking , and Consensus Background Alignment Alerts, giving you full higher-timeframe context on a single chart.
Core Trader Questions Answered
What is the global market trend ac

Omega Quantum Pro – Advanced Multi-Layer Market Analysis Indicator Omega Quantum Pro is an advanced MetaTrader 5 indicator designed to analyze market conditions through multiple independent analytical engines and combine their results into one clear trading decision. Instead of relying on a single technical indicator, Omega Quantum Pro evaluates trend, momentum, volatility, market structure, multi-timeframe conditions, entry quality, and market regime to identify higher-quality BUY and SELL oppo

Lisez la tendance et celle du timeframe supérieur sur un seul graphique, avec une ligne qui garde son niveau. No repaint.
Toutes paires, tous timeframes. Sur votre graphique en 2 minutes. Démo gratuite dans le Strategy Tester.
Get more indicators here
Baselines, volatility filters and oscillators. No repaint.
Pourquoi vous en avez besoin Une moyenne mobile classique reste en retard sur le prix. Après un mouvement fort, la ligne reste loin du prix et vous donne un niveau qui n'a plus de sens.
FREE

Chaque journée de trading commence avec deux niveaux qui ont déjà leur importance avant même l’apparition du premier setup intraday : le plus haut et le plus bas de la veille . Les plus hauts et les plus bas font partie des niveaux les plus utilisés pour définir une zone de prix, que ce soit pour accompagner un breakout ou identifier une zone pertinente pour un retournement. Mais qu’est-ce qui définit réellement, d’un point de vue mathématique, un bon plus haut et un bon plus bas ? Vous pouvez u

**Stop switching charts. Put a second live chart inside the one you are already watching.**
XMCR draws a real, live mini chart directly on top of your main chart. It is not a picture and not a copy of old bars. It is a working chart window that updates tick by tick, with its own timeframe, its own symbol, and its own indicators inside it.
You watch M1 for your entry. You need H1 for context. Normally you switch back and forth, or you open a second window and lose screen space. With XMCR you se

Structure King AI Signal Structure King AI Signal is a professional MetaTrader 5 trading indicator designed to help traders analyze market structure, trend direction, multi-timeframe confirmation and trade management from one clean dashboard. Key Features • Market Structure & Trend Analysis
• BUY / SELL Signals
• Multi-Timeframe (HTF) Confirmation
• Entry Price Levels
• Dynamic Stop Loss (SL)
• TP1 / TP2 / TP3 Levels
• ATR Volatility Analysis
• ADX Trend Strength Filter
• Adaptive Market Filter

TraderStart Opportunity Radar
Scan multiple markets. See what is developing. Know what needs to happen next.
Watching many markets manually can be slow and inconsistent. A trader may understand the broader direction of a market but still struggle with three practical questions: Which chart deserves attention now? Is the setup actually progressing? What still needs to happen before it is ready for a final review?
TraderStart Opportunity Radar is a MetaTrader 5 decision-support indicator desig

High Probability Breakout Trades Indicator - Overview
The Core Philosophy
This isn't just another breakout scanner - it's a multi-dimensional confluence engine that combines rare candle patterns with institutional-level volume profiles and statistical edge calculations. The holy grail here is waiting for EVERY signal to align before pulling the trigger.
---
The 4-Candle Harami Breakout Pattern - Your Primary Entry Trigger
Why This Pattern Matters
The strict 4-candle Harami breakout is a h

Professional Volume Profile - Institutional Levels - Value Area - HVN/LVN - Naked IVL Gold Institutional Profile is a professional volume analysis indicator designed specifically for XAUUSD (Gold) . Instead of simply displaying volume, the indicator transforms daily volume distribution into a clear and structured Volume Profile , helping traders identify areas of high activity, low-volume regions, value zones, and historically significant volume levels. The indicator was designed to provide a cl

SMC OrderBlock Pro is a professional Smart Money Concepts indicator that automatically detects Institutional Order Blocks.
FEATURES:
Auto Bullish Order Block (Blue) - Last bearish candle before bullish BOS
Auto Bearish Order Block (Orange) - Last bullish candle before bearish BOS
Break of Structure (BOS) Detection
Clean non-repainting boxes - Professional look
Works on ALL symbols: XAUUSD (Gold), EURUSD, GBPUSD, BTCUSD, All Forex
Works on ALL timeframes: M1, M5, M15, H1, H4, D1
P

« Voir 6 timeframes + ne plus jamais manquer la fermeture d'une bougie. » MTF Candle Countdown — visualisez les bougies de 6 horizons temporels sur un même graphique, avec un compte à rebours en direct qui vous avertit avant chaque fermeture ou ouverture de bougie. Présentation Fini les changements de graphiques ! Cet indicateur affiche des groupes de bougies de Daily, 1H, 30M, 15M, 5M et 1M côte à côte sur votre graphique actuel, avec une étiquette claire et un compte à rebours en direct

Trendlines Breaks is a MetaTrader 5 indicator designed to automatically detect dynamic trendlines and identify potential price breaks. The indicator analyzes pivot points, calculates trendline slopes, and displays breakout signals when price moves beyond detected trendline levels.
The indicator helps traders analyze market structure by displaying upper and lower trendlines together with breakout markers. It supports different slope calculation methods, including ATR-based, standard deviation-ba

Confluence Trader Indicator — Multi-Filter Signal Tool for MT5 Confluence Trader plots high-probability entries directly on your chart. Trend direction, momentum, and price action are checked together, and an arrow only appears when all of them agree — setups that pass just one or two filters are ignored. Candles are colour-coded to show the prevailing trend at a glance, so you always know which side of the market the tool is favouring. Green arrows mark buy setups, orange arrows mark sell setup

Sans repeinte, et mesuré : 199 984 contrôles d'invariance sur 4 symboles et 3 unités de temps ont donné 0 changement. Ce que Deep Water dessine sur une bougie clôturée reste là où il a été dessiné. La plupart des pertes des particuliers ne viennent pas de mauvaises entrées. Elles viennent du fait de se trouver du mauvais côté d'un événement de liquidité : sorti au stop quelques pips avant le mouvement sur lequel on avait raison. Deep Water marque l'endroit où ces événements se produisent. Il ne

ADX MA: The Ultimate Trend Strength Guide
In forex trading, the Average Directional Index (ADX) is a vital indicator for gauging trend strength. Here's a streamlined approach to using ADX for effective trading:
1. Add ADX to your forex chart. 2. Interpret ADX values: <20 is weak, >40 is strong. 3. Identify trend direction: +DI above -DI indicates an upward trend, and vice versa. 4. Execute trades based on ADX and trend: Strong up trend, consider buying; strong down trend, consider selling; we

Multi-Confluence Reversal Alert | RSI + Heikin Ashi + Divergence + Key Levels | SL/TP Lines | No Repaint
Confluence Reversal Alert is a professional-grade reversal detection indicator for MetaTrader 4. It combines five powerful trading concepts into a single, clean alert system — giving you high-probability reversal signals with automatically drawn Entry, Stop Loss, and Take Profit levels directly on your chart. Designed for traders who use VSA (Volume Spread Analysis), price action, and multi-

Pivot Points Indicator by Thunder FX**
Unlock the hidden structure of the market with the **Thunder FX Pivot Points Indicator** — a clean, powerful, and lightning-fast tool designed for serious traders who want precise support & resistance levels every single day.
Whether you trade Forex, Indices, Crypto, or Gold, this indicator automatically plots the classic **Pivot Point (PP)** along with **R1–R3** and **S1–S3** levels in real time. No more manual calculations. No more guessing. Just cle

Squeeze Momentum Pro — TTM Squeeze Momentum Indicator for MT5
(The old version is named "Dot Histogram Trend for Buy Sell) Squeeze Momentum Pro is a professional Squeeze Momentum indicator for MT5 that combines a volatility squeeze detector with a color‑coded momentum oscillator in a single window. Built on the well‑known TTM Squeeze concept (Bollinger Bands inside Keltner Channels), this MT5 momentum indicator helps forex, indices, metals and crypto traders spot low‑volatility compression befor

ShooterSignal ShooterSignal is a multi-timeframe market structure indicator for MetaTrader 5. The indicator analyzes price data and identifies swing points used to display market structure on the chart. Market Structure The indicator identifies: Higher High (HH) Higher Low (HL) Lower High (LH) Lower Low (LL) These structural points are displayed on the chart according to the selected timeframe. Structure Events ShooterSignal can display structural events based on detected price movement, includ

Nafiyan MTF Indicator Setfiles Nafiyan MTF Indicator is a multi-timeframe technical analysis tool designed to give traders a clear view of RSI, MA trend direction, swing levels, active trades, PnL, and multiple Stochastic signals in one compact indicator. Key Features Multi-Timeframe RSI Table — Monitor RSI across 5 customizable timeframes, with automatic overbought, oversold, and neutral color zones. Multi-Timeframe MA Trend — Displays Bullish, Bearish, or Neutral conditions using Fast/Slow MA

VAMA Signal Simulator analyse 7 unités de temps (M1-D1, pondérées de 5% à 30%) et note chacune sur 4 moyennes mobiles et 6 oscillateurs, les combinant en une lecture pondérée Strong Buy/Buy/Neutral/Sell/Strong Sell. Un signal confirmé doit également concorder avec une moyenne mobile H4 adaptative à la volatilité (la période se raccourcit en forte volatilité, s'allonge sur un marché calme) ET avec la direction de tendance sur M15 et H1. Chaque signal confirmé reçoit une flèche et une étiquette BU

Hexad Grid Market Structure Trading Suite
Hexad Grid Market Structure Trading Suite is an all-in-one MT5 market-structure and price-action indicator designed to keep key trading information on one clean chart.
It includes:
Swing Highs & Lows — selectable 3-candle or 5-candle swing model.
Market Bias — independent 3/5-candle structural bias with confirmed body-close shifts.
Order Blocks — identifies source candles/stacks behind qualified displacement.
Session Highs & Lows — Asia, London

The I ndicator is designed for XAUUSD (Gold) traders who want important market levels and clear directional signals directly on the chart. Instead of filling the chart with unnecessary indicators, it focuses on key price areas from higher timeframes and displays them directly on your trading chart. Main Features H1 and H4 Support & Resistance Levels Automatically selects the most important levels Displays higher-timeframe levels directly on the lower-timeframe chart Separate support and resistan

L'indicateur Crypto_Forex « Détecteur de Flat RSI » est un outil auxiliaire performant pour le trading ! Sans repeint. Améliorez vos méthodes de trading grâce à cet excellent indicateur pour MT5. - Cet indicateur affiche les zones de flat sur le graphique. Son paramètre « Sensibilité Flat » permet de détecter ces zones. - Le « Détecteur de Flat RSI » peut être utilisé pour confirmer les entrées en Price Action ou en combinaison avec d'autres indicateurs. - Utilisez-le dans vos systèmes de suivi

Massive Gold SuperTrend Queen M15 - Real Trading Mistakes Edition
Real Trading Mistakes solved by Real Queen.
Most traders lose on Gold because they enter against the trend, late entries, and fake breakouts. This Queen fixes those 3 mistakes.
WHAT IS IT? Powerful SuperTrend based Queen indicator designed for XAUUSD Gold M15. Works on all pairs but optimized for Gold. Shows real trend with massive accuracy. No repaint after bar close.
WHY "Real Trading Mistakes" Edition? Created from YouTube

Alberto Countdown Dashboard is a professional multi-timeframe candle timer dashboard for MetaTrader 5. Monitor the current candle and up to six configurable timeframes from one chart without changing your workspace. Multi-timeframe dashboard - Up to 6 independent MTF countdown rows - Default periods: M5, M15, H1, H4, D1 and W1 - Exact remaining time and progress percentage for every row - Large current-candle countdown and progress meter - Broker server clock and active/paused market status - Pr

McGinley Dynamic Fusion — مؤشر تحليل واتجاه ذكي الوصف المختصر (Short Description) مؤشر بصري متقدم يعتمد على خطي McGinley Dynamic (سريع/بطيء) مع شموع حرارية، إشارات دخول، ومستويات وقف خسارة وأهداف ربح تلقائية لكل إشارة — بدون تنفيذ صفقات. الوصف الكامل (Full Description) McGinley Dynamic Fusion هو مؤشر متكامل مصمم لمساعدتك على قراءة الاتجاه واللحظات المناسبة للدخول بوضوح تام على الشارت، اعتمادًا على خط McGinley Dynamic الشهير بدقته العالية في تتبع السعر مقارنة بالمتوسطات التقليدية. أبرز المميزات خ

# MQL5 Submission - Trend Momentum Signals (Indicator)
Ready-to-paste text for the MQL5 Market. It's an INDICATOR (Product type = Indicators). Honest, no performance claims - it shows signals; the buyer decides.
---
**Product name:** Trend Momentum Signals
**Product type:** Indicators **Account type:** Any
**Short description (top line buyers read first):** Trend-aligned momentum and breakout signal arrows for any symbol and timeframe. Two trend-filtered entry patterns, RSI/ATR confirmatio

Il s'agit d'un indicateur de « price action » (action des prix) basé sur un code couleur. En résumé, il analyse en arrière-plan le momentum du marché, les configurations de chandeliers et une ligne de tendance (moyenne mobile exponentielle ou EMA) sur 20 périodes ; il colore ensuite les chandeliers de votre graphique pour vous indiquer précisément qui contrôle le marché.
Au lieu de deviner si une tendance est forte, faible ou en train de s'inverser, il vous suffit d'observer les couleurs.
Uni

Swing Volume Profile MT5 Swing Volume Profile Indicator — Auto Swing Detection, Volume Profile, Fibonacci Retracement & RSI Overlay in One Chart Tool Swing Volume Profile (SVP) automatically detects structural swings and displays a volume profile for the most recent completed swing — with Fibonacci retracement and RSI overlay. No manual range selection. No trendline required. The indicator finds the swings and builds the profile automatically. MT5 Native • No Repainting • Auto Swing Detection •

Auto-levels trading robot: key levels & risk manager Short Description: Automatically plots dynamic weekly support and resistance zones with real-time risk tracking. Full Description: Elevate your chart analysis with a dynamic tool designed to map the market structure effortlessly. This indicator automatically calculates and plots critical support and resistance levels based on weekly price action, updating every new week to align seamlessly with current market dynamics. By projecting precise pe

SwingPoint Levels — calcul des niveaux de trading à partir d'un point spécifié, pour tout instrument et timeframe de H1 à Daily
SwingPoint Levels analyse et construit des niveaux de trading en utilisant une logique universelle de structure des prix, ce qui permet d'appliquer la même méthode d'analyse puissante sur les marchés Forex, actions, futures et cryptomonnaies, sans avoir besoin de versions séparées pour chaque marché. La plage de timeframes recommandée est de H1 à Daily, où la structur

ATR Zigzag With Bollinger Bands Pro Pips Predict Description de l'Indicateur ATR Zigzag With Bollinger Bands Pro Pips Predict est un indicateur technique professionnel pour la plateforme MetaTrader 5 qui combine plusieurs outils puissants d'analyse de marché : ZigZag basé sur l'ATR — construit un zigzag basé sur la volatilité (ATR) Bandes de Bollinger — canaux dynamiques de volatilité Segment Médian — ligne médiane de support et de résistance Mode Prédictif — prévision du prochain mouvement Aff
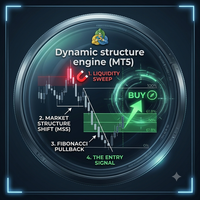
Dynamic Structure Engine (DSE) The Ultimate Quantitative Algorithmic Engine for Market Structure & Smart-Money Tracking. Stop guessing where the true institutional levels are. The Dynamic Structure Engine (DSE) is a premium, rule-based institutional tracker designed to automate your entire top-down analysis. By combining multi-timeframe trend filtering, dynamic volatility adjustments, and real-time liquidity sweep detection, DSE provides pristine, high-probability trade setups directly on your c

Neuron Squeeze reads the volatility cycle. Bollinger Bands contracting inside the Keltner Channels is the signature of a market storing energy; the bands pushing back outside is the signature of a market spending it. This indicator marks both states bar by bar on the zero line, drives a four-colour linear-regression momentum histogram that shows which side is in control and whether that control is building or bleeding away, and grades the depth of every coil on a panel so a shallow pause never r

Candle Pulse Countdown is a clean and customizable candle-close timer for MetaTrader 5. See exactly how much time remains before the active candle closes, synchronized with the broker server time. Trade with better timing awareness Use the countdown to prepare for candle-close confirmations, avoid entering without noticing an imminent close and keep discretionary PO3 or CRT (Candle Range Theory) analysis aligned with the selected timeframe. Main features Live countdown for the active candle Floa

Neuron MacD is a MACD you can read at a glance instead of squinting at. The histogram is split into four colours — not two — so each bar tells you which side of zero it sits on and whether it is still growing or already shrinking. The MACD line changes colour the moment it crosses its signal, a dot marks every cross on the signal line itself, and the whole calculation can be pulled from a higher timeframe while you trade a lower one. It is an indicator for chart analysis only: it draws on the ch

Ranked Support & Resistance Zones – Graded Strength Scoring Automatically detects support and resistance zones and ranks each one by strength — Weak, Standard, Strong, or Mitigated — so you instantly know which levels the market actually respects.Most S/R indicators draw lines. This one tells you which lines matter.
NOEL_RankedSR_Zones scans price action and builds zones automatically, then scores each one in real time based on how many times it's been tested and how cleanly price has reacted.

FXPRG Smart Trend Break is a signal indicator for MetaTrader 5. It combines price-action analysis with a built-in optimization engine that searches historical closed candles and selects a suitable profile separately for the current symbol and timeframe. The internal optimized settings remain protected. The user sees the resulting signals and performance rate without seeing the selected technical parameters. Main Features Clear BUY and SELL arrows. Entry, Take Profit and Stop Loss levels. Signals

NovaTrend ELITE Scanner This Scanner Scans the market to locate and display fresh signals from this indicator: https://www.mql5.com/en/market/product/186639?source=Site +Market+My+Products+Page IT Find the markets where trend strength is actually building — before you waste time opening dozens of charts. NovaTrend ELITE Scanner is a multi-symbol, multi-timeframe market scanner built around the NovaTrend Adaptive Trend Strength engine. Instead of simply reporting whether price is moving up or do

Stop Adding... Start Building... What if one indicator was all you needed?
MQLTeam Mega Indicator est un panneau graphique révolutionnaire pour MetaTrader 5.
Il remplace les graphiques encombrés et les modèles lourds en combinant plus de 45 indicateurs populaires dans un seul moteur unifié.
Conçu pour les traders Forex, Gold (XAUUSD), Indices et Crypto qui ont besoin d'une analyse professionnelle avec une expérience utilisateur moderne et fluide. Plus d'outils MQLTeam Au lieu d'ouvrir constamme

LAUNCH SALE: $50 — price increases $50 every 10 sales. Lock in the lowest price now.
Heatmap Zone is a rolling volume-based trading tool built for traders who want to see where real volume is concentrated, not just where price has been. Instead of a static profile that only updates at the end of a session, Heatmap Zone builds and projects the volume picture live, bar by bar, directly on your chart.
It combines volume heatmap visualization, a smoothed Point of Control, a fully configurable

Trend Compass — Adaptive Trend Indicator with Multi-Timeframe Confirmation for MetaTrader 5 Overview Trend Compass is a MetaTrader 5 indicator that combines an adaptive trend line, a dynamic volatility channel, and a multi-timeframe confirmation panel in a single tool. Unlike classic moving averages, the line speeds up or slows down on its own depending on how efficiently price is actually moving — so it lags less in trends and stays quieter in ranging markets. The indicator is non-repainting: v

English Introduction Pure Structure Gold Signal is a price-structure indicator designed for Gold trading on MT5. The indicator analyzes market structure, breakout behavior, trend conditions, and price position to identify potential BUY and SELL signals. How to Use When a BUY or SELL signal appears, it indicates that the indicator has detected a relatively clear structure breakout and a potential trend-trading opportunity. When no BUY or SELL signal appears, traders can use the colored candle

Stop Watching the Moving Average. Get Alerted. Moving Average Alert automatically monitors price interaction with your Moving Average and alerts you when your selected candle and price-action conditions occur. Don't settle for a basic MA crossover alert. KEY FEATURES Close Above MA
Detect bullish candles closing above the Moving Average. Close Below MA
Detect bearish candles closing below the Moving Average. Close Above/Below MA
Monitor both bullish and bearish MA breaks. Touc

Indices Metals MTF Scanner Scan major global indices and precious metals across multiple timeframes from one professional dashboard. The CapitalSol Indices Metals MTF Scanner is a multi-symbol and multi-timeframe market analysis tool for MetaTrader 5. It provides a structured overview of bullish and bearish market conditions across selected indices and metals without the need to open and analyze every chart individually. The scanner evaluates the relationship between a Fast EMA and Slow EMA on f

NOEL VTT – Tendance de la Traînée Vectorielle avec Score Z adaptatif ATR et RSI Au cœur de cette zone se trouve un centre de tendance projeté vers l’avant par la vitesse du prix — pas une simple moyenne mobile, mais une ligne qui s’adapte à la vitesse réelle du marché. Entouré d’un sentier ATR à cliquet : il ne fait que se resserrer à votre avantage, ne se desserre jamais, donc vous voyez toujours un niveau d’arrêt propre, non repeint.
At its core is a trend center projected forward by price ve

Session Volume Profile — Stepped POC & Value Area Short description (MQL5 summary field) Multi-session Volume Profile displaying POC and Value Area (VAH/VAL) as developing step lines. Tokyo, London, New York, Daily and a custom session can be displayed simultaneously, each with its own hours, its own levels and its own colour. Works with both real volume (futures, stocks) and tick volume (Forex, CFDs). Full description The problem A standard Volume Profile draws a flat POC line across the whole
Le MetaTrader Market offre un lieu pratique et sécurisé pour acheter des applications pour la plateforme MetaTrader. Téléchargez des versions démo gratuites de Expert Advisors et des indicateurs directement depuis votre terminal pour les tester dans le testeur de stratégie.
Testez les applications dans différents modes pour surveiller les performances et effectuez un paiement pour le produit que vous souhaitez en utilisant le système de paiement MQL5.community.

Vous manquez des opportunités de trading :
- Applications de trading gratuites
- Plus de 8 000 signaux à copier
- Actualités économiques pour explorer les marchés financiers
Inscription
Se connecter
Vous acceptez la politique du site Web et les conditions d'utilisation
Si vous n'avez pas de compte, veuillez vous inscrire