
|
12+ años
experiencia
|
33
productos
|
600
versiones demo
|
|
0
trabajos
|
0
señales
|
0
suscriptores
|


Evgeniy Scherbina

· 1
William Tiberius Patrice Schulz
2022.10.14
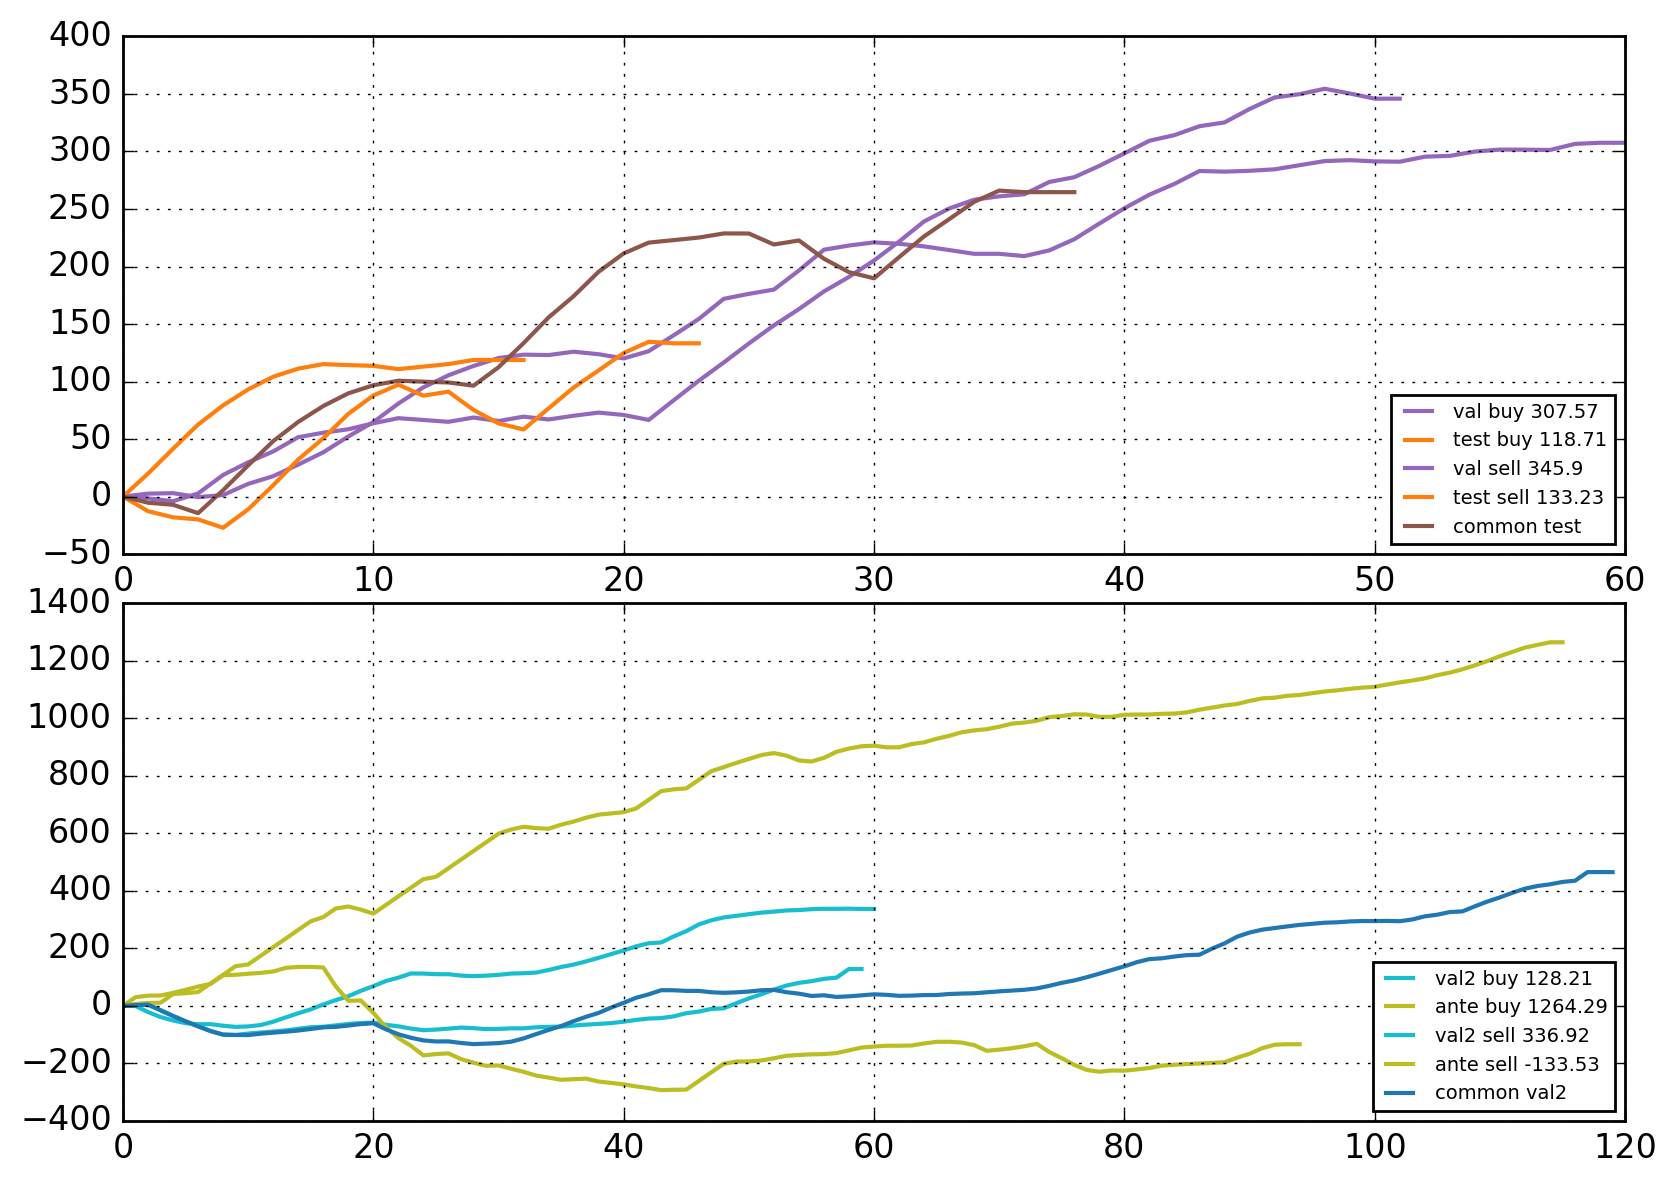
Very nice, please keep posting about your progress and let us know when its done. Its mid of october by now.
Evgeniy Scherbina

· 1
William Tiberius Patrice Schulz
2022.07.11
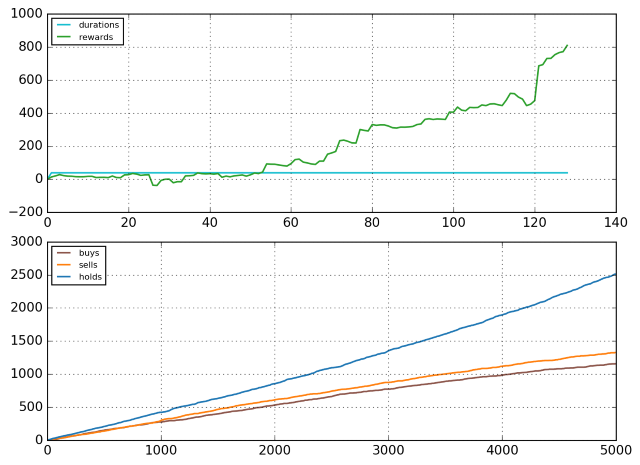
I like the progress a lot,but hwave you considered applying reinforcement learning for buy/sell/none directly on the symbols instead of optimizing a NN?