Kourosh Hossein Davallou / Perfil
- Información
|
13+ años
experiencia
|
33
productos
|
75
versiones demo
|
|
0
trabajos
|
0
señales
|
0
suscriptores
|
Dual Timeframe Indicador VWAP para MT4 Descripción Indicador profesional VWAP que muestra tanto **Daily** como **Weekly** VWAP simultáneamente en su gráfico. Características : - Líneas VWAP duales: Azul para Diario, Rojo para Semanal - Bandas configurables: Dos bandas de desviación para cada marco temporal - Control de sesión: Horas de negociación personalizables para el VWAP diario - Visualización clara: Líneas continuas para el VWAP principal, discontinuas para las bandas - Optimizable: Los

Histograma ZigZag avanzado con detección de divergencias y simulación de flujo de órdenes ZigDeltaSwingPro es un completo indicador de análisis técnico para MetaTrader 5, basado en el clásico algoritmo ZigZag y mejorado con funciones modernas como detección de divergencias, visualización dinámica de histogramas, reconocimiento de patrones de swing y simulación de flujo de órdenes. Diseñado tanto para scalpers como para swing traders, aprovecha el volumen interno de ticks de MT5 para ofrecer
RenkoVP is a professional-grade indicator designed for structure-based traders who rely on Renko bricks, volume profile, Fibonacci zones, and pattern recognition. It runs fully online on the main chart—no offline charts required—and offers a modular, interactive interface for precise market analysis.
---
📸 Visual Integration (Based on Chart Screenshots)
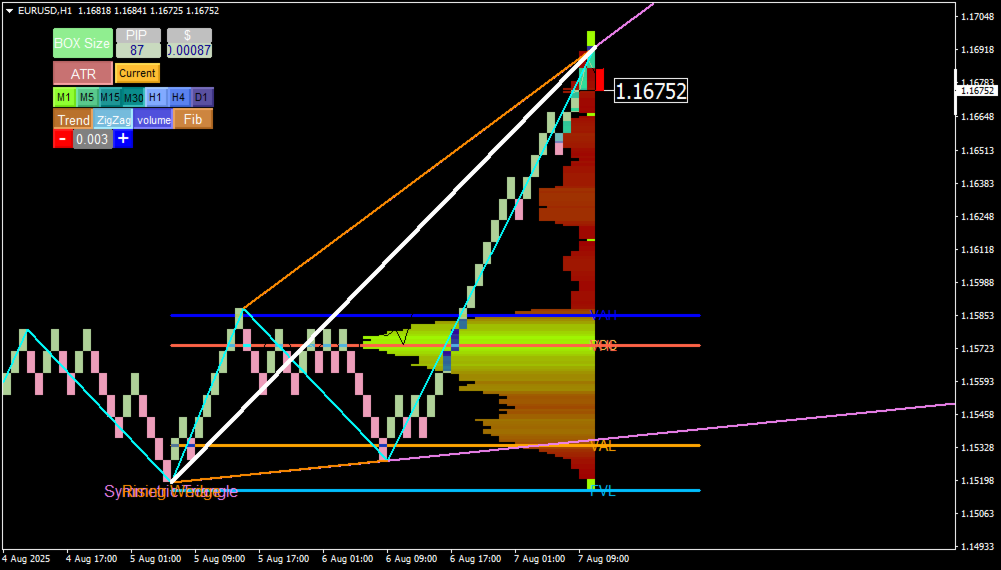
The screenshots demonstrate RenkoVP in action on EUR/USD charts (H1 and M5), showcasing:
- Renko Bricks: Turquoise and pink bricks represent bullish and bearish moves. Brick size is dynamically set via ATR (Auto mode) or manually in pips/dollars.
- Trend Line Tool: A white diagonal line connects the highest and lowest visible prices. Once drawn, it activates Volume and Fibonacci tools.
- Volume Profile: Displayed as a horizontal histogram on the right, with color-coded zones:
- POC (orange line): Highest traded volume
- VAH / VAL (blue lines): Value Area High/Low
- HVL / LVL / DVL / TVL: Additional volume metrics for deeper insight
- Dynamic Fibonacci Levels: Drawn from the trend line, fully editable. Key levels like 61.8% are marked for reversal or continuation setups.
- Zigzag & Pattern Recognition: Zigzag lines adapt to Renko structure. The indicator auto-detects classic and harmonic patterns (Triangle, Flag, Bat, Butterfly, etc.).
- Control Panel: Includes BOX Size, ATR, timeframe buttons (M1 to D1), and toggles for Trend, Zigzag, Volume, and Fibo modules.

Indicador avanzado Renko y Punto y Figura con análisis de patrones de ganancias y pérdidas Este potente indicador combina dos estrategias probadas -Renko y Punto y Figura (P&F)- en una herramienta integral para la identificación de tendencias, el reconocimiento de patrones y la gestión de riesgos. Con el cálculo dinámico del tamaño de caja (fijo o basado en ATR), los filtros de medias móviles y la detección de patrones de ganancias/pérdidas, los operadores pueden tomar decisiones más
Los bloques de órdenes son estructuras esenciales en la negociación que indican las zonas en las que los grandes operadores institucionales, como bancos y fondos de cobertura, han colocado sus órdenes. Estos bloques representan niveles de precios significativos en los que se ha producido una importante actividad de compra o venta, lo que proporciona pistas sobre posibles movimientos del mercado. Entonces, ¿por qué debería usted, como operador, preocuparse por los bloques de órdenes? Bueno, saber
Visión general RenkoVP es una herramienta profesional para el análisis de la estructura de precios que se ejecuta completamente en línea en el gráfico principal. A diferencia de muchos otros indicadores Renko, no requiere gráficos offline. El indicador combina ladrillos Renko, perfil de volumen, niveles dinámicos de Fibonacci y reconocimiento automático de patrones para ayudar a los operadores a identificar tendencias, zonas clave y puntos precisos de entrada/salida. Configuración de ladrillos

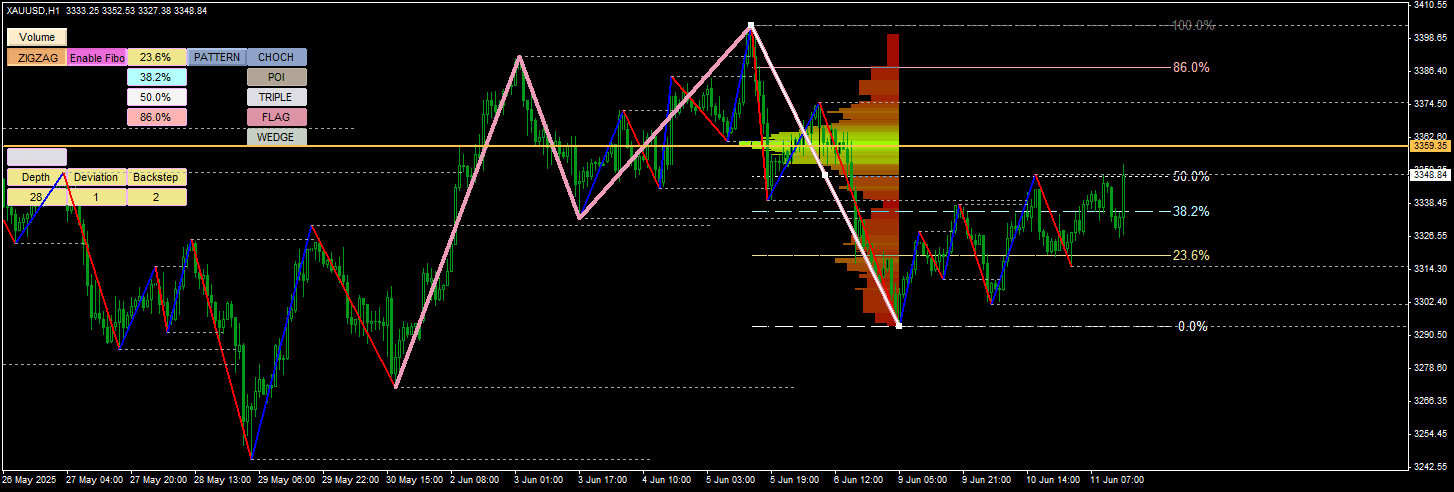
🔸 Price had retraced to the 50% Fibonacci level following a prior downtrend, signaling a possible corrective move.
🟢 There was a demand zone at that level, showing previous strong buying interest.
📐 The lower boundary of a flag/wedge formation aligned perfectly with this Fib level, hinting at a breakout opportunity.
🔁 A bullish Change of Character (CHoCH) had just formed, suggesting a structural shift from bearish to bullish momentum.
📊 Supporting evidence: bullish candles forming at support and a low-volume pullback, ideal for catching a breakout early.
👉 The plan: Enter long at or just above the 50% level, with stop-loss below the wedge and targets toward 61.8% and beyond.
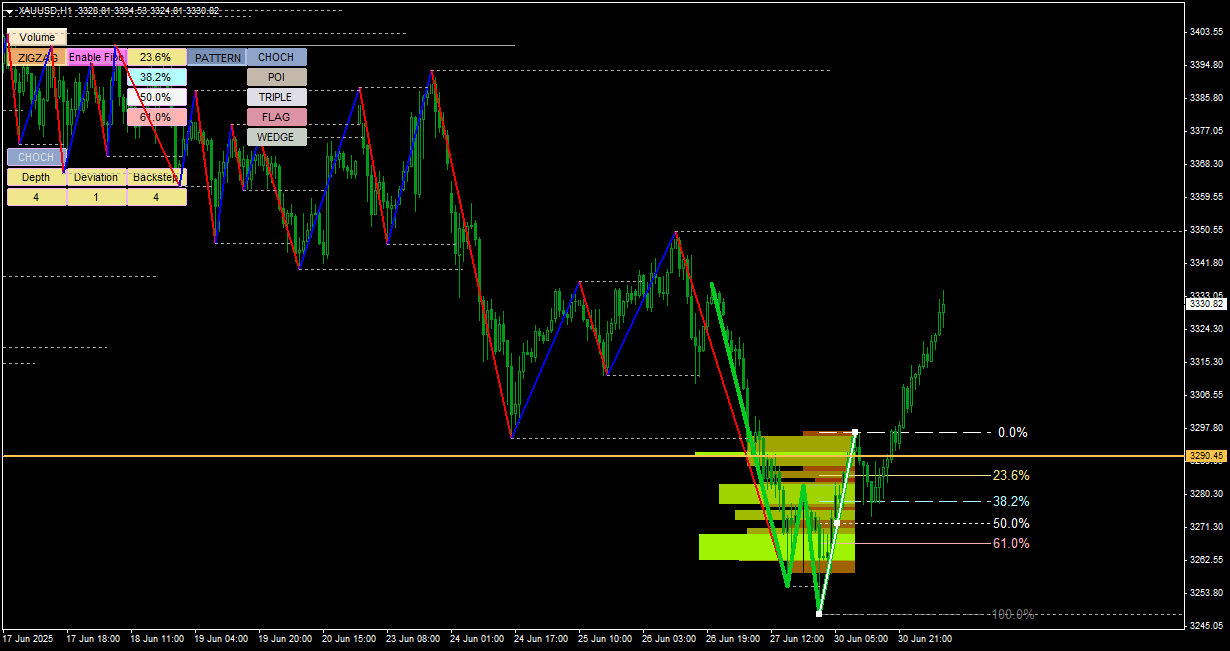
✅ How the Second Chart Validates the Strategy
In the updated chart:
✅ Price respected the 50% zone and reversed upward, triggering the planned buy entry.
🚀 The wedge pattern broke to the upside, confirming the structural breakout.
📈 A second CHoCH formed, reinforcing that bulls had regained control.
🎯 Price reached the 61.8% target zone and was pushing toward extended Fibonacci projections (e.g. -100%).

Descripción: Eleve su análisis gráfico con este indicador avanzado que integra a la perfección estructuras en zigzag, retrocesos de Fibonacci y perspectivas de perfil de volumen. Diseñado para operadores que buscan claridad y precisión, esta herramienta identifica visualmente patrones de precios de alta probabilidad y puntos de inflexión del mercado. Tanto si está siguiendo cambios de CHOCH, señalando PDIs, o analizando TRIPLE tops y formaciones FLAG, este indicador ofrece la profundidad y


