|
no
experiencia
|
1
productos
|
12
versiones demo
|
|
0
trabajos
|
0
señales
|
0
suscriptores
|
Desarrollador de sistemas automatizados de trading en FX enfocado en estrategias robustas y basadas en reglas.
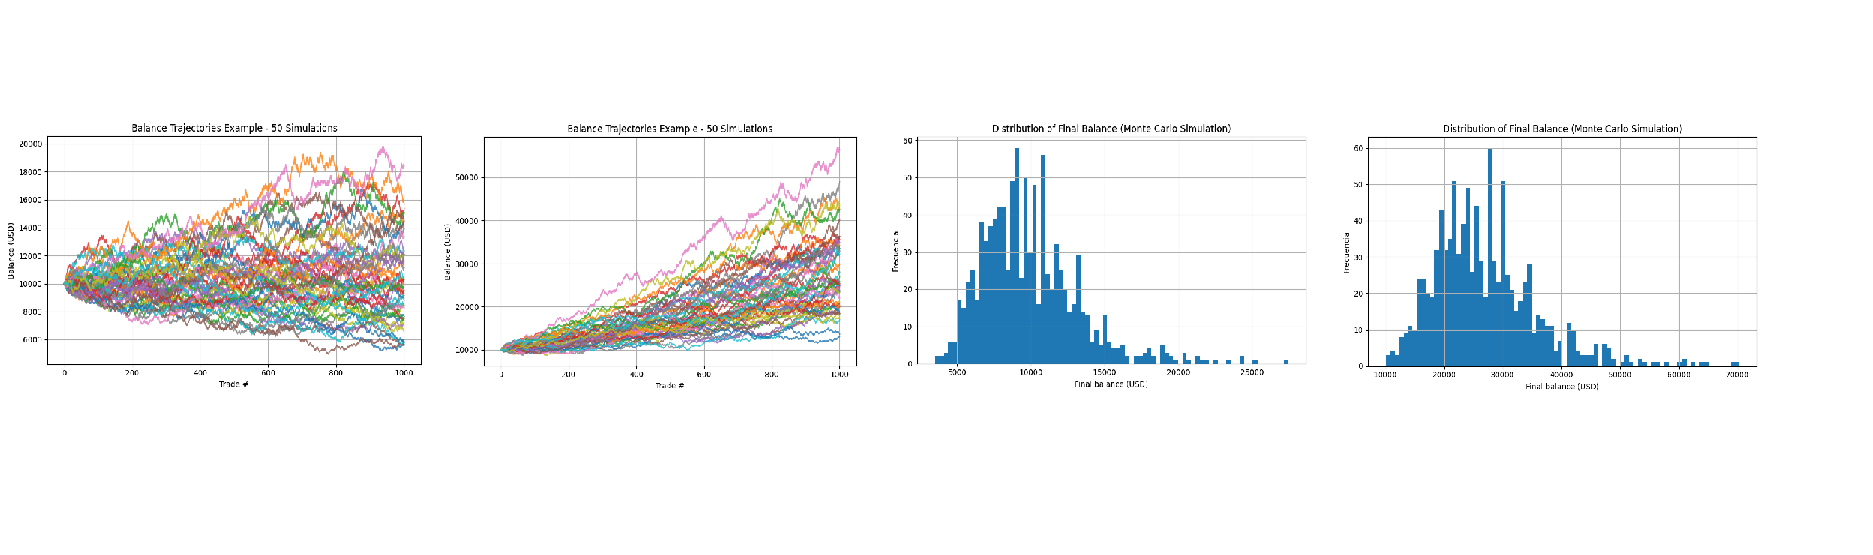
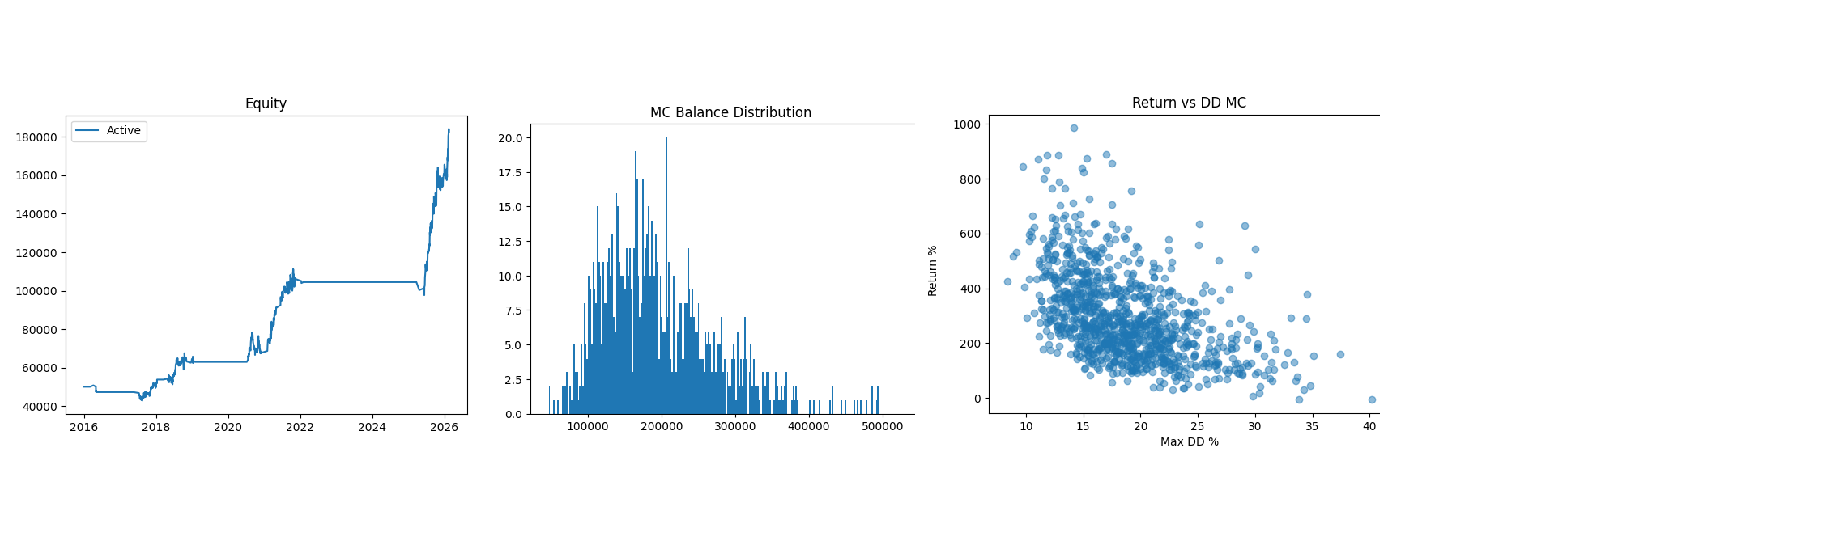
Mi trabajo se centra en sistemas automatizados basados en rangos y conscientes del régimen de mercado, diseñados con énfasis en la preservación de capital, la consistencia estadística y la supervivencia a largo plazo en condiciones reales de mercado.
Priorizo la ejecución selectiva, la exposición al riesgo controlada y un diseño conservador por encima de enfoques agresivos o de alta frecuencia. Todos los sistemas se construyen utilizando lógica transparente, filtros de seguridad estrictos y una extensa evaluación histórica a través de distintos regímenes de mercado.
El soporte, la claridad y el perfeccionamiento continuo son principios fundamentales detrás de cada lanzamiento.
Amigos
Si añade a sus amigos a través de sus perfiles o la búsqueda, podrá comunicarse y monitorear fácilmente su presencia en el sitio web.