|
不
经验
|
1
产品
|
12
演示版
|
|
0
工作
|
0
信号
|
0
订阅者
|
FX automated systems developer focused on robust, rule-based strategies.
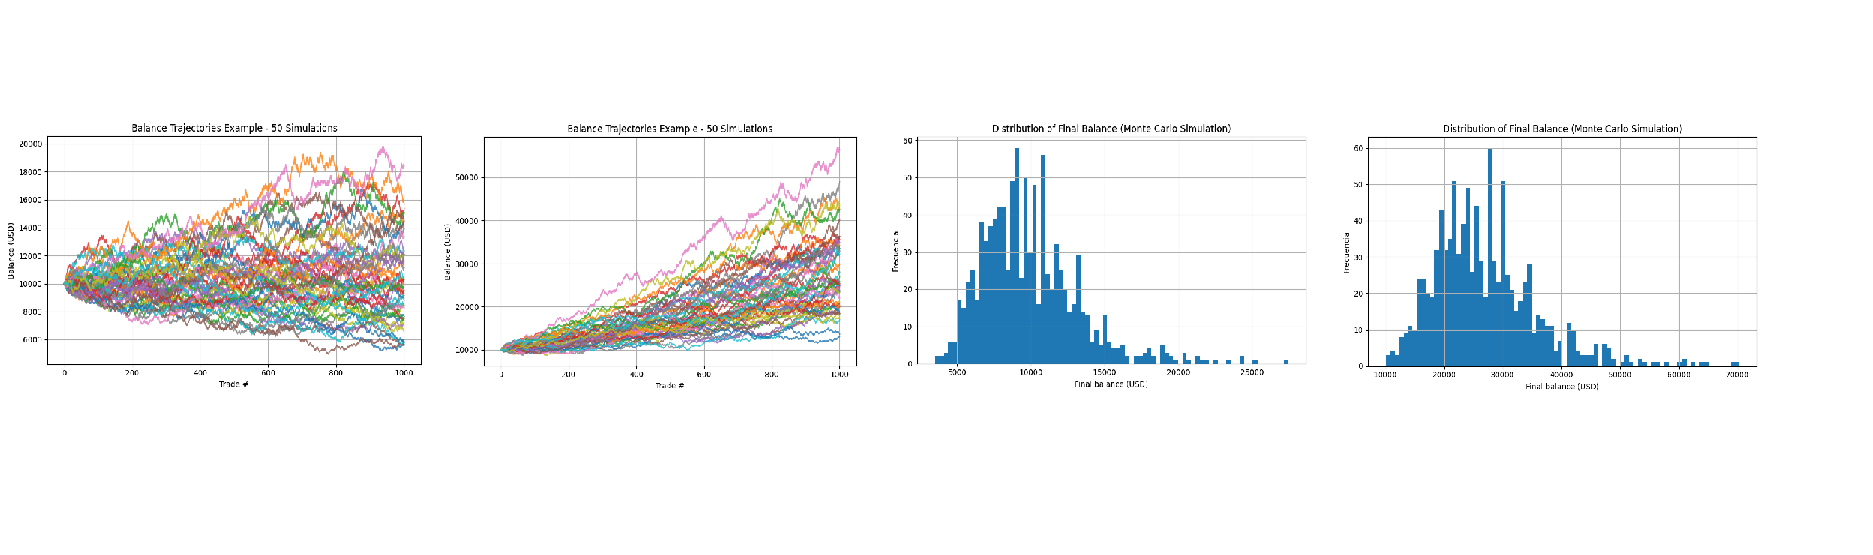
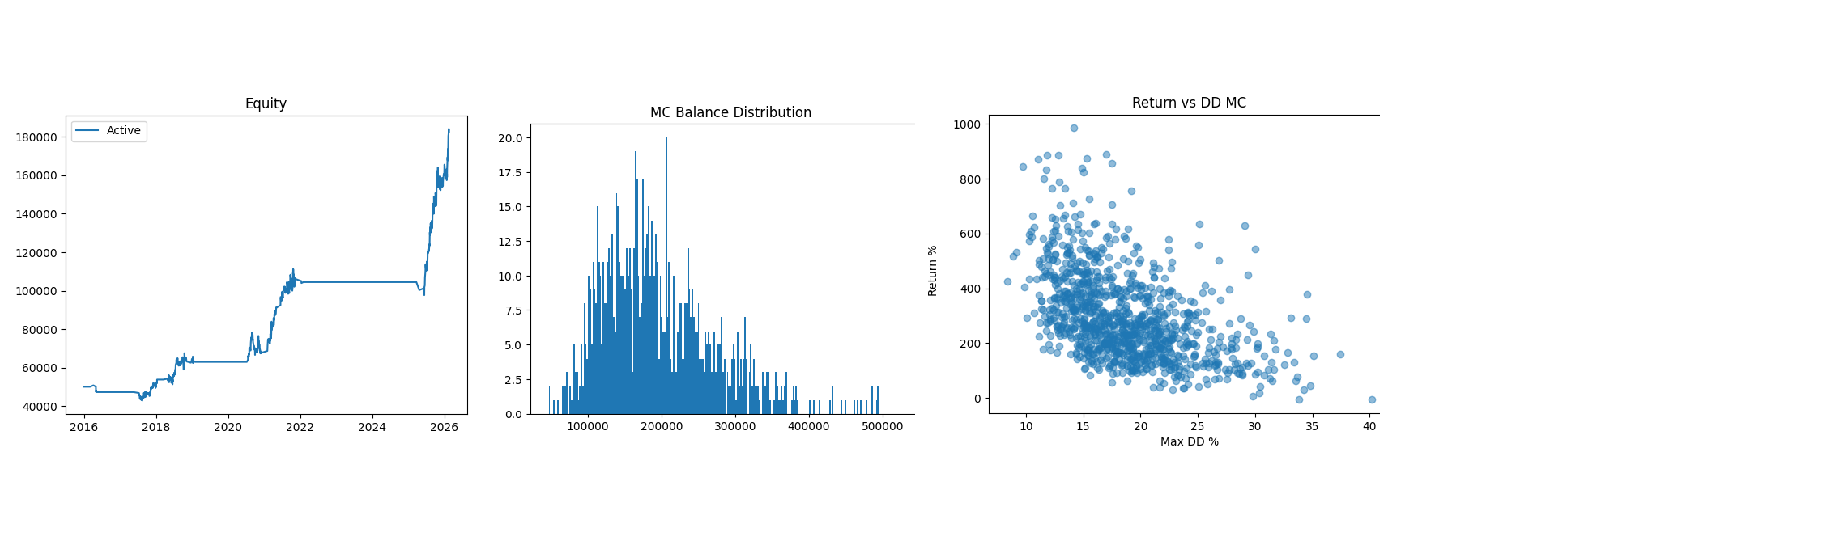
My work is centered on range-based and regime-aware automated systems, designed with an emphasis on capital preservation, statistical consistency, and long-term survivability in live market conditions.
I prioritize selective execution, controlled risk exposure, and conservative design over high-frequency or aggressive approaches. All systems are built using transparent logic, strict safety filters, and extensive historical evaluation across different market regimes.
Support, clarity, and continuous refinement are core principles behind every release.
好友
通过他们的个人资料或用户搜索添加好友,您将能够看到他们是否在线