Daying Cao / Perfil
- Información
|
9+ años
experiencia
|
122
productos
|
54
versiones demo
|
|
0
trabajos
|
0
señales
|
0
suscriptores
|
Ahora aplicaremos la estrategia de juego al futuro de cada moneda, en lugar de las cartas históricas de precios.Es un nivel más alto.La teoría de los Juegos dinámicos de mercado es un rasgo característico de un indicador avanzado de la salud monetaria, que no se encuentra en ningún otro medidor monetario.Es una función muy singular.La estrategia de juegos dinámicos de mercado de los bastidores de salud se basa en la actividad del mercado en su conjunto (35 pares).
Este EA puede modificar las pérdidas futuras mediante mis algoritmos matemáticos.
DYJ trading products - se especializa en el desarrollo innovador de software multi-moneda en el ámbito de la negociación para sus propias necesidades, así como en la aplicación de los objetivos de los clientes corporativos.
Puede encontrar más información aquí: https://www.mql5.com/en/users/cdymql4 o https://www.mql5.com/zh/users/cdymql4
Estimados usuarios, Todos nuestros productos pagados están disponibles para compra y alquiler.
DYJ RiseTrading MT4: https://www.mql5.com/es/market/product/25237
StrongCurrency MT4: https://www.mql5.com/es/market/product/23311, o https://www.mql5.com/zh/market/product/23311
StrongCurrency MT5: https://www.mql5.com/es/market/product/24025, o https://www.mql5.com/zh/market/product/24025
PowerSignal MT4: https://www.mql5.com/es/market/product/24448#description, o https://www.mql5.com/zh/market/product/24448#description
PowerSignal MT5: https://www.mql5.com/es/market/product/24915, o https://www.mql5.com/zh/market/product/24915
SoarSignal MT4: https://www.mql5.com/es/market/product/22459#description, or https://www.mql5.com/zh/market/product/22459#description
SoarSignal MT5: https://www.mql5.com/es/market/product/24638, o https://www.mql5.com/zh/market/product/24638
DYJ TwoMACrossAlarm MT4: https://www.mql5.com/es/market/product/25213, o DYJ TwoMACrossAlarm
QuickClose MT4: https://www.mql5.com/es/market/product/22425#description, o https://www.mql5.com/zh/market/product/22425#description
El EA DYJ TrendPending rastrea el nuevo cambio de precio del par de divisas y abre operaciones en caso de un precio bajo y alto del movimiento principal en la dirección de la tendencia. Así EA utiliza la rejilla de menor riesgo y Añadir lotes. Y puede adjuntar una orden pendiente positiva e inversa. Las órdenes PositivePending pueden reducir el número de rejillas y Add lots, mientras que las órdenes ReversePending reducen la pérdida de órdenes . Para una búsqueda más conveniente, el marco de
Este StrongCurrency es un sistema de comercio completo basado en una variedad de indicadores técnicos, medias móviles y pivotes. Cada uno de esos elementos puede ser evaluado en reglas y coeficientes definidos (dependiendo del indicador) proporcionando escenarios de optimización ilimitados para el StrongCurrency. Para funcionar, StrongCurrency crea una lista de señales de fuerza de tendencia y punto de entrada mediante la evaluación de estos datos, que toma datos de todos los símbolos. Extrapola
El DYJ MacdSto es una herramienta de negociación única de alta calidad y fácil de usar y asequible porque hemos incorporado una serie de características propias e indicadores MACD y Estocástico y RSI y ADX. Las principales ventajas de la estrategia de negociación de tendencia utilizada por el Asesor Experto son la apertura de posiciones sólo en la dirección de una tendencia, la capacidad para la retención a largo plazo de posiciones rentables que permiten a los usuarios lograr buenas
El EA DYJ MacdSto utiliza los indicadores MACD y Estocástico para encontrar señales. Las señales para comprar se generan si la línea MACD cruza por encima de la línea de SEÑAL en el área negativa por debajo del nivel de apertura MACD, y cuando el Estocástico ha cruzado la zonaComprar hacia abajo, ha alcanzado la zonaComprar y luego ha vuelto a cruzar hacia arriba a través de la sobreventa. Las señales de venta se generan si la línea MACD cruza por debajo de la línea de SEÑAL en la zona positiva
El DYJBands abre y cierra posiciones utilizando las señales de las Bandas de Bollinger: Realiza operaciones tras un rebote del precio desde los límites del indicador. Tiene la opción de cerrar posiciones por una señal opuesta, por take profit y stop loss, mover una operación a breakeven al alcanzar la banda central de Bollinger o después de un cierto movimiento del precio. Por defecto, el EA está configurado para operar con el par de divisas GBPUSD en el marco temporal H1. Además, los ajustes
El DYJBands abre y cierra posiciones utilizando las señales de las Bandas de Bollinger: Realiza operaciones tras un rebote del precio desde los límites del indicador. Tiene la opción de cerrar posiciones por una señal opuesta, por take profit y stop loss, mover una operación a breakeven al alcanzar la banda central de Bollinger o después de un cierto movimiento del precio. Por defecto, el EA está configurado para operar con el par de divisas GBPUSD en el marco temporal H1. Además, la
Este QuickClose le ayuda a cerrar todas las órdenes que tienen beneficios inmediatamente con sólo UN CLIC, su trabajo es muy rápido. Usted puede elegir el símbolo que desea o cerrar todos los símbolos por lo que será útil para usted en su comercio para gestionar el comercio más rápido. Este EA puede cerrar rápidamente todas las órdenes de compra y venta por un símbolo seleccionado o total, y eliminar todas las órdenes pendientes. Este SymbolButton está diseñado para cerrar órdenes. Hay
DYJ TRENDWAVE cuenta con un algoritmo avanzado que detecta nuevas tendencias y continuaciones de tendencias actuales para su uso como estrategia de entrada. La volatilidad de DYJ TRENDWAVE se basa en el poder de compradores y vendedores, toma el tamaño del cuerpo total de las velas e identifica la batalla entre compradores y vendedores como un porcentaje del volumen total, como Vendedores: (-)100% y Compradores: (+)100%. Esta información se puede utilizar para cualquier estrategia de entrada y
DYJTRENDWAVE cuenta con un algoritmo avanzado que detecta nuevas tendencias y continuaciones de tendencias actuales para su uso como estrategia de entrada. La volatilidad de DYJTRENDWAVE se basa en el poder de compradores y vendedores, toma el tamaño del cuerpo total de las velas e identifica la batalla entre compradores y vendedores como un porcentaje del volumen total, como Vendedores: (-)100% y Compradores: (+)100%. Esta información se puede utilizar para cualquier estrategia de entrada y
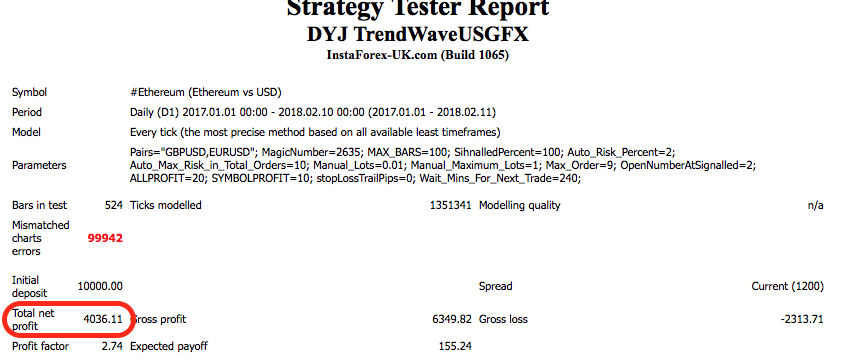
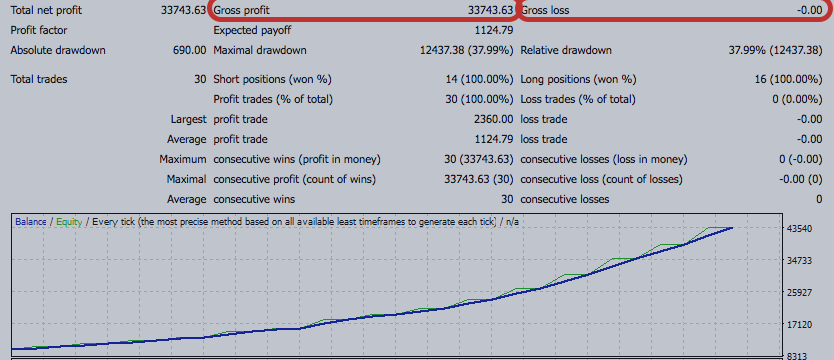
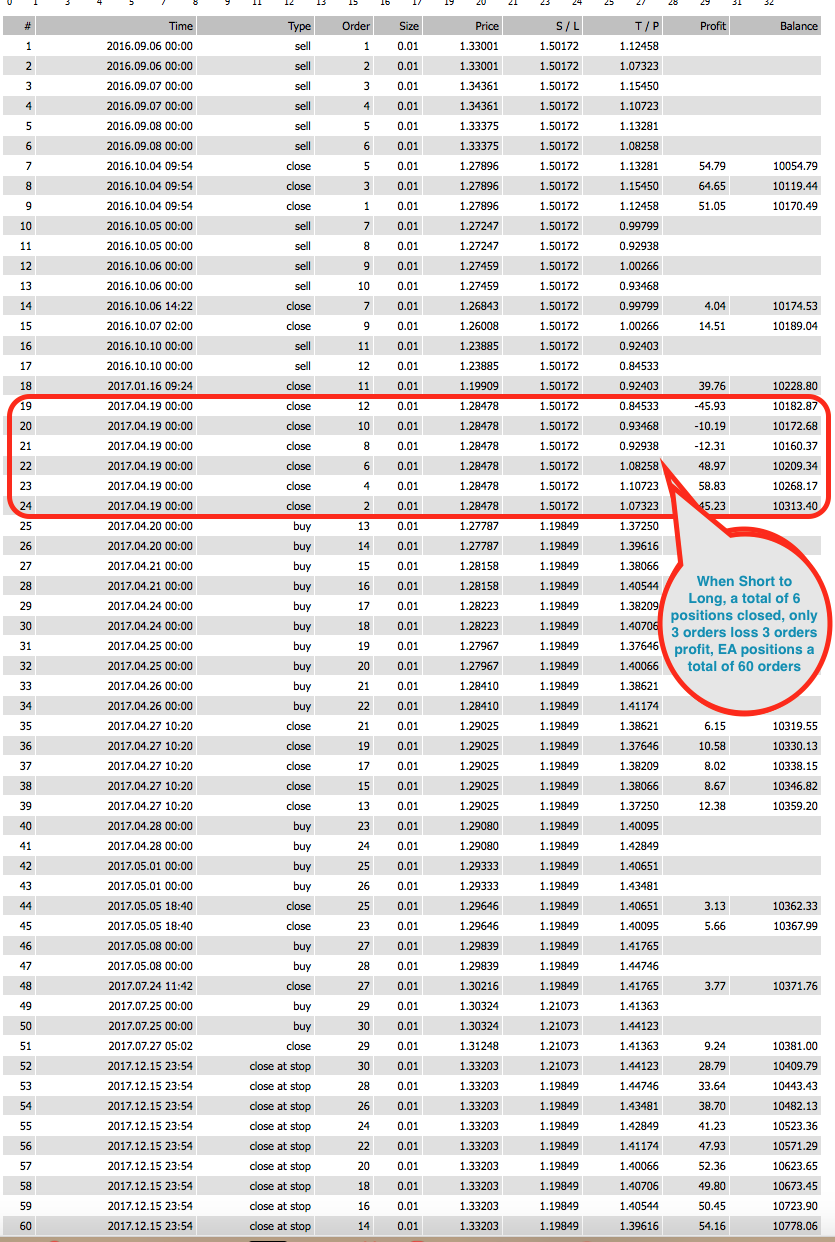
EURUSD the real test back two years of 10,000 US dollars profit 33738.39 dollars
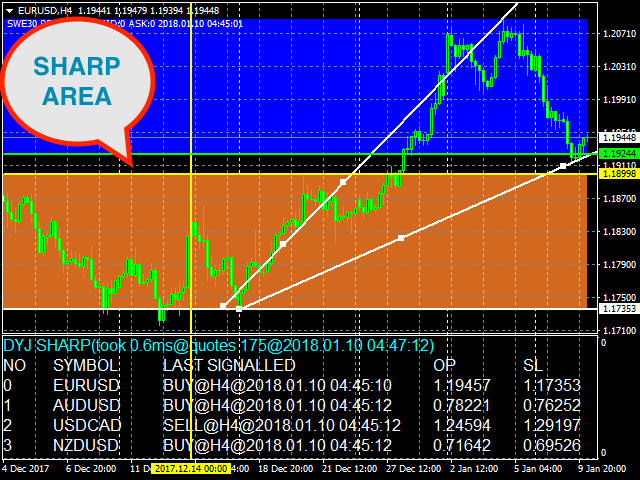
DYJ Sharp algoritmo avanzado que detecta las nuevas tendencias y las continuaciones de las tendencias actuales para su uso como una estrategia de entrada y salida. La estrategia muestra el área de demarcación de tendencia SHARP. Esta zona SHARP tiene una HighLine alta y una LowLine baja. La caída del máximo por debajo de HighLine de SHARP y luego la caída del cierre por debajo de LowLine de SHARP puede interpretarse como una señal de venta. La subida del cierre por encima de HighLine de SHARP y
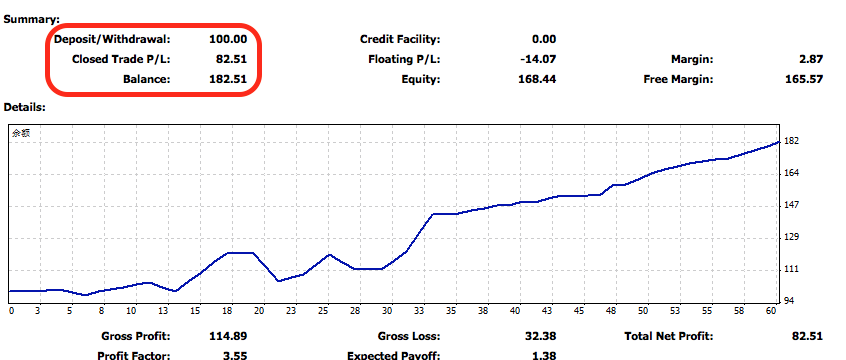

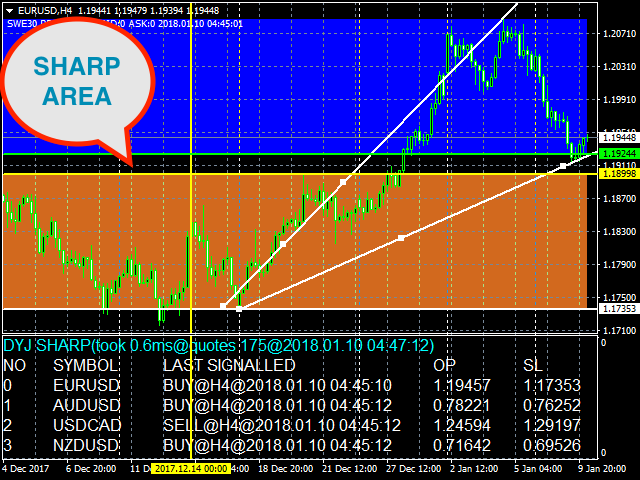
DYJ Sharp algoritmo avanzado que detecta las nuevas tendencias y las continuaciones de las tendencias actuales para su uso como una estrategia de entrada y salida. La estrategia muestra el área de demarcación de tendencia SHARP. Esta zona SHARP tiene una HighLine alta y una LowLine baja. La caída del máximo por debajo de HighLine de SHARP y luego la caída del cierre por debajo de LowLine de SHARP puede interpretarse como una señal de venta. La subida del cierre por encima de HighLine de SHARP y
The strategy display the SHARP trend demarcation area.This SHARP area has high HighLine and low LowLine.
Falling of high below HighLine of SHARP and then falling of close below LowLine of SHARP can be interpreted as a signal to sell.
Rising of close above HighLine of SHARP and then rising of low above LowLine of SHARP can be interpreted as a signal to buy.
The signal for each currency pair is shown in the LAST SIGNALLED field.
MT4, email and push alerts can be enabled.
