• Información general
  • Comentarios (23)
  • Discusión (77)
  • Novedades

Market Structure Patterns

4.44

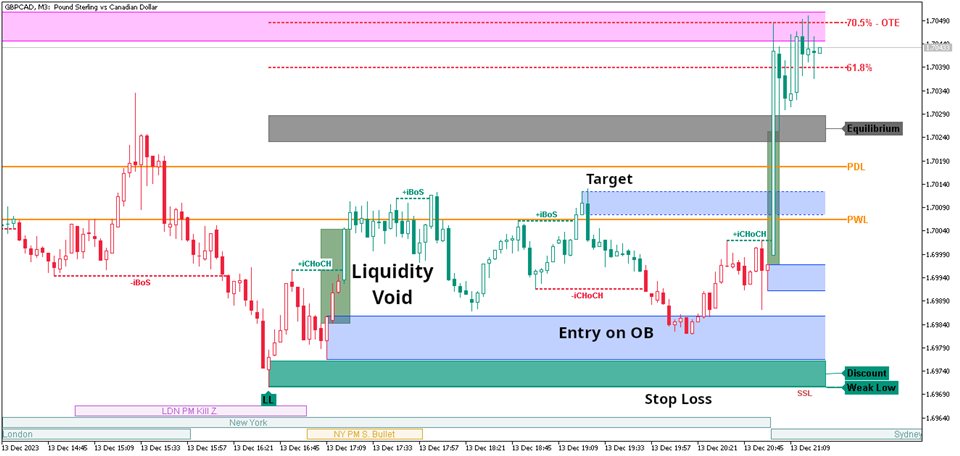
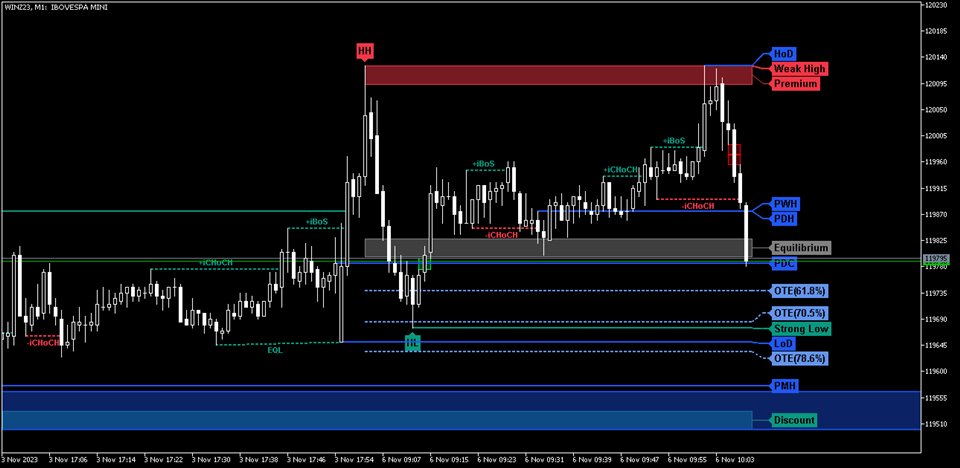
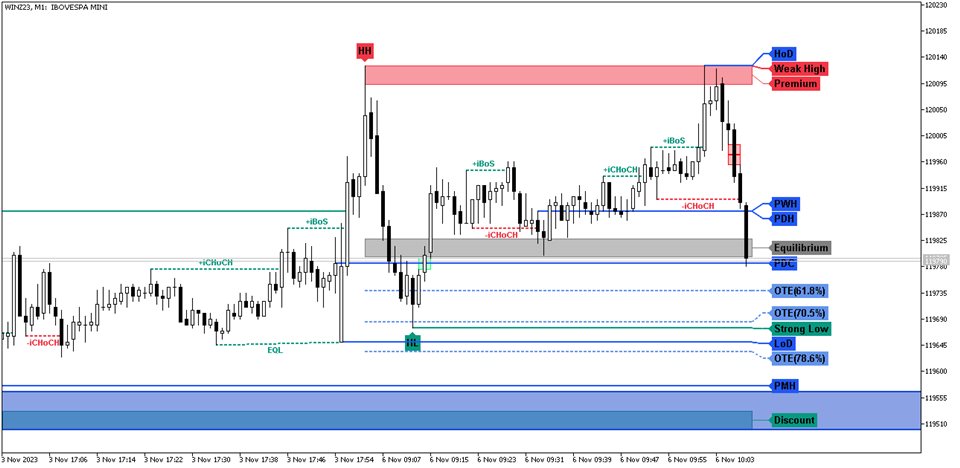
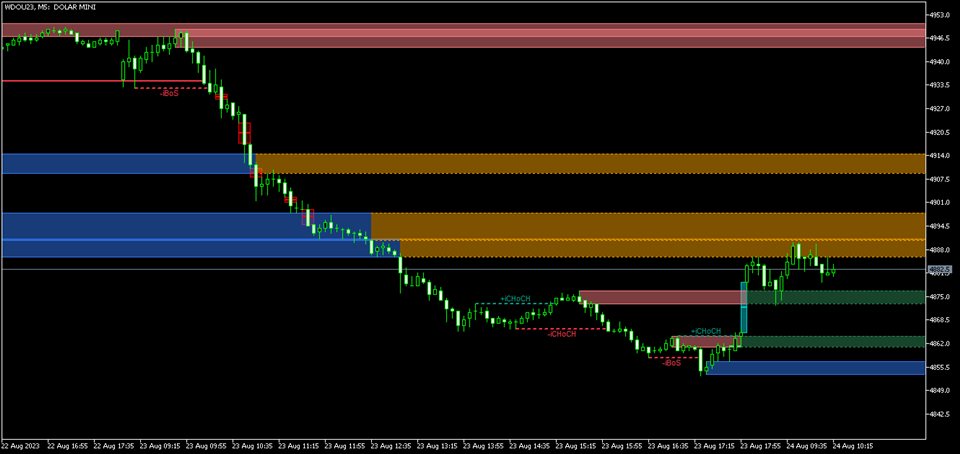
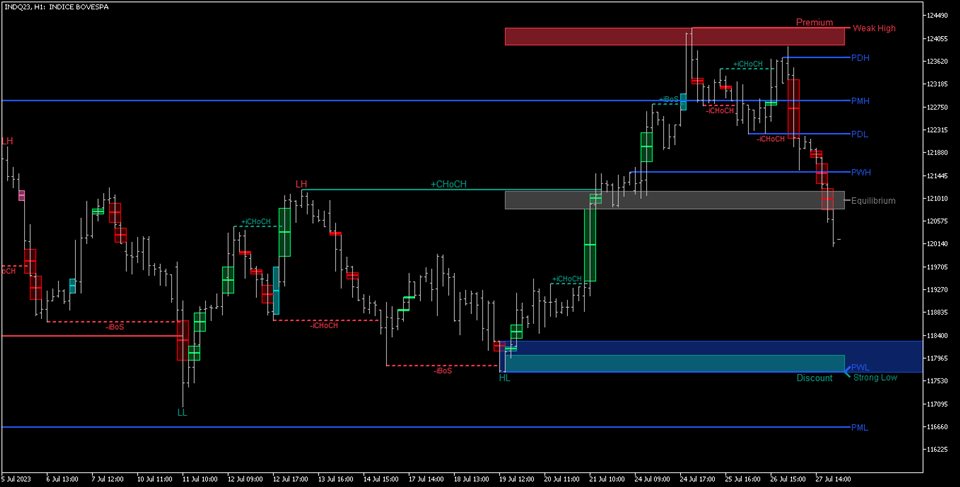
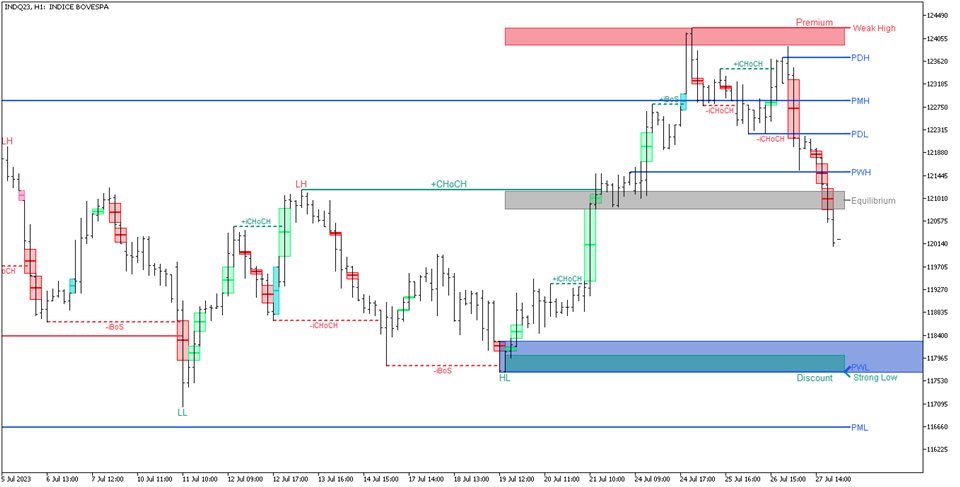
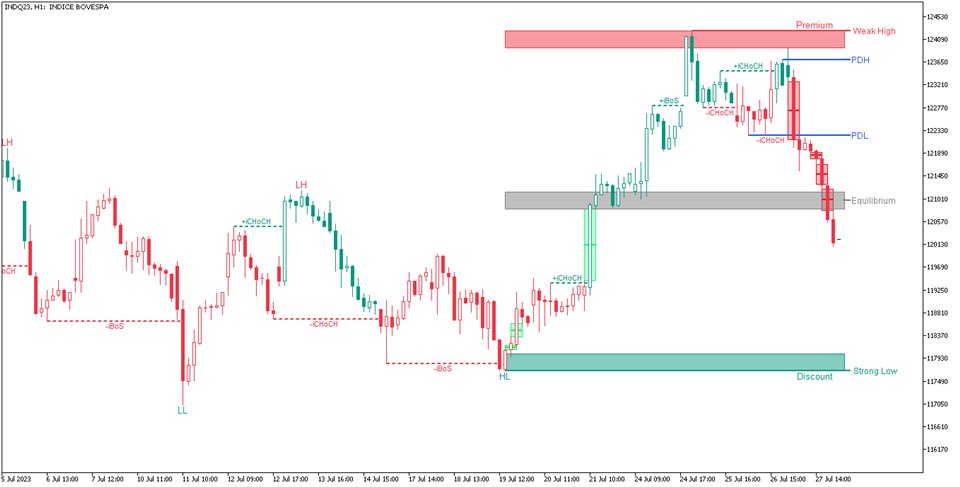
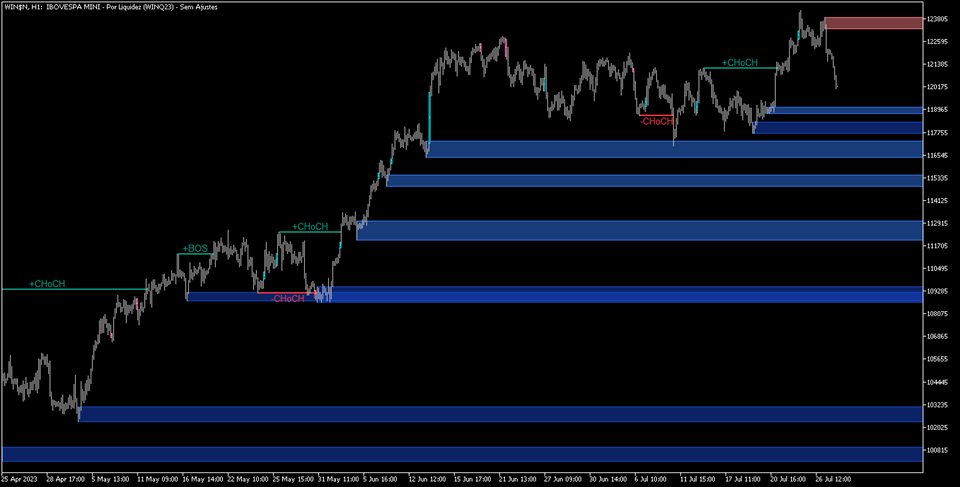
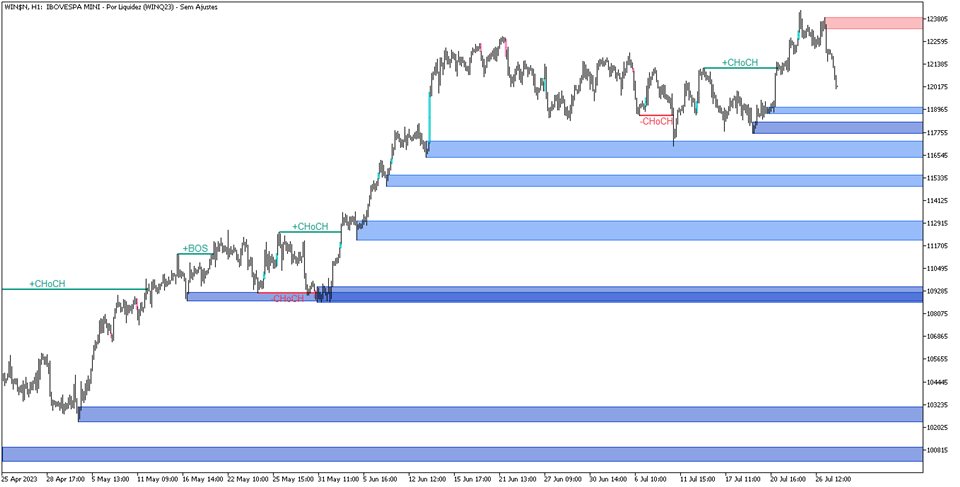
Market Structure Patterns is an indicator based on smart money concepts that displays SMC/ICT elements that can take your trading decisions to the next level. Take advantage of the alerts, push notifications and email messages to keep informed from when an element is formed on the chart, the price crosses a level and/or enters in a box/zone. Developers can access the values of the elements of the indicator using the global variables what allows the automation of trading decisions based on SMC/ICT strategies.

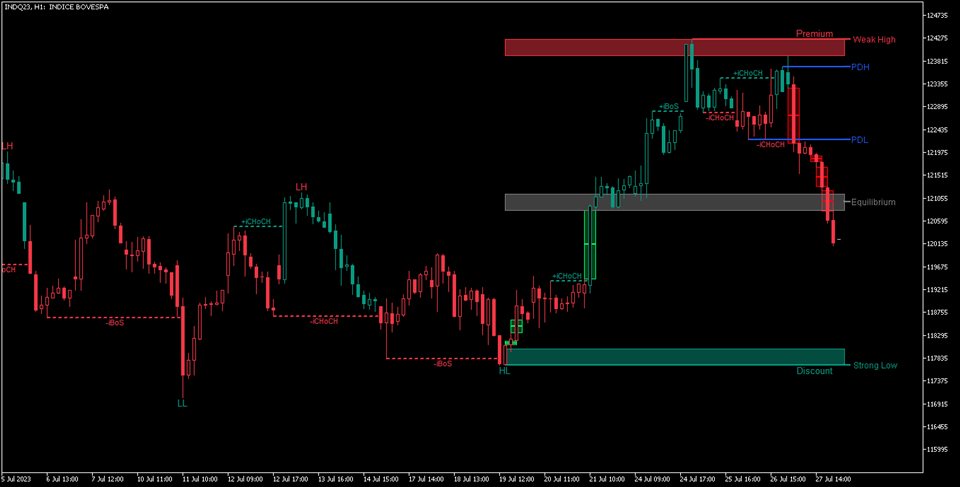
Thinking on high level of customization, the indicator allows to customaze the color and transparency of the element, display the labels using bubble style, display the sessions/trading windows in the bottom of the chart or over the price chart, has an exclusive algorithm to avoid labels/text overlappingpaints the candlesticks depending on the trend and/or internal and swing trend alignment. This feature can be enabled in the parameter "Color Candles". By default the trend is show as green for bullish trend and red for bearish trend. Among with the trend the candlesticks can be filled or not giving the hability to recognize bullish and bearish candlesticks.

Elements and/or Abreviations:

The elements present in the indicator are listed down with their abreviations when applied:

  • Premium, Equilibrium and Discount zones
  • Strong/Weak High/Low
  • Automatic Fibonacci
  • OTE - Optimal Trade Entry
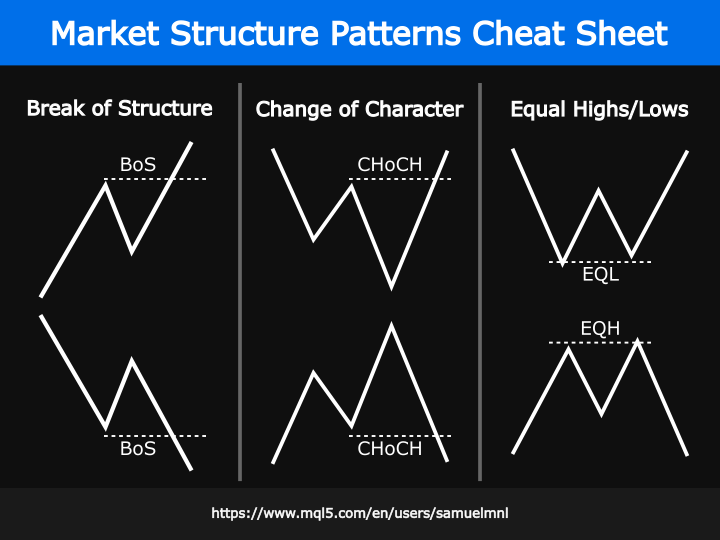
  • HH, HL, LH, LL- Higher highs, higher lows, lower highs and lower lows
  • EQH, EQL - Equal highs and Equal lows
  • BSL, SSL - Buy Stops Liquidity and Sell Stops Liquidity
  • EQH-BSL, EQL-SSL - Buy Stops Liquidity on Equal Highs and Sell Stops Liquidity on Equal Lows
  • BoS, iBoS - Break of structures and Internal Break of Structure
  • CHoCH, iCHoCH - Change of character and Internal Change of Character
  • OB, iOB - Order Blocks and  Internal Order Blocks
  • BB, iBB - Breaker Blocks and Internal Breaker Blocks
  • Liquidity voids
  • FVG - Fair Value Gap
  • InvFVG - Inverse  Fair Value Gap
  • ImpFVG - Implied Fair Value Gap
  • OG - New Day Opening Gap
  • HoD, LoD, OoD - High of the day, Low of the day and Open of the day
  • PDH, PDL, PDO, PDC - Prior day high, low, open and close
  • PWH, PWL , PWO, PWC - Prior week high , low, open and close
  • PMH, PML , PMO, PMC - Prior month high , low, open and close
  • Sessions, Kill Zones and Silver Bullet  Trading Window

Global Variables:

The access to order blocks and structure breaks values through global variables can be made using the names conventions as follow:

// The timeframe to get the data
string timeframe = StringSubstr(EnumToString(_Period), StringLen("PERIOD_"));
string prefix = "SMP-"+_Symbol+"("+timeframe+")", for example "SMP-EURUSD(H4)";

// For bullish order blocks (for bearish just replace 'Bullish' by 'Bearish')
// Add "Bullish-IOB" for internal nullish order blocks or "Bullish-OB" for swing bullish order blocks;
// Add "-Total to get the amount of order blocks on the charts;"
int bullish_iob_total = GlobalVariableGet(prefix+"Bullish-IOB-Total")

// use for loop to get all the values
for(int i=0;i<bullish_iob_total;i++)
{
        // Add "[index]-Top" and/or "[index]-Bot" to get the order blocks values.
        double iob_top = GlobalVariableGet(prefix+"Bullish-IOB["+(string)i+"]-Top");
        double iob_top = GlobalVariableGet(prefix+"Bullish-IOB["+(string)i+"]-Bot");
}

// For structure breaks:
// Add the pattern name as displayed on the chart. For example, +iCHoCH can be accessed by "SMP-EURUSD(H4)-+iCHoCH"

// For Premium/Equilibrium/Discount:
// Add the pattern name followed by the desired level. For example, Premium-Top and Premium-Bot can be accessed respectively by "SMP-EURUSD(H4)-Premium-Top" and "SMP-EURUSD(H4)-Premium-Bot"


The access to the indicator data by buffers indexes was introduced in the version 3.24. The data available is mapped as follow:

Buffer index Data stored in the buffer
0 Internal Top Price
1 Internal Bottom Price
2 Internal Bull Bos
3 Internal Bear Bos
4 Internal Bull Choch
5 Internal Bear Choch
6 Internal Bull Order Block Top
7 Internal Bull Order Block Bottom
8 Internal Bear Order Block Top
9 Internal Bear Order Block Bottom
10 Internal Bull Breaker Block Top
11 Internal Bull Breaker Block Bottom
12 Internal Bear Breaker Block Top
13 Internal Bear Breaker Block Bottom
14 Swing Top Price
15 Swing Bottom Price
16 Swing Bull Bos
17 Swing Bear Bos
18 Swing Bull Choch
19 Swing Bear Choch
20 Swing Bull Order Block Top
21 Swing Bull Order Block Bottom
22 Swing Bear Order Block Top
23 Swing Bear Order Block Bottom
24 Swing Bull Breaker Block Top
25 Swing Bull Breaker Block Bottom
26 Swing Bear Breaker Block Top
27 Swing Bear Breaker Block Bottom
28 BSL Taken
29 SSL Taken
30 EQH Price1
31 EQH Price2
32 EQL Price1
33 EQL Price2
34 Premium Top
35 Premium Bottom
36 Equilibrium Top
37 Equilibrium Bottom
38 Discount Top
39 Discount Bottom
40 Strong High
41 Weak High
42 Strong Low
43 Weak Low
44 Bull FVG Top
45 Bull FVG Bottom
46 Bear FVG Top
47 Bear FVG Bottom
48 Bull Inverse FVG Top
49 Bull Inverse FVG Bottom
50 Bear Inverse FVG Top
51 Bear Inverse FVG Bottom
52 Bull Implied FVG Top
53 Bull Implied FVG Bottom
54 Bear Implied FVG Top
55 Bear Implied FVG Bottom
56 Bull Liquidity Void Top
57 Bull Liquidity Void Bottom
58 Bear Liquidity Void Top
59 Bear Liquidity Void Bottom


Join the Market Structure Patterns channel to download materials available for study and/or additional informations.

Comentarios 23
Aruncharan Ganapathy Sivakumar
218
Aruncharan Ganapathy Sivakumar 2024.08.18 00:56 
 

As Greg Nicolas said confirmation arrow gives confidence if added... Thank you author for your dedication

Greg Nicolas
93
Greg Nicolas 2024.05.25 00:28 
 

The Indicator is a top notch but It really took me time to understand it.however, disabling those sessions and OTE which gives direction somehow late and adding a confirmation arrow really makes the difference for me. Kudos to Samuel for a great Job and five star. I have both MT4 & MT5 on fire with Synthetic

pfidelus
132
pfidelus 2024.04.23 13:07 
 

I have tested over 100 different indicators for MT5 and MT4, and I must say that this one is in the top 5 of my favorite indicators. I am able to see everything very clearly, including all key levels, which is amazing for my strategy. I highly recommend this indicator; it has everything you need to make consistent profits. I don't usually write reviews for indicators, but I had to for this one because I found it very useful and helpful.

Productos recomendados
Owl Smart Levels MT5
Sergey Ermolov
4.07 (28)
Versión MT4  |  FAQ El Indicador Owl Smart Levels es un sistema comercial completo dentro de un indicador que incluye herramientas de análisis de mercado tan populares como los fractales avanzados de Bill Williams , Valable ZigZag que construye la estructura de onda correcta del mercado y los niveles de Fibonacci que marcan los niveles exactos de entrada. en el mercado y lugares para tomar ganancias. Descripción detallada de la estrategia Instrucciones para trabajar con el indicador Asesor de c
STRICTLY FOR BOOM INDEX ONLY!!!!! Here I bring the Maximum Trend Arrows OT1.0 MT5 indicator. This indicator is made up of a combination of different trend indicators for entries and exits, for entries an orange arrow will paint on the chart below the current market and a red flag for closing of trades and it produces buy arrows only. When the orange arrow appears, it will appear along with it's sound to notify you. The 1H timeframe is recommended, don't use it anywhere else than on the 1H timefr
Cumulative delta indicator As most traders believe, the price moves under the pressure of market buying or selling. When someone redeems an offer standing in the cup, the deal is a "buy". If someone pours into the bid standing in the cup - the deal goes with the direction of "sale". The delta is the difference between purchases and sales. A cumulative delta - the difference between the cumulative sum of purchases and sales for a certain period of time. It allows you to see who is currently contr
Renko Gold
Ignacio Agustin Mene Franco
Renko Gold !  indica clara mente los pisos y techos donde va de 4 lineas ,  la linea de abajo que marca el piso en color verde confirmando con la linea mas fina aclara la entrada en compra ,  lo mismo es para la venta , la linea de arriba marca el techo y la mas fina de color  rojo marca la venta ,  este indicador sirve para todas las temporalidades !  Para los mercados de Forex y Indices sinteticos ! Tambien sirve para los mercados de crypto !  Buen Profit! World Inversor. 
The Penta-O is a 6-point retracement harmonacci pattern which usually precedes big market movements. Penta-O patterns can expand and repaint quite a bit. To make things easier this indicator implements a twist: it waits for a donchian breakout in the right direction before signaling the trade. The end result is an otherwise repainting indicator with a very reliable trading signal. The donchian breakout period is entered as an input. [ Installation Guide | Update Guide | Troubleshooting | FAQ | A
Noize Absorption Index - is the manual trading system that measures the difference of pressure between bears forces and bulls forces. Green line - is a noize free index that showing curent situation. Zero value of index shows totally choppy/flat market.Values above zero level shows how powerfull bullish wave is and values below zero measures bearish forces.Up arrow appears on bearish market when it's ready to reverse, dn arrow appears on weak bullish market, as a result of reverse expectation.
An indicator of pattern #31 ("Long Island") from Encyclopedia of Chart Patterns by Thomas N. Bulkowski. The second gap is in the opposite direction. Parameters: Alerts - show alert when an arrow appears   Push - send a push notification when an arrow appears (requires configuration in the terminal) GapSize - minimum gap size in points ArrowType - a symbol from 1 to 17 ArrowVShift - vertical shift of arrows in points   ShowLevels - show levels ColUp - color of an upward line ColDn - color of a d
The Accumulation / Distribution is an indicator which was essentially designed to measure underlying supply and demand. It accomplishes this by trying to determine whether traders are actually accumulating (buying) or distributing (selling). This indicator should be more accurate than other default MT5 AD indicator for measuring buy/sell pressure by volume, identifying trend change through divergence and calculating Accumulation/Distribution (A/D) level. Application: - Buy/sell pressure: above
Flow Bookmap
Thalles Nascimento De Carvalho
Flow Bookmap: Visualiza el Flujo de Mercado y Protege tus Operaciones ️ ¿QUIERES DOMINAR EL MERCADO CON INFORMACIÓN PRECISA SOBRE COMPRADORES Y VENDEDORES? Flow Bookmap es la herramienta definitiva para traders que buscan entender el comportamiento del mercado en profundidad. Transforma los datos del flujo de órdenes en una interfaz intuitiva en el gráfico de MT5, destacando áreas de interés crítico para tomar decisiones rápidas y seguras. ¿Cómo Funciona? Flow Bookmap interpreta la int
Description:  First of all Its worth emphasizing here that the Trend Breakout Catcher is  Non-Repainting,  Non-Redrawing    and  Non-Lagging  Indicator, Which makes it ideal from both manual and robot trading. The Trend Breakout Catcher Indicator employs a sophisticated algorithm designed to predict trends early and generate timely Buy and Sell signals at the onset of a breakout. Utilizing a smart calculation based on numerous elements, the indicator forms a robust and redundant system to detec
Magic Finger can help you identify trends and trading opportunities clearly. The finger points to the open position signal, and the discoloration line is confirmed by the trend. If you are a day trader, you can choose to trade during a period of active trading, referring to the discoloration line as the basis for the next order, finger signal as a filter. If you are a trend trader, you can choose a period above H1, wait for the appearance of the finger signal in the key price area, and enter th
Double HMA MTF for MT5
Pavel Zamoshnikov
4 (4)
This is an advanced multi-timeframe version of the popular Hull Moving Average (HMA) Features Two lines of the Hull indicator of different timeframes on the same chart. The HMA line of the higher timeframe defines the trend, and the HMA line of the current timeframe defines the short-term price movements. A graphical panel with HMA indicator data from all timeframes at the same time . If the HMA switched its direction on any timeframe, the panel displays a question or exclamation mark with a tex
Terra Infinity is a flat indicator. This improved version of the CalcFlat indicator has three additional lines that significantly increase its effectiveness. Unlike its predecessor with two static levels, Terra Infinity adds three dynamic lines above the main histogram, which are interpreted as follows: base signal line, minimum signal line, maximum signal line. These lines are formed using the additional parameter Avg, which is the average value of the histogram. Averaging produces a line cl
PipFinite Trend PRO MT5
Karlo Wilson Vendiola
4.84 (549)
Breakthrough Solution For Trend Trading And Filtering With All Important Features Built Inside One Tool! Trend PRO's smart algorithm detects the trend, filters out market noise and gives entry signals with exit levels. The new features with enhanced rules for statistical calculation improved the overall performance of this indicator. Important Information Revealed Maximize the potential of Trend Pro, please visit www.mql5.com/en/blogs/post/713938 The Powerful Expert Advisor Version Automatin
Atomic Analyst MT5
Issam Kassas
4.32 (19)
En primer lugar, vale la pena enfatizar que este Indicador de Trading no repinta, no redibuja y no se retrasa, lo que lo hace ideal tanto para el trading manual como para el automatizado. Manual del usuario: configuraciones, entradas y estrategia. El Analista Atómico es un Indicador de Acción del Precio PA que utiliza la fuerza y el impulso del precio para encontrar una mejor ventaja en el mercado. Equipado con filtros avanzados que ayudan a eliminar ruidos y señales falsas, y aumentan el poten
SolarTrade Suite Financial Indicator: Jupiter Market Indicator - ¡Su guía confiable en el mundo de los mercados financieros! Este es un indicador de tendencia que utiliza algoritmos especiales innovadores y avanzados para calcular su valor, y también tiene un diseño agradable a la vista. Es muy fácil entender las lecturas de este indicador: color azul - compra, rojo - venta. Vea nuestros otros productos de la serie SolarTrade Suite en la parte inferior de la descripción. ¿Quiere navegar con
Trend Master Chart MT5
Frederic Jacques Collomb
Trend Master Chart es el indicador de tendencia que necesita. Se superpone al gráfico y utiliza códigos de colores para definir diferentes tendencias/movimientos del mercado. Utiliza un algoritmo que combina dos medias móviles y diferentes osciladores. Los periodos de estos tres elementos son modificables. Funciona en cualquier período de tiempo y en cualquier par. De un vistazo podrás identificar una tendencia alcista o bajista y los diferentes puntos de entrada a esta tendencia. Por ejemplo,
Your Trend Friend
Luigi Nunes Labigalini
5 (1)
The trend is your friend! Look at the color of the indicator and trade on that direction. It does not  repaint. After each candle is closed, that's the color of the trend. You can focus on shorter faster trends or major trends, just test what's most suitable for the symbol and timeframe you trade. Simply change the "Length" parameter and the indicator will automatically adapt. You can also change the color, thickness and style of the lines. Download and give it a try! There are big movements w
Golden Spike Premium
Kwaku Bondzie Ghartey
Golden Spikes Detector Acknowledgement and Dedications:  The name of this indicator was Inspired by an Original; Mr Grant Koopman; a Knowledgeable and experienced Synthetics trader. I dedicate this indicator to Mr Grant.  Overview:   The Golden Spikes Premium is a groundbreaking trading indicator meticulously crafted for the Boom and Crash indices on the Deriv market. Tailored to meet the needs of discerning traders, this powerful tool operates exclusively on the one-minute timeframe, providing
Este es un indicador MTF de niveles de soporte y resistencia basado en los   extremos del indicador Advanced ZigZag Dynamic   y / o   Extended Fractals   con etiquetas de precio (se puede deshabilitar). Se pueden seleccionar TF más altos para el modo MTF. De forma predeterminada, los niveles se generan en función de los puntos indicadores de ZigZag. Los puntos indicadores de fractales también se pueden usar junto con ZigZag o en su lugar. Para simplificar el uso y ahorrar tiempo de CPU, el cálcu
Renko System
Marco Montemari
This indicator can be considered as a trading system. It offers a different view to see the currency pair: full timeless indicator, can be used for manual trading or for automatized trading with some expert advisor. When the price reaches a threshold a new block is created according to the set mode. The indicator beside the Renko bars, shows also 3 moving averages. Features renko mode median renko custom median renko 3 moving averages wicks datetime indicator for each block custom notification
Was: $249  Now: $149   Market Profile defines a number of day types that can help the trader to determine market behaviour. A key feature is the Value Area, representing the range of price action where 70% of trading took place. Understanding the Value Area can give traders valuable insight into market direction and establish the higher odds trade. It is an excellent addition to any system you may be using. Inspired by Jim Dalton’s book “Mind Over Markets”, this indicator is designed to suit the
Este indicador le mostrará los valores TP y SL (en esa moneda) que ya configuró para cada pedido en los gráficos (cerrados a la línea de transacción/pedido) que lo ayudarán mucho a estimar sus ganancias y pérdidas para cada pedido. Y también te muestra los valores de PIP. el formato que se muestra es "Valores de moneda de nuestros valores de ganancias o pérdidas / PIP". El valor TP se mostrará en color verde y el valor SL se mostrará en color rojo. Para cualquier pregunta o más información, no
Mine Farm is one of the most classic and time-tested scalping strategies based on the breakdown of strong price levels. Mine Farm is the author's modification of the system for determining entry and exit points into the market... Mine Farm - is the combination of great potential with reliability and safety. Why Mine Farm?! - each order has a short dynamic Stop Loss - the advisor does not use any risky methods (averaging, martingale, grid, locking, etc.) - the advisor tries to get the most
Ultimate Divergence Scanner (Multi Pair And Multi Time Frame) :   ---LIMITED TIME OFFER: NEXT 25 CLIENTS ONLY ---46% OFF REGULAR PRICE AND 2 FREE BONUSES ---SEE BELOW FOR FULL DETAILS It is a widely known market principle that momentum generally precedes price.  Making divergence patterns a clear indication that price and momentum are not in agreement.  Divergence patterns are widely used by institutional traders around the world. As they allow you to manage  your trades within strictly defin
Introduction One of the patterns in "RTM" is the "QM" pattern, also known as "Quasimodo". Its name is derived from the appearance of "Hunchback of Notre-Dame" from Victor Hugo's novel. It is a type of "Head and Shoulders" pattern.   Formation Method   Upward Trend In an upward trend, the left shoulder is formed, and the price creates a new peak higher than the left shoulder peak . After a decline, it manages to break the previous low and move upward again. We expect the price to
Golden Spikes Detector
Batsirayi L Marango
3.25 (4)
Golden Spikes Detector Este indicador se basa en una estrategia avanzada principalmente para negociar picos en índices de auge y caída. Se implementaron algoritmos complejos para detectar únicamente entradas de alta probabilidad. Alerta sobre posibles entradas de Compra y Venta. Para negociar picos en el corredor Deriv o Binary, solo acepte las alertas Buy Boom y Sell Cash. Se optimizó para cargarse en un período de tiempo de 5 minutos, aunque se realiza un análisis de múltiples períodos de tiem
Volume Delta Candle
Muhammad Muzaffar Hussan
Volume Delta Candles: A Comprehensive Tool for In-Depth Trading Analysis Unlock a seamless way to interpret trading experience within each candle. With Volume Delta Candles, there's no need for additional volume indicators—everything you need is built in. This advanced tool utilizes lower timeframes or live market data to present the percentage of buying versus selling volume within each candle as an intuitive color-coded bar. Before diving in, ensure you’re familiar with Volume and Volume Delta
How to use Pair Trading Station Pair Trading Station is recommended for H1 time frame and you can use it for any currency pairs. To generate buy and sell signal, follow few steps below to apply Pair Trading Station to your MetaTrader terminal. When you load Pair Trading Station on your chart, Pair Trading station will assess available historical data in your MetaTrader platforms for each currency pair. On your chart, the amount of historical data available will be displayed for each currency pai
Order Book, known also as Market Book, market depth, Level 2, - is a dynamically updated table with current volumes of orders to buy and to sell specific financial instument at price levels near Bid and Ask. MetaTrader 5 provides the means for receiving market book from your broker, but in real time only, without access to its history. The indicator OrderBook Cumulative Indicator accumulates market book data online and visualizes them on the chart. In addition, the indicator can show the market
Los compradores de este producto también adquieren
Trend Screener Pro MT5
STE S.S.COMPANY
4.88 (68)
Desbloquee el poder del comercio de tendencias con el indicador Trend Screener: ¡su solución definitiva para el comercio de tendencias impulsada por lógica difusa y un sistema multidivisa!Mejore su comercio de tendencias con Trend Screener, el revolucionario indicador de tendencias impulsado por lógica difusa. Es un poderoso indicador de seguimiento de tendencias que combina más de 13 herramientas y funciones premium y 3 estrategias comerciales, lo que lo convierte en una opción versátil para co
TPSpro RFI Levels MT5
Roman Podpora
4.71 (17)
INSTRUCCIONES       RUSO   -   ING        Se   recomienda utilizar con un indicador.       -       TPSpro   TENDENCIA PRO -   Versión MT5 Un elemento clave en el trading son las zonas o niveles desde los que se toman las decisiones de compra o venta de un instrumento de trading. A pesar de los intentos de los principales actores de ocultar su presencia en el mercado, inevitablemente dejan rastros. Nuestra tarea era aprender a identificar estos rastros e interpretarlos correctamente. Funciones p
TPSproTREND PrO MT5
Roman Podpora
4.54 (13)
TPSpro TREND PRO  - is a trend indicator that automatically analyzes the market and provides information about the trend and each of its changes, as well as giving signals for entering trades without redrawing! The indicator uses each candle, analyzing them separately. referring to different impulses - up or down impulse. Exact entry points into transactions for currencies, crypto, metals, stocks, indices!  ИНСТРУКЦИЯ RUS         INSTRUCTIONS  ENG       R ecommended to use with an indicator   -
Quantum TrendPulse
Bogdan Ion Puscasu
5 (7)
Presentamos   Quantum TrendPulse   , la herramienta de trading definitiva que combina el poder de   SuperTrend   ,   RSI   y   Stochastic   en un indicador integral para maximizar su potencial de trading. Diseñado para traders que buscan precisión y eficiencia, este indicador le ayuda a identificar tendencias del mercado, cambios de impulso y puntos de entrada y salida óptimos con confianza. Características principales: Integración con SuperTrend:   siga fácilmente la tendencia predominante del
Este es un genial indicador para MT5 que ofrece señales precisas para entrar en una transacción sin redibujar. Se puede aplicar a cualquier activo financiero: fórex, criptomonedas, metales, acciones, índices. Nos dará valoraciones bastante precisas y nos dirá cuándo es mejor abrir y cerra una transacción. Eche un vistazo  al vídeo  (6:22), ¡contiene un ejemplo de procesamiento de una sola señal que ha amortizado el indicador! La mayoría de los tráders mejoran sus resultados comerciales durante l
FX Volume MT5
Daniel Stein
4.93 (14)
FX Volume: Experimente el Verdadero Sentimiento del Mercado desde la Perspectiva de un Bróker Resumen Rápido ¿Desea llevar su estrategia de trading a otro nivel? FX Volume ofrece información en tiempo real sobre cómo los traders minoristas y los brókers están posicionados, mucho antes de que aparezcan informes retrasados como el COT. Ya sea que busque beneficios consistentes o simplemente quiera una ventaja más profunda en los mercados, FX Volume le ayuda a identificar desequilibrios important
Golden Trend Indicator MT5
Noha Mohamed Fathy Younes Badr
4.86 (14)
Golden Trend indicator  is The best indicator for predicting trend movement this indicator never lags and never repaints and never back paints    and give  arrow buy and sell    before the candle appear  and it will help you and  will make your trading decisions clearer its work on all currencies and  gold and crypto and all time frame This unique  indicator uses very secret algorithms to catch the  trends, so you can trade using this indicator and see the trend clear on charts  manual guide and
Ante todo, vale la pena enfatizar que esta Herramienta de Trading es un Indicador No Repintado, No Redibujado y No Retrasado, lo que la hace ideal para el trading profesional. Curso en línea, manual del usuario y demostración. El Indicador de Conceptos de Acción del Precio Inteligente es una herramienta muy potente tanto para traders nuevos como experimentados. Combina más de 20 indicadores útiles en uno solo, combinando ideas avanzadas de trading como el Análisis del Trader del Círculo Interi
FX Levels: Zonas de Soporte y Resistencia con Precisión Excepcional para Todos los Mercados Resumen Rápido ¿Busca una manera confiable de identificar niveles de soporte y resistencia en cualquier mercado — ya sean divisas, índices, acciones o materias primas? FX Levels combina el método tradicional “Lighthouse” con un enfoque dinámico vanguardista, ofreciendo una precisión casi universal. Gracias a nuestra experiencia real con brokers y a las actualizaciones automáticas diarias más las de tiem
Ahora $ 147 (aumentando a $ 499 después de algunas actualizaciones) - Cuentas ilimitadas (PC o Mac) Manual de usuario de RelicusRoad + Videos de capacitación + Acceso al grupo privado de Discord + Estado VIP UNA NUEVA MANERA DE VER EL MERCADO RelicusRoad es el indicador comercial más poderoso del mundo para divisas, futuros, criptomonedas, acciones e índices, y brinda a los comerciantes toda la información y las herramientas que necesitan para mantenerse rentables. Brindamos análisis técnico
FX Dynamic: Lleve su Análisis de Mercado a Otro Nivel con Precisión Adaptativa Resumen Rápido ¿Quiere perfeccionar su ventaja en el trading? FX Dynamic brinda información en tiempo real y se adapta a los movimientos del mercado, reaccionando instantáneamente a cada tick de los datos en vivo de MetaTrader. Ya sea que busque un rendimiento constante o señales más confiables, FX Dynamic le ayuda a encontrar oportunidades clave, afinar sus entradas y salidas, y gestionar el riesgo con mayor precis
Support And Resistance Screener está en un indicador de nivel para MetaTrader que proporciona múltiples herramientas dentro de un indicador. Las herramientas disponibles son: 1. Cribador de estructura de mercado. 2. Zona de retroceso alcista. 3. Zona de retroceso bajista. 4. Puntos pivotes diarios 5. Puntos de pivote semanales 6. Puntos Pivotes mensuales 7. Fuerte soporte y resistencia basado en patrón armónico y volumen. 8. Zonas de nivel de banco. OFERTA POR TIEMPO LIMITADO: El indicador de so
FX Power MT5 NG
Daniel Stein
5 (8)
FX Power: Analiza la Fuerza de las Divisas para Decisiones de Trading Más Inteligentes Descripción General FX Power es tu herramienta esencial para comprender la fuerza real de las principales divisas y el oro en cualquier condición de mercado. Al identificar divisas fuertes para comprar y débiles para vender, FX Power simplifica las decisiones de trading y descubre oportunidades de alta probabilidad. Ya sea que quieras seguir las tendencias o anticipar reversiones utilizando valores extremos
Gold Stuff mt5
Vasiliy Strukov
4.92 (173)
Gold Stuff mt5: un indicador de tendencia diseñado específicamente para el oro, también se puede usar en cualquier instrumento financiero. El indicador no se vuelve a dibujar ni se retrasa. El marco de tiempo recomendado es H1. IMPORTANTE! Póngase en contacto conmigo inmediatamente después de la compra para obtener instrucciones y bonificación!   Puede obtener una copia gratuita de nuestro indicador Strong Support y Trend Scanner, por favor envíe un mensaje privado. ¡a mí! PARÁMETROS Draw Ar
Primero que todo, vale la pena enfatizar que este Sistema de Trading es un Indicador No Repintado, No Redibujado y No Retrasado, lo que lo hace ideal tanto para el trading manual como para el automatizado. Curso en línea, manual y descarga de ajustes preestablecidos. El "Sistema de Trading Inteligente MT5" es una solución completa de trading diseñada para traders nuevos y experimentados. Combina más de 10 indicadores premium y presenta más de 7 estrategias de trading robustas, lo que lo convier
Easy Breakout MT5
Mohamed Hassan
5 (1)
Enjoy a   50% OFF   Christmas holiday sale!   After your purchase, feel free to contact me for more details on how to receive a bonus indicator called VFI, which pairs perfectly with Easy Breakout for enhanced confluence!     Easy Breakout MT5   is a powerful price action trading system built on one of the most popular and widely trusted strategies among traders: the   Breakout strategy ! This indicator delivers crystal-clear Buy and Sell signals based on breakouts from key support and resis
Trend Forecaster
Alexey Minkov
5 (6)
!SPECIAL SALE!  The Trend Forecaster indicator utilizes a unique proprietary algorithm to determine entry points for a breakout trading strategy. The indicator identifies price clusters, analyzes price movement near levels, and provides a signal when the price breaks through a level. The Trend Forecaster indicator is suitable for all financial assets, including currencies (Forex), metals, stocks, indices, and cryptocurrencies. You can also adjust the indicator to work on any time frames, althoug
Gold Trend 5
Sergei Linskii
5 (1)
Tendencia del oro : se trata de un buen indicador técnico bursátil. El algoritmo del indicador analiza el movimiento del precio de un activo y refleja la volatilidad y las posibles zonas de entrada. Las mejores señales del indicador: - Para VENTA = histograma rojo + puntero rojo CORTO + flecha amarilla de señal en la misma dirección. - Para COMPRA = histograma azul + puntero azul LARGO + flecha de señal aqua en la misma dirección. Ventajas del indicador: 1. El indicador produce señales co
Introduciendo       Quantum Breakout PRO   , el innovador indicador MQL5 que está transformando la forma en que comercia con Breakout Zones. Desarrollado por un equipo de comerciantes experimentados con experiencia comercial de más de 13 años,       Desglose cuántico PRO       está diseñado para impulsar su viaje comercial a nuevas alturas con su innovadora y dinámica estrategia de zona de ruptura. El indicador de ruptura cuántica le dará flechas de señal en las zonas de ruptura con 5 zonas ob
Gold Venamax MT5
Sergei Linskii
2.67 (3)
Gold Venamax : este es el mejor indicador técnico de acciones. El algoritmo del indicador analiza el movimiento del precio de un activo y refleja la volatilidad y las posibles zonas de entrada. Características del indicador: Este es un súper indicador con Magia y dos bloques de flechas de tendencia para un comercio cómodo y rentable. El botón rojo para cambiar de bloque se muestra en el gráfico. La magia se establece en la configuración del indicador, por lo que puede instalar el indicador en
-   Real price is 80$   - 25% Discount ( It is 59$ now ) Contact me for instruction, any questions! Related Product:  Gold Trade Expert MT5 Introduction The breakout and retest strategy is traded support and resistance levels. it involves price breaking through a previous level.  The break and retest strategy is designed to help traders do two main things, the first is to avoid false breakouts. Many false breakouts start with a candlestick that breaks out of a level but ends with an immediate c
Matrix Arrow Indicator MT5
Juvenille Emperor Limited
5 (13)
Matrix Arrow Indicator MT5   es una tendencia única 10 en 1 que sigue un indicador   100% sin repintado   de marcos temporales múltiples que se puede usar en todos los símbolos/instrumentos:   divisas ,   materias primas ,   criptomonedas ,   índices ,   acciones .  Matrix Arrow Indicator MT5  determinará la tendencia actual en sus primeras etapas, recopilando información y datos de hasta 10 indicadores estándar, que son: Índice de movimiento direccional promedio (ADX) Índice de canales de prod
IX Power MT5
Daniel Stein
4.17 (6)
IX Power: Descubre perspectivas de mercado para índices, materias primas, criptomonedas y forex Descripción general IX Power es una herramienta versátil diseñada para analizar la fortaleza de índices, materias primas, criptomonedas y símbolos de forex. Mientras que FX Power ofrece la máxima precisión para pares de divisas mediante el uso de datos de todos los pares disponibles, IX Power se centra exclusivamente en los datos del mercado del símbolo subyacente. Esto convierte a IX Power en una e
Blahtech Supply Demand MT5
Blahtech Limited
4.54 (13)
Was: $299  Now: $149  Supply Demand uses previous price action to identify potential imbalances between buyers and sellers. The key is to identify the better odds zones, not just the untouched ones. Blahtech Supply Demand indicator delivers functionality previously unavailable on any trading platform. This 4-in-1 indicator not only highlights the higher probability zones using a multi-criteria strength engine, but also combines it with multi-timeframe trend analysis, previously confirmed swings
DESCRIPCIÓN ICSM (Impulse-Correction SCOB Mapper) es el indicador que analiza el movimiento del precio e identifica impulsos válidos, correcciones y SCOBs (Single Candle Order Block). Es una herramienta poderosa que se puede utilizar con cualquier tipo de análisis técnico porque es flexible, informativa, fácil de usar y mejora sustancialmente la conciencia del trader sobre las zonas de interés más líquidas. CONFIGURACIÓN General | Visuales Tema de color — define el tema de color del ICSM.
Este tablero muestra los últimos   patrones armónicos   disponibles para los símbolos seleccionados, por lo que ahorrará tiempo y será más eficiente /   versión MT4 . Indicador gratuito:   Basic Harmonic Pattern Columnas del indicador Symbol:   aparecerán los símbolos seleccionados Trend :   alcista o bajista Pattern :   tipo de patrón (gartley, mariposa, murciélago, cangrejo, tiburón, cifrado o ABCD) Entry :   precio de entrada SL:   precio de stop loss TP1:   1er precio de toma de beneficios
Trend Line Map Pro MT5
STE S.S.COMPANY
4.09 (11)
El indicador Trend Line Map es un complemento para Trend Screener Indicator. Funciona como un escáner para todas las señales generadas por el evaluador de tendencias (Trend Line Signals). Es un escáner de líneas de tendencia basado en el indicador de evaluación de tendencias. Si no tiene el indicador Trend Screener Pro, Trend Line Map Pro no funcionará. It's a Trend Line Scanner based on Trend Screener Indicator. If you don't have Trend Screener Pro Indicator,     the Trend Line Map Pro will n
ATrend
Zaha Feiz
4.73 (11)
ATREND: Cómo Funciona y Cómo Usarlo #### Cómo Funciona El indicador "ATREND" para la plataforma MT5 está diseñado para proporcionar a los traders señales de compra y venta robustas mediante una combinación de metodologías de análisis técnico. Este indicador utiliza principalmente el Rango Verdadero Promedio (ATR) para medir la volatilidad, junto con algoritmos de detección de tendencias para identificar posibles movimientos del mercado. Deja un mensaje después de la compra y recibe un regalo es
Este es posiblemente el indicador de reconocimiento automático de formación de precios más completo que puede encontrar para la plataforma MetaTrader. Detecta 19 patrones diferentes, toma las proyecciones de Fibonacci tan en serio como usted, muestra la zona de reversión potencial (PRZ) y encuentra niveles adecuados de stop-loss y take-profit. [ Guía de instalación | Guía de actualización | Solución de problemas | FAQ | Todos los productos ] Detecta 19 formaciones de precios armónicos diferen
ICT, SMC, SMART MONEY CONCEPTS, SMART MONEY, Smart Money Concept, Support and Resistance, Trend Analysis, Price Action, Market Structure, Order Blocks, BOS/CHoCH,   Breaker Blocks ,  Momentum Shift,   Supply&Demand Zone/Order Blocks , Strong Imbalance,   HH/LL/HL/LH,    Fair Value Gap, FVG,  Premium  &   Discount   Zones, Fibonacci Retracement, OTE, Buy Side Liquidity, Sell Side Liquidity, BSL/SSL Taken, Equal Highs & Lows, MTF Dashboard, Multiple Time Frame, BigBar, HTF OB, HTF Market Structure
Otros productos de este autor
Market Structure Patterns MT4
Samuel Manoel De Souza
5 (16)
Market Structure Patterns   is an indicator based on   smart money concepts   that displays   SMC/ICT   elements that can take your trading decisions to the next level. Take advantage of the   alerts ,   push notifications   and   email messages   to keep informed from when an element is formed on the chart, the price crosses a level and/or enters in a box/zone. Developers can access the values of the elements of the indicator using the   global variables  what allows the automation of trading
Visual Book on Chart
Samuel Manoel De Souza
4.38 (8)
Visual Book on Chart is an indicator designed specially for stocks and futures market. To check if you can use the tool with your Broker open the MT5 Depth Of Market on your terminal and check if there are price and volume data available.  Learn more about the MT5 Depth Of Market in the oficial page. The indicator shows the depth of market data on the chart window and use gradient  based on the market data to colorize the histogram bars. The indicator is formed by two components: The panel, whic
FREE
Tabajara Rules II The Best for MT5
Samuel Manoel De Souza
4.88 (8)
Tabajara Rules for MT5 , baseado em Setup Tabajara do professor André Machado, indica a direção do mercado com base em médias móveis quando tem velas na mesma direção da média móvel. O indicador contém a regra de coloração aplicada aos candles e a média móvel. O indicador permite a alteração dos parâmetros: período e método de suavização da média móvel. O indicador permite a alteração das cores dos candles ( contornos e preenchimento) e da média móvel. O modelo do professor André Machado conté
FREE
Envelopes Clouds
Samuel Manoel De Souza
5 (1)
The Indicator indicator draws 2 clouds based on Envelopes indicator values. The upper cloud is formed by the upper lines values and the lower cloud by the lowers lines values. The indicator allows to change the Envelopes parameters and the clouds colors the period of the base line and the deviations of each Envelopes instance. The indicator holds 5 buffer index as follow: [0] - Outer values of the upper cloud [1]  - Inner values of the upper cloud [2]  - Base/Center line values [3]  - Inner valu
FREE
Bollinger Clouds
Samuel Manoel De Souza
The Indicator indicator draws 2 clouds based on Bollinger Bands indicator values. The upper cloud is formed by the upper lines values and the lower cloud by the lowers lines values. The indicator allows to change the Bollinger Bands parameters and the clouds colors the period of the base line and the deviations of each Bollinger Bands instance. The indicator holds 5 buffer index as follow: [0] - Outer values of the upper cloud [1]  - Inner values of the upper cloud [2]  - Base/Center line values
FREE
Keltner Clouds
Samuel Manoel De Souza
The Indicator indicator draws 2 clouds based on Keltner indicator values. The upper cloud is formed by the upper lines values and the lower cloud by the lowers lines values. The indicator allows to change the Keltner parameters and the clouds colors the period of the base line and the deviations of each Keltner instance. The indicator holds 5 buffer index as follow: [0] - Outer values of the upper cloud [1]  - Inner values of the upper cloud [2]  - Base/Center line values [3]  - Inner values of
FREE
Donchian Clouds
Samuel Manoel De Souza
The Indicator indicator draws 2 clouds based on Donchian Channels indicator values. The upper cloud is formed by the upper lines values and the lower cloud by the lowers lines values. The indicator allows to change the Channels parameters and the clouds colors the period of the base line and the multiplier of each Donchian Channels instance. The indicator holds 5 buffer index as follow: [0] - Outer values of the upper cloud [1]  - Inner values of the upper cloud [2]  - Base/Center line values [3
FREE
Filtro:
Aruncharan Ganapathy Sivakumar
218
Aruncharan Ganapathy Sivakumar 2024.08.18 00:56 
 

As Greg Nicolas said confirmation arrow gives confidence if added... Thank you author for your dedication

Greg Nicolas
93
Greg Nicolas 2024.05.25 00:28 
 

The Indicator is a top notch but It really took me time to understand it.however, disabling those sessions and OTE which gives direction somehow late and adding a confirmation arrow really makes the difference for me. Kudos to Samuel for a great Job and five star. I have both MT4 & MT5 on fire with Synthetic

pfidelus
132
pfidelus 2024.04.23 13:07 
 

I have tested over 100 different indicators for MT5 and MT4, and I must say that this one is in the top 5 of my favorite indicators. I am able to see everything very clearly, including all key levels, which is amazing for my strategy. I highly recommend this indicator; it has everything you need to make consistent profits. I don't usually write reviews for indicators, but I had to for this one because I found it very useful and helpful.

Agbakeleke Idowu
609
Agbakeleke Idowu 2024.04.21 23:47 
 

Very Useless Indicator Very Stupid creator... Very Lazy creator... People have advised him to add confirmation arrows for buy and Sell with TP and SL. Yet He kept saying all manners of rubbish. Clients are always first and then you last... Most worst indicator on Mql5

Samuel Manoel De Souza
31671
Respuesta del desarrollador Samuel Manoel De Souza 2024.10.12 18:44
You're not a fair person, deleting old reviews and complaining about things not promised in the description.
Alia Kaliner
28
Alia Kaliner 2024.03.20 10:34 
 

Please send me the documentation.

bijae
109
bijae 2023.12.16 11:09 
 

This 3.0 update just made this indicator 10x more powerful and undervalued at the same time! Sam is simply the best! Keep it up!

piola
39
piola 2023.11.23 01:41 
 

This indicator is amazing

elifranck gouvea
62
elifranck gouvea 2023.10.10 03:46 
 

Ainda nÃo consegui fazer uma boa análise pelo indicador, que tal fazer um video explicativo do mesmo?

YouLan
36
YouLan 2023.09.02 06:06 
 

El usuario no ha dejado ningún comentario para su valoración

Saep Mulyana
191
Saep Mulyana 2023.07.28 09:51 
 

good

afreitas
19
afreitas 2023.07.17 02:13 
 

El usuario no ha dejado ningún comentario para su valoración

999107
90
999107 2023.07.01 09:11 
 

Very Excellent Indicator Much Appreciated for your good work. Thank You Would please send me the Documentation, Just Bought this indicator.

Truta Petru Lucian
323
Truta Petru Lucian 2023.06.28 22:02 
 

Excellent indicator

BINARY VADER
26
BINARY VADER 2023.06.27 15:14 
 

Doesn't Work on New Update of MT5 ;Please Help

munis
19
munis 2023.06.11 12:38 
 

Hello, The indicator was fantastic but My Mt5 was updated and the indicator doesn't work again. Is there any manual that can guide how to rectify this before given my rating.

It's back working perfectly with awesome new features. I give 5 star

Alejandro Estan Fraga Salinas
445
Alejandro Estan Fraga Salinas 2023.05.17 07:11 
 

Very good indicator. Everything you need for a successful manual trading. Adding a trading assistant will complete the pack Thanks Wellington !

Aravind Kolanupaka
9060
Aravind Kolanupaka 2023.05.11 21:26 
 

Good work. I love this indicator.

Collins M
63
Collins M 2023.05.04 23:12 
 

I can confidently say this is THE BEST indicator out there. Great work author

drzocker
162
drzocker 2023.05.03 20:27 
 

Gute Arbeit !! Nice and Good Work !! Hope of Updates

Matimba Maluleka
24
Matimba Maluleka 2023.05.02 13:20 
 

El usuario no ha dejado ningún comentario para su valoración

12
Respuesta al comentario
Versión 3.30 2024.11.10
- Fixed errors
* conflict of objects across multiple charts
Versión 3.29 2024.11.09
- Fixed errors
* Fixed an error on Liquidity Voids Positioning
* Fixed an error on the logic of Bearish Liquidity Voids mitigation (it was generating duplicated drawings)
- update of transparency effects for perfectly blend with other chart objects or drawings like bid, ask and last price lines drawn behind of the indicator
- name of the indicator in the emails and push alerts was changed to MSP4 (for MT4) and MSP5 (for MT5)
Versión 3.28 2024.10.19
Error when change timeframe/symbol with Implied FVG enabled has been fixed.
Versión 3.27 2024.10.18
- Bugs in the new bar event have been fixed.
- Other preventive updates.
Versión 3.24 2024.09.12
- Addition of buffers. The buffers mapping can be checked in the product description page.
- Number of order/breaker blocks now is applied for bullish an bearish separately, For example in previous version if you enter 5 in the inputs, you would see only 5 order blocks in total, for example 3 bullish and 2 bearish. Now it considers 5 bullish and 5 bearish, so you can see 10 order blocks in total.
- The order blocks in global variables was updated to reflect the above change. Check description to know how it if formated now.
- Correction of alert for bearish order/breaker blocks.
Versión 3.23 2024.07.29
Fibonacci levels alert updates.
Versión 3.21 2024.06.18
Fixed errors:
- Array out of range in some symbols and/or timeframes.
Versión 3.20 2024.06.17
- Correction for higher timeframe inverse fvg.
- Added Premium/Discount to global variables.
Versión 3.19 2024.06.06
Added MTF FVGs and his corresponding alerts.
Versión 3.16 2024.04.22
New features
- New alerts for FVG, Inverse FVG and Implied FVG
- Alerts now can be triggered once per bar by the amount set in the parameters for Premium, Equilibrium and Discounts zones
Versión 3.15 2024.04.21
Fixed errors:
- Invalid pointer error when show inverse fvg is disabled.
Versión 3.14 2024.04.19
New features:
- Inverse Fair Value Gaps
Versión 3.13 2024.04.17
Fixed errors:
- Rectangle of sessions when displaying at price
Versión 3.12 2024.04.16
Fixed errors:
- Prev. day ohlc line color
- FVG on daily timeframe
Defaults changed:
- Default color or Previous day/week/month ohlc
New features:
- Define a default font size for all labels and custom font size for each label
Versión 3.11 2023.12.18
- Added Implied Fair Value Gap (IFVG)
- Quick fix for breaker block displayed with order block
Versión 3.0 2023.12.15
- Updates to default settings
- Candles colors bugs fixed
- Labels organization bugs fixed
- FVG bugs fixed
- Higher timeframe OHLC values bugs fixed
- Candle color now updates in real time
- Candle color can be customized for internal trend and internal & swing trend alignment
- Now is possible to select between two label style
- Updates to Higher timeframe OHLC values
- Structure break type selection now applies to both bullish and bearish
- Breaker Blocks is made independently of Order Blocks.
- Breaker Blocks has more display options. To hide Breaker Blocks just select option 'None' in the drop-down list
- Fibonacci & OTE color can be different for bullish and bearish scenarios
- Added sessions preconfigured for Forex sessions, Silver Bullet and Kill Zone time ranges
- Added Buy/Sell Stops Liquidity (BSL/SSL)
- Added Liquidity Voids
- New alerts options
Versión 2.23 2023.10.30
Updates to labels design
Added High/Low of day (HoD/LoD)
Added alerts to Premium/Discount
Added Fibonacci/OTE levels
Improvements to Swing algorithm
Improvements to Premium/Discount algorithm
Fix to use of color NONE.
Adjustable internal structure length.
The indicator was reduced to a single chart object.
Maximum compatibility between MT4 and MT5 versions.
Versión 2.22 2023.08.24
- Added Breaker Blocks
- Added Breaker Alerts
- Added symbol and timeframe to the subject of email alerts
- More labels updates.
Versión 2.21 2023.08.02
- Added alerts for order blocks touch.
- Updates for labels display.
Versión 2.2 2023.07.28
- Prior Highs and Lows anchor points bug fixed.
- Auto-adjustable labels. Now the labels on the right side of the chart will not overlap.
- Added the Opening Gaps (OG) pattern.
- Added the 50% line on the FVGs.
- Added alerts for new FVGs and OGs.
- Remove the filled FVGs now is optional. By default is set to false.
Versión 2.1 2023.07.13
Allowance to access BoS and CHoCH values through Global Variables.
The global variable names are given by "SMP-"+_Symbol+"("+TIMEFRAME+")-"+"PatternName", for example "SMP-EURUSD(H4)-+iBoS", "SMP-EURUSD(H4)--iCHoCH", etc;
Versión 2.0 2023.05.29
Division by zero error fixed.
Color candles now is false by default.
Added order blocks access through global variables. The global variables names conventions is as follow.
- The names prefixes are given by the "SMP-"+_Symbol+"("+TIMEFRAME+")", for example "SMP-EURUSD-H4";
- Add "-IOB" for internal order blocks or "-OB" for swing order blocks;
- Add "-Total to get the amount of order blocks on the charts;"
- Add "[index]-Top" and/or "[index]-Bot" to get the order blocks values.
Versión 1.9 2023.05.20
Update to LL and HL labels.
Update to Premium/Discount labels.
Update to Strong/Weak High/Low labels.
Update to Strong/Weak High/Low line styles.
Versión 1.8 2023.05.14
Order blocks colors bug fixed.
Versión 1.7 2023.05.07
Alert conditions update.
Structures labels updated to match alerts identifiers.
Versión 1.6 2023.05.07
Addition of alert types and conditions.
It includes a special alert type, that sends a custom event to any program in the same chart, which can be used to build Expert Advisor based on this indicator.
The alert information is sent as a string combination in case of multiple alerts on the same candle. For example, sparam = "+CHoCH|+OB", in this case there are two alerts, separated by the character '|'.
Versión 1.5 2023.05.02
Corrections:
- Correction of drawings while scrolling the chart.
Versión 1.4 2023.05.02
Corrections:
- Texts "Week High" and "Week Low" updated to "Weak High" and "Weak Low".
- Update to avoid division by zero.
- Fixed the drawing delay on new bars seen in Strategy tester.
Versión 1.2 2023.04.27
Bug fixed: strange vertical line on last candle.
Versión 1.1 2023.04.26
Bug fixes for EQH and EQL on Daily, weekly and monthly timeframes.
Prior highs and lows filtering based on chart timeframe.