• Información general
  • Comentarios
  • Discusión (2)

Top Bottom Indicator

Indicador Introducción

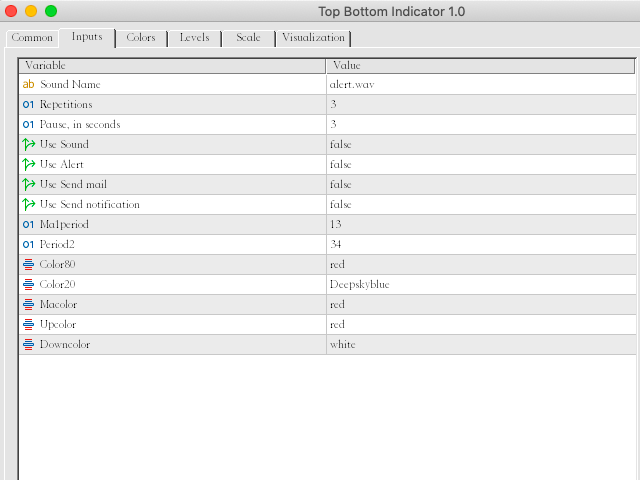
El indicador está diseñado de acuerdo con fórmulas de promedio móvil, que es más estable ytiene menos retraso queRSI o CCI. El indicador tiene tres valores de indicador, el período de promedio móvil y los colores de la línea se pueden cambiar manualmente.

¿Qué puede aportarte este indicador?

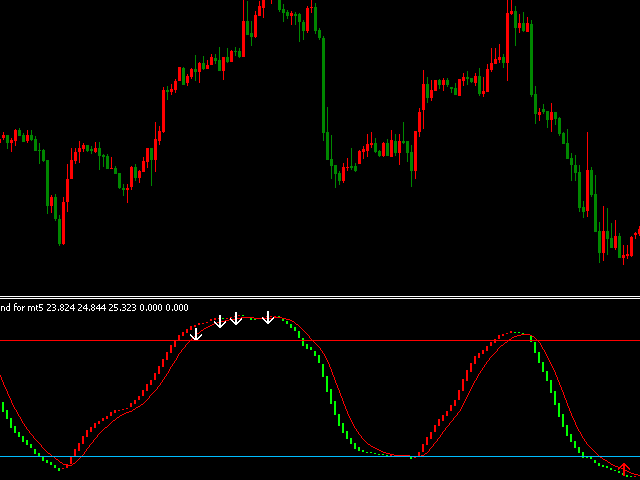
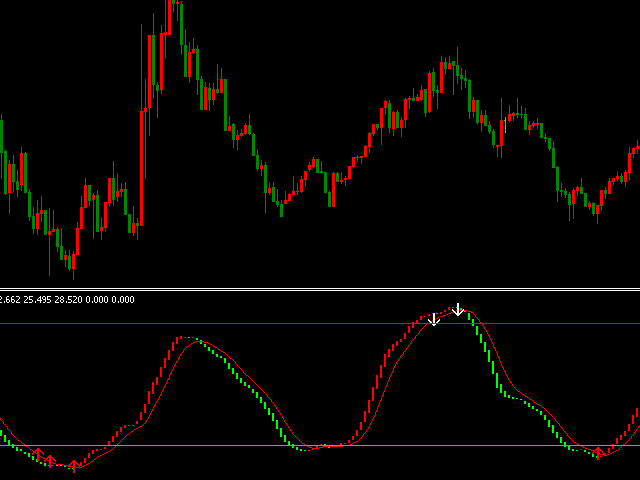
  1. Señales de entrada precisas: el indicador dibuja señales de flecha hacia arriba y hacia abajo.
  2. Análisis de tendencia multiperíodo: al cargar este indicador en un gráfico de marco de tiempo grande y en un gráfico de marco de tiempo pequeño, el efecto de usarlo será mejor. Juzgue la dirección de la tendencia de acuerdo con el color del indicador en el gráfico de marco de tiempo grande e ingrese al mercado de acuerdo con las señales en un gráfico de marco de tiempo pequeño.
  3. Juzgando la sección de precio alto y precio bajo: El valor del indicador siempre está entre 0 y 100, en base a esto, se puede analizar la posición relativa del precio. cuando la línea de tendencia es superior a 80, el precio está en una sección de sobrecompra, puede elegir oportunidades para abrir posiciones de compra. cuando la línea de tendencia está por debajo de 20, el precio está en unasecciónde sobreventa, puede elegir oportunidades para abrir posiciones de venta;
  4. Diseño de nuevos EA: puede diseñar nuevos EA en función de la dirección de la línea de tendencia o la divergencia delindicador;
  5. Alarmas: Cuando hay señales de flecha hacia arriba o hacia abajo, o dos líneaspor encima de 80ytienen una cruz hacia arriba o hacia abajo. por debajo de 20 y tieneuna cruz hacia abajo, puede enviar correos electrónicos y mensajes al cliente móvil y, al mismo tiempo, enviar alertas en la ventana del gráfico, lo que le permite obtener una señal instantánea sin mirar las señales por sí mismo todo el tiempo. El número de repeticiones de recordatorio de cada vez se puede modificar manualmente, y los tres tipos de recordatorios de mensajes se pueden activar o desactivar manualmente.
Características del indicador
  • El indicador dibuja líneas de tendencia de forma sencilla e intuitiva, es fácil de usar;
  • Tiene una fuerte previsibilidad para los precios, y el valor del indicador siempre está entre 0 y 100, lo que puede predecir el precio relativamente alto o bajo;
  • Robusto, sin frecuentes retrocesos de la señal de tendencia;
  • Pequeño retraso, es capaz de cambiar los colores de la línea de tendencia en la etapa inicial de reversión de precios;
  • Aplicable a todos los marcos de tiempo y cualquier símbolo;
  • Las líneas de tendencia y las señales de flecha no se desviarán ni se volverán a pintar;

El indicador se muestra en las siguientes figuras, puede descargar el indicador y probarlo en terminales MT5.


Productos recomendados
Owl Smart Levels MT5
Sergey Ermolov
4.38 (37)
Versión MT4  |  FAQ El Indicador Owl Smart Levels es un sistema comercial completo dentro de un indicador que incluye herramientas de análisis de mercado tan populares como los fractales avanzados de Bill Williams , Valable ZigZag que construye la estructura de onda correcta del mercado y los niveles de Fibonacci que marcan los niveles exactos de entrada. en el mercado y lugares para tomar ganancias. Descripción detallada de la estrategia Instrucciones para trabajar con el indicador Asesor de c
VSA target
Evgenii Bazhenov
Objetivo de VSA El indicador identifica a un comprador profesional o vendedor profesional en el gráfico utilizando el sistema VSA (Volume Spread Analysis) y construye una zona de soporte de tendencia en relación con estas barras (velas), así como los niveles objetivo.  Particularidades: 1. En este indicador, puede seleccionar un modo en el que solo se definirá un comprador profesional o un vendedor profesional, y ambos participantes profesionales se determinarán simultáneamente. 2. Puede establ
El indicador construye cotizaciones actuales, que se pueden comparar con las históricas y, sobre esta base, hacer un pronóstico de movimiento de precios. El indicador tiene un campo de texto para una navegación rápida a la fecha deseada. Opciones: Símbolo - selección del símbolo que mostrará el indicador; SymbolPeriod - selección del período del cual el indicador tomará datos; IndicatorColor - color del indicador; HorisontalShift: cambio de cotizaciones dibujadas por el indicador
GIVE A LOOK TO MY OTHER PRODUCTS ! 100 % PER MONTH PROFIT---- MY NEW SIGNAL HERE ------->   https://www.mql5.com/en/signals/2162238?source=Site+Signals+My# BROKEN TRENDLINE ALERT IS A SIMPLE TOOL INDICATOR. JUST DRAW IN YOUR CHART A DYNAMIC OR STATIC TRENDLINE,AND THE INDICATOR WILL SEND YOU ALERT WHENEVER THE PRICE CROSSES BELOW OR ABOVE YOUR DRAWN TRENDLINE. IT WORKS IN ANY TIMEFRAME AND ANY CHART YOU WANT.JUST GOT A VPS AND DON'T STRESS IN FRONT OF YOUR COMPUTER. FOR ANY KIND OF QUESTION
Order Book, known also as Market Book, market depth, Level 2, - is a dynamically updated table with current volumes of orders to buy and to sell specific financial instument at price levels near Bid and Ask. MetaTrader 5 provides the means for receiving market book from your broker, but in real time only, without access to its history. The indicator OrderBook Cumulative Indicator accumulates market book data online and visualizes them on the chart. In addition, the indicator can show the market
VR Grid Mt5
Vladimir Pastushak
3.6 (10)
El indicador VR Grid está diseñado para crear una cuadrícula gráfica con configuraciones definidas por el usuario. A diferencia de la cuadrícula estándar , VR Grid se utiliza para construir niveles circulares . Dependiendo de la elección del usuario, el paso entre los niveles de ronda puede ser arbitrario. Además, a diferencia de otros indicadores y utilidades, VR Grid mantiene la posición de la grilla incluso cuando cambia el período de tiempo o se reinicia el terminal. Las configuraciones, arc
FREE
¡El nivel Premium es un indicador único con más del 80% de precisión de predicciones correctas! ¡Este indicador ha sido probado por los mejores especialistas en comercio durante más de dos meses! ¡El indicador del autor no lo encontrarás en ningún otro lugar! ¡A partir de las capturas de pantalla, puede ver por sí mismo la precisión de esta herramienta! 1 es ideal para operar con opciones binarias con un tiempo de vencimiento de 1 vela. 2 funciona en todos los pares de divisas, accion
KDJ Index 4   交易实用必备工具指标 波浪自动计算指标,通道趋势交易 完美的趋势-波浪自动计算通道计算 , MT4版本 完美的趋势-波浪自动计算通道计算 , MT5版本 本地跟单复制交易 Easy And Fast Copy , MT4版本 Easy And Fast Copy , MT5版本 本地跟单复制交易 模拟试用 Easy And Fast Copy , MT4 模拟账号运行 Easy And Fast Copy , MT5 模拟账号运行 "Cooperative QQ:556024  "  "Cooperation wechat:556024"  "Cooperative email:556024@qq.com" 强烈推荐趋势指标, 波浪的标准自动计算   和   波浪的标准自动计算MT5版本     KDJ指标又叫 随机指标 ,是一种相当新颖、实用的技术分析指标,它起先用于期货市场的分析,后被广泛用于股市的中短期趋势分析,是期货和股票市场上最常用的技术分析工具。 随机指标KDJ一般是用于股票分析的统计体系,根据统计学原理,通过一个特定的周期(常为9日、9周等
Point Black
Ignacio Agustin Mene Franco
Pack Black Card indicador 5/1  Point black  cuenta con la estrategia de bollingers profesionales donde cada flecha te da una señal distinta de entrada .  sirve asta para operar en m1 y en d1  sirve para hacer scalping y intraday ,  modificado para los mercados de forex !  apto para todo los pares  modificado para los mercados de indices sinteticos apto para todo los pares !  Ideal para los volatilitys y jumps ! 
Renko System
Marco Montemari
This indicator can be considered as a trading system. It offers a different view to see the currency pair: full timeless indicator, can be used for manual trading or for automatized trading with some expert advisor. When the price reaches a threshold a new block is created according to the set mode. The indicator beside the Renko bars, shows also 3 moving averages. Features renko mode median renko custom median renko 3 moving averages wicks datetime indicator for each block custom notificatio
Trade Helper
Pavel Gotkevitch
The Trade Helper indicator is a modification of the Trade Assistant indicator (by Andriy Moraru). The Trade Helper multitimeframe indicator is a good assistant for traders, useful as a filter in most trading strategies. This indicator combines the tactics of Elder's Triple Screen in a single chart, which lies in entering a trade when the same trend is present on three adjacent timeframes. The indicator operation is based on the principle of determining the trend on the three selected timeframes
LT Rainbow Trend
Thiago Duarte
5 (1)
Do you, like me, like to trade with the trend? Then this indicator will help you! Rainbow Trend is a trend indicator, which uses several Moving Averages on the chart. It measures different trend strenght zones for different periods: very long term, long term, mid term, short term and very short term. Each zone has its color, and it is possible to have sound alert when the prices leaves a zone and enters another. Its configuration is very simple. If you find any bug or have any suggestions, co
Combined
Ahmed Alaaeldin Abdulrahman Ahmed Elherzawi
5 (1)
Welcome to Investment Castle products This product is exclusively available in the MQL5 market and is not available and will not be available anywehere else. The Combined indicator is a multi-time frame indicator and it is built using 3 indicators: Bands indicator which draws the support and resistance key levels using up to 5 different time frames Patterns indicator which draws the chart patterns using up to 6 different time frames Spots indicator which shows the common candlestick patterns Yo
Ichimoku Aiko MTF
Michael Jonah Randriamampionontsoa
Ichimoku Aiko MTF is a collection of technical indicators that show support and resistance levels, as well as momentum and trend direction. It is a multi-timeframe indicator so you don't need to change the chart timeframe when you want to see the ichimoku clouds on a higher timeframe.  eg. The chart timeframe is M15 and you want to see on the M15 timeframe chart the H1 ichimoku indicators (the ichimoku in Metatrader can't do that) that's why you need to use Ichimoku Aiko MTF.
Trend Volley
Philip Effiong Philip
Unlike any indicator you’ve seen, Trend Volley is an advanced purpose-built trend trading charting system that has been successfully used in nearly every tradable market. It is unique in many ways. Trend Volley’s internal trend detector algorithm studies the market and dynamically chooses the right values for the internal parameters, to adapt to the price and to decrease consecutive trend failures. It can be applied to any financial assets:  forex, cryptocurrencies, metals, stocks, indices.  ITS
The indicator detects divergence signals - the divergences between the price peaks and the MACD oscillator values. The signals are displayed as arrows in the additional window and are maintained by the messages in a pop-up window, e-mails and push-notifications. The conditions which formed the signal are displayed by lines on the chart and in the indicator window. The indicator parameters MacdFast - fast MACD line period MacdSlow - slow MACD line period MacdSignal - MACD signal line period Mac
Green Power
Ignacio Agustin Mene Franco
Pack Black Card  indicador 5/3 Green power cuenta con la estrategia de ropturas high y low  dando la señal con el punto rojo o verde  el punto rojo para short y el punto verde para long ,  perfecto para los mercados de forex y los mercados de indices sinteticos ,  funciona para todas las temporalidades  sirve para hacer scalping y intradiario !  Ideal para los mercados Crash y boom !!
Noize Absorption Index - is the manual trading system that measures the difference of pressure between bears forces and bulls forces. Green line - is a noize free index that showing curent situation. Zero value of index shows totally choppy/flat market.Values above zero level shows how powerfull bullish wave is and values below zero measures bearish forces.Up arrow appears on bearish market when it's ready to reverse, dn arrow appears on weak bullish market, as a result of reverse expectation.
Features All Ichimoku Signals (Selectable) : Display all reliable signals generated by the Ichimoku indicator. You can choose which signals to view based on your preferences. Filter by Signal Strength : Sort signals by their strength—whether they are weak, neutral, or strong. Live Notifications : Receive real-time notifications for Ichimoku signals. Transparent Cloud : Visualize the Ichimoku cloud in a transparent manner. Available Signals Tenkensen-Kijunsen Cross Price-Kijunsen Cross Pri
Blahtech Supply Demand MT5
Blahtech Limited
4.57 (14)
Was: $299  Now: $99   Supply Demand uses previous price action to identify potential imbalances between buyers and sellers. The key is to identify the better odds zones, not just the untouched ones. Blahtech Supply Demand indicator delivers functionality previously unavailable on any trading platform. This 4-in-1 indicator not only highlights the higher probability zones using a multi-criteria strength engine, but also combines it with multi-timeframe trend analysis, previously confirmed swings
Follow The Line MT5
Oliver Gideon Amofa Appiah
4.42 (31)
This indicator obeys the popular maxim that: "THE TREND IS YOUR FRIEND" It paints a GREEN line for BUY and also paints a RED line for SELL. (you can change the colors). It gives alarms and alerts of all kinds. IT DOES NOT REPAINT and can be used for all currency pairs and timeframes. Yes, as easy and simple as that. Even a newbie can use it to make great and reliable trades. NB: For best results, get my other premium indicators for more powerful and reliable signals. Get them here: https://www.m
FREE
Every indicator has its advantages and disadvantages. Trending ones show good signals during a trend, but lag during a flat. Flat ones thrive in the flat, but die off as soon as a trend comes. All this would not be a problem, if it was easy to predict when a flat changes to a trend and when a trend changes to a flat, but in practice it is an extremely serious task. What if you develop such an algorithm, which could eliminate an indicator's flaws and enhance its strengths? What if such an algorit
Gioteen Volatility Index (GVI) - your ultimate solution to overcoming market unpredictability and maximizing trading opportunities. This revolutionary indicator helps you in lowering your losing trades due to choppy market movements. The GVI is designed to measure market volatility, providing you with valuable insights to identify the most favorable trading prospects. Its intuitive interface consists of a dynamic red line representing the volatility index, accompanied by blue line that indicate
The indicator detects and displays М. Gartley's Butterfly pattern. The pattern is plotted by the extreme values of the ZigZag indicator (included in the resources, no need to install). After detecting the pattern, the indicator notifies of that by the pop-up window, a mobile notification and an email. The pattern and wave parameters are displayed on the screenshots. The default parameters are used for demonstration purposes only in order to increase the amount of detected patterns. Parameters
JAC Trend Color Candle
Eduardo Da Costa Custodio Santos
El indicador "JAC Trend Color Candle" para Meta Trader 5, fue creado para facilitar visualmente la tendencia al comerciante. Se basa en tres parámetros, que identifican el mercado con tendencia alcista, bajista y sin tendencia. Los colores son configurables por el comerciante, y el comerciante promedio también lo es. Los parámetros de tendencia no se pueden configurar ya que son el diferencial del indicador.
Donchian Channel DC is the indicator of Donchian Channels, that plots maximum and minimum values of a specific period, besides mean value line. It´s possible to configure simple period for analysis and the indicator will plot all three values. You can trade with this indicator as trend or reversal, according to each strategy. Do not let to test others indicators as soon as others expert advisors.
TrendDetect
Pavel Gotkevitch
The Trend Detect indicator combines the features of both trend indicators and oscillators. This indicator is a convenient tool for detecting short-term market cycles and identifying overbought and oversold levels. A long position can be opened when the indicator starts leaving the oversold area and breaks the zero level from below. A short position can be opened when the indicator starts leaving the overbought area and breaks the zero level from above. An opposite signal of the indicator can
This indicator is a zero-lag indicator and displays  strength of trend change . True Trend  Oscillator Pro works best in combination with True Trend Moving Average Pro that displays exact trend as is. Oscillator value is exact price change in given direction of the trend. True Trend Moving Average Pro: https://www.mql5.com/en/market/product/103586 If you set PERIOD input parameter to 1 this indicator becomes a sharpshooter for binary options. Developers can use True Trend Oscillator in E
FREE
TransitBlueOcean
Bonginkosi Innocent Khumalo
5 (1)
TransitBlueOcean is indicator system that uses ocean wave's pattern, to help one to know when to buy and when to sell. The indicator system is very powerful like the ocean waves. Join the mql5 channel for TransitBlueOcean  https://www.mql5.com/en/channels/transitblueocean   How to use: Zoom in so that the Ocean will appear on your chart. Buy when you see the candles, the candle will be above the ocean wave (buying signal). Sell when you can't see the candles, the candles will be inside the w
Slopes are an increasingly key concept in Technical Analysis. The most basic type is to calculate them on the prices, but also on technical indicators such as moving averages and the RSI. In technical analysis, you generally use the RSI to detect imminent reversal moves within a range. In the case of the Blue indicator, we are calculating the slope of the market price and then calculating the RSI of that slope in order to detect instances of reversal. The Blue indicator is therefore used
Los compradores de este producto también adquieren
Atomic Analyst MT5
Issam Kassas
5 (14)
En primer lugar, vale la pena enfatizar que este Indicador de Trading no repinta, no redibuja y no se retrasa, lo que lo hace ideal tanto para el trading manual como para el automatizado. Manual del usuario: configuraciones, entradas y estrategia. El Analista Atómico es un Indicador de Acción del Precio PA que utiliza la fuerza y el impulso del precio para encontrar una mejor ventaja en el mercado. Equipado con filtros avanzados que ayudan a eliminar ruidos y señales falsas, y aumentan el poten
Primero que todo, vale la pena enfatizar que este Sistema de Trading es un Indicador No Repintado, No Redibujado y No Retrasado, lo que lo hace ideal tanto para el trading manual como para el automatizado. Curso en línea, manual y descarga de ajustes preestablecidos. El "Sistema de Trading Inteligente MT5" es una solución completa de trading diseñada para traders nuevos y experimentados. Combina más de 10 indicadores premium y presenta más de 7 estrategias de trading robustas, lo que lo convie
Quantum Trend Sniper
Bogdan Ion Puscasu
4.91 (43)
Introduciendo       Indicador Quantum Trend Sniper   , el innovador indicador MQL5 que está transformando la forma en que identificas y negocias los cambios de tendencia. Desarrollado por un equipo de comerciantes experimentados con experiencia comercial de más de 13 años,       Indicador de francotirador de tendencia cuántica       está diseñado para impulsar su viaje comercial a nuevas alturas con su forma innovadora de identificar cambios de tendencia con una precisión extremadamente alta.
FX Power MT5 NG
Daniel Stein
5 (5)
Obtenga su actualización diaria del mercado con detalles y capturas de pantalla a través de nuestro Morning Briefing aquí en mql5 y en Telegram ! FX Power MT5 NG es la nueva generación de nuestro popular medidor de fuerza de divisas, FX Power. ¿Y qué ofrece este medidor de fuerza de nueva generación? Todo lo que le encantaba del FX Power original PLUS Análisis de fuerza de ORO/XAU Resultados de cálculo aún más precisos Períodos de análisis configurables individualmente Límite de cálculo persona
Reversal First Impulse levels (RFI)      INSTRUCTIONS        RUS       -       ENG              R ecommended to use with an indicator   -   TREND PRO -  Version MT4                 A key element in trading is zones or levels from which decisions to buy or sell a trading instrument are made. Despite attempts by major players to conceal their presence in the market, they inevitably leave traces. Our task was to learn how to identify these traces and interpret them correctly. Main functions:: Di
Trend Screener Pro MT5
STE S.S.COMPANY
4.88 (64)
Desbloquee el poder del comercio de tendencias con el indicador Trend Screener: ¡su solución definitiva para el comercio de tendencias impulsada por lógica difusa y un sistema multidivisa!Mejore su comercio de tendencias con Trend Screener, el revolucionario indicador de tendencias impulsado por lógica difusa. Es un poderoso indicador de seguimiento de tendencias que combina más de 13 herramientas y funciones premium y 3 estrategias comerciales, lo que lo convierte en una opción versátil para co
Ante todo, vale la pena enfatizar que esta Herramienta de Trading es un Indicador No Repintado, No Redibujado y No Retrasado, lo que la hace ideal para el trading profesional. Curso en línea, manual del usuario y demostración. El Indicador de Conceptos de Acción del Precio Inteligente es una herramienta muy potente tanto para traders nuevos como experimentados. Combina más de 20 indicadores útiles en uno solo, combinando ideas avanzadas de trading como el Análisis del Trader del Círculo Inte
Gold Stuff mt5
Vasiliy Strukov
4.89 (177)
Gold Stuff mt5: un indicador de tendencia diseñado específicamente para el oro, también se puede usar en cualquier instrumento financiero. El indicador no se vuelve a dibujar ni se retrasa. El marco de tiempo recomendado es H1. IMPORTANTE! Póngase en contacto conmigo inmediatamente después de la compra para obtener instrucciones y bonificación!   Puede obtener una copia gratuita de nuestro indicador Strong Support y Trend Scanner, por favor envíe un mensaje privado. ¡a mí! PARÁMETROS Draw
FX Volume MT5
Daniel Stein
4.94 (17)
Obtenga su actualización diaria del mercado con detalles y capturas de pantalla a través de nuestro Morning Briefing aquí en mql5 y en Telegram ! FX Volume es el PRIMER y ÚNICO indicador de volumen que proporciona una visión REAL del sentimiento del mercado desde el punto de vista de un bróker. Proporciona una visión impresionante de cómo los participantes institucionales del mercado, como los brokers, están posicionados en el mercado Forex, mucho más rápido que los informes COT. Ver esta info
TPSproTREND PrO MT5
Roman Podpora
4.88 (8)
TPSpro TRENDPRO  - is a trend indicator that automatically analyzes the market and provides information about the trend and each of its changes, as well as giving signals for entering trades without redrawing! The indicator uses each candle, analyzing them separately. referring to different impulses - up or down impulse. Exact entry points into transactions for currencies, crypto, metals, stocks, indices!  -  Version MT4               DETAILED DESCRIPTION               R ecommended to use with
FxaccurateLS
Shiv Raj Kumawat
WHY IS OUR FXACCCURATE LS MT5 THE PROFITABLE ? PROTECT YOUR CAPITAL WITH RISK MANAGEMENT Gives entry, stop and target levels from time to time. It finds Trading opportunities by analyzing what the price is doing during established trends. POWERFUL INDICATOR FOR A RELIABLE STRATEGIES We have made these indicators with a lot of years of hard work. It is made at a very advanced level. Established trends provide dozens of trading opportunities, but most trend indicators completely ignore them!
ICT, SMC, SMART MONEY CONCEPTS, SMART MONEY, Smart Money Concept, Support and Resistance, Trend Analysis, Price Action, Market Structure, Order Blocks, BOS/CHoCH,   Breaker Blocks ,  Momentum Shift,   Supply&Demand Zone/Order Blocks , Strong Imbalance,   HH/LL/HL/LH,    Fair Value Gap, FVG,  Premium  &   Discount   Zones, Fibonacci Retracement, OTE, Buy Side Liquidity, Sell Side Liquidity, BSL/SSL Taken, Equal Highs & Lows, MTF Dashboard, Multiple Time Frame, BigBar, HTF OB, HTF Market Structure
"Piranha" - an autonomous trading system that determines overbought and oversold levels on the chart. Red and blue zones represent overbought and oversold levels respectively. Entry points are marked with arrows: a downward arrow in the red zone for "sell" and an upward arrow in the blue zone for "buy". The Take profit level is indicated by the green moving average. Key features: Adjusting the Take profit level as the green moving average changes position. Averaging ability when a new market e
The Volume by Price Indicator for MetaTrader 5 features Volume Profile and Market Profile TPO (Time Price Opportunity). Volume and TPO histogram bar and line charts. Volume Footprint charts. TPO letter and block marker collapsed and split structure charts. Session filtering and grouping. Static, dynamic and flexible range segmentation and compositing methods with relative and absolute visualizations. Graphical layering, positioning and styling options to suit the user's analytic and aesthetic n
AW Trend Predictor MT5
AW Trading Software Limited
4.78 (58)
La combinación de niveles de tendencia y ruptura en un sistema. Un algoritmo de indicador avanzado filtra el ruido del mercado, determina la tendencia, los puntos de entrada y los posibles niveles de salida. Las señales indicadoras se registran en un módulo estadístico, que le permite seleccionar las herramientas más adecuadas, mostrando la efectividad del historial de señales. El indicador calcula las marcas Take Profit y Stop Loss. Manual e instrucciones ->   AQUÍ   / Versión MT4 ->   AQUÍ Có
Quantum Heiken Ashi PRO MT5
Bogdan Ion Puscasu
4.5 (8)
Presentamos el   Quantum Heiken Ashi PRO Diseñadas para brindar información clara sobre las tendencias del mercado, las velas Heiken Ashi son reconocidas por su capacidad para filtrar el ruido y eliminar las señales falsas. Diga adiós a las confusas fluctuaciones de precios y dé la bienvenida a una representación gráfica más fluida y confiable. Lo que hace que Quantum Heiken Ashi PRO sea realmente único es su fórmula innovadora, que transforma los datos de velas tradicionales en barras de colore
Conviértase en un Breaker Trader y obtenga beneficios de los cambios en la estructura del mercado a medida que se invierte el precio. El indicador de ruptura de bloque de órdenes identifica cuándo una tendencia o movimiento de precio se acerca al agotamiento y está listo para revertirse. Le alerta sobre cambios en la estructura del mercado que generalmente ocurren cuando una reversión o un retroceso importante están a punto de suceder. El indicador utiliza un cálculo patentado que identific
Legacy of Gann for MT5
Pavel Zamoshnikov
5 (6)
The indicator very accurately determines the levels of the possible end of the trend and profit fixing. The method of determining levels is based on the ideas of W.D.Gann, using an algorithm developed by his follower Kirill Borovsky. Extremely high reliability of reaching levels (according to K. Borovsky  - 80-90%) Indispensable for any trading strategy – every trader needs to determine the exit point from the market! Precisely determines targets on any timeframes and any instruments (forex, met
Este es un genial indicador para MT5 que ofrece señales precisas para entrar en una transacción sin redibujar. Se puede aplicar a cualquier activo financiero: fórex, criptomonedas, metales, acciones, índices. Nos dará valoraciones bastante precisas y nos dirá cuándo es mejor abrir y cerra una transacción. Eche un vistazo  al vídeo  (6:22), ¡contiene un ejemplo de procesamiento de una sola señal que ha amortizado el indicador! La mayoría de los tráders mejoran sus resultados comerciales durante l
Advanced Supply Demand MT5
Bernhard Schweigert
4.53 (15)
¡Actualmente con 33% de descuento! ¡La mejor solución para cualquier tráder principiante o experto! Este indicador es una herramienta comercial única, de alta calidad y asequible, porque incorpora una serie de características patentadas y una nueva fórmula. Con esta actualización, podrá mostrar zonas de doble marco temporal. No solo podrá mostrar un marco temporal más alto, sino también mostrar ambos, el marco temporal del gráfico MÁS el marco temporal más alto: MOSTRANDO ZONAS ANIDADAS. A todos
Easy By Sell is a market indicator for opening and closing positions. It becomes easy to track market entries with alerts. It indicates trend reversal points when a price reaches extreme values ​​and the most favorable time to enter the market. it is as effective as a Fibonacci to find a level but it uses different tools such as an algorithm based on ATR indicators and Stochastic Oscillator. You can modify these two parameters as you wish to adapt the settings to the desired period. My othe
TPA True Price Action indicator reveals the true price action of the market makers through 100% non-repainting signals strictly at the close of a candle! TPA shows entries and re-entries, every time the bulls are definitely stronger than the bears and vice versa. Not to confuse with red/green candles. The shift of power gets confirmed at the earliest stage and is ONE exit strategy of several. There are available now two free parts of the TPA User Guide for our customers. The first "The Basics"
Bill Williams Advanced
Siarhei Vashchylka
5 (5)
Bill Williams Advanced is designed for automatic chart analysis using Bill Williams' "Profitunity" system. The indicator analyzes four timeframes at once. Manual (Be sure to read before purchasing) Advantages 1. Automatically analyzes the chart using the "Profitunity" system of Bill Williams. The found signals are placed in a table in the corner of the screen. 2. Equipped with a trend filter based on the Alligator indicator. Most of the system signals are recommended to be used only accordi
¡La mejor solución para cualquier operador novato o experto! Este indicador es una herramienta única, de alta calidad y asequible porque hemos incorporado una serie de características propias y una nueva fórmula. ¡Con sólo UN gráfico puede leer la Fuerza de la Divisa para 28 pares de Divisas! Imagínese cómo mejorará su operativa porque podrá señalar el punto exacto de activación de una nueva tendencia o de una oportunidad de scalping. Manual del usuario: haga   clic aquí Ese es el primero
Introducing the South African Sniper indicator created by a small group of traders with a few years trading trading the financial market profitably . This is a plug and play indicator that provides you with  BUY and SELL (SNIPER ENTRY) signals with TARGET and trail stops. The indicator Works with all MT5 trading instruments. The indicator uses previous  chart data as receipt to speculate on future market moves.  "The South African Sniper indicator community are very happy with the indicator an
AW Prime Oscillator MT5
AW Trading Software Limited
Una combinación de dos osciladores. El primero muestra los puntos de entrada, el segundo muestra la tendencia actual. El indicador puede mostrar señales de oscilador mediante flechas en dos modos, todas señales de oscilador rápido o señales solo en la dirección de la tendencia actual. Tiene un panel de múltiples períodos de tiempo y tres tipos de notificaciones de señales. Beneficios: Adecuado para operaciones intradía y especulación. Filtrado de tendencias Configuración sencilla y sensible Pane
IX Power MT5
Daniel Stein
5 (3)
IX Power   lleva por fin la insuperable precisión de FX Power a los símbolos que no son de Forex. Determina con exactitud la intensidad de las tendencias a corto, medio y largo plazo de tus índices, acciones, materias primas, ETF e incluso criptodivisas favoritas. Puede   analizar todo lo   que su terminal le ofrece. Pruébalo y experimenta cómo   tu timing mejora significativamente   a la hora de operar. Características principales de IX Power Resultados de cálculo 100% precisos y sin rep
** All Symbols x All Timeframes scan just by pressing scanner button ** ***Contact me after purchase to send you instructions and add you in "123 scanner group" for sharing or seeing experiences with other users. After 17 years of experience in the markets and programming, Winner indicator is ready. I would like to share with you! Introduction The 123 Pattern Scanner indicator with a special enhanced algorithm is a very repetitive common pattern finder with a high success rate . Interestingly,
Este indicador es una herramienta de transacción única, de alta calidad y asequible porque hemos incorporado una serie de características propias y una fórmula secreta.   Con solo un gráfico, da Alertas para los 28 pares de divisas.   ¡Imagina cómo mejorarás porque puedes identificar el punto de activación exacto de una nueva tendencia u oportunidad de crecimiento! Basado en   nuevos algoritmos subyacentes , hace que sea aún más fácil identificar y confirmar   operaciones potenciales . Esto se d
**   All Symbols   x   All Timeframes   scan just by pressing scanner button ** *** Contact me after the purchase to send you instructions and add you in "Trend Reversal group" for sharing or seeing experiences with other users. Introduction: Trendlines are the most famous technical analysis in trading . Trendlines continually form on the charts of markets across all the different timeframes providing huge opportunities for traders to jump in and profit on the action. In the other hand,  The tre
Otros productos de este autor
Trend Line1
Zhi Xian Hou
5 (3)
Indicator Introduction: The indicator comes from network ,It is more stable relative to RSI or CCI. You can set the indicator to send emails/notifications/alerts when the previous bar has an up or down arrow, you can specify the text of emails by inputing string into the parameter box of  "UpMessages/DownMessages". It can be used to analyze market trend and design new expert that is based on trend. If the indicator below the axis ,this is a buy zone. The trend indicator is suitable for M1 and ab
FREE
Indicator introduction: The indicator is calculated by volumes and prices, It is a single side indicator, only has up arrow signals. It is better to use it in conjunction with other trend indicators, and you need to find the most efficient time to use it in order to acquire a high winning probability. The indicator can send emails, alerts and notifications to you when the indicator before k line has an up arrow. The indicator's parameters can be changed, including the computation period of the
FREE
Indicator introduction: The indicator draws wave lines and histograms, It has small price lag, and the signal will not drift. The indicator can send emails, alerts and notifications to you when previous k line has an up arrow and it is under the histogram sections or it has a down arrow. you can choose whether or not to send the two kind of alerts, the alerts repetition times can also be changed. If the indicator appears red and green histograms, this is a buy zone. It can be used to analyze mar
FREE
Introducción del indicador: El indicador dibuja la línea de tendencia y el histograma, tiene un pequeño retraso en el precio y no tiene funciones futuras, las señales no se desviarán. Cuando el mercado está bajo oscilaciones entre áreas, si el indicador aparece histograma rojo y verde, esta es una zona de precio bajo, si el indicador aparece histograma magenta y amarillo, esta es una zona de precio alto. También se puede utilizar para analizar la tendencia del mercado según la zona de precio
FREE
The Waterfall Trend Indicator MT5 uses line regression algorithm, using "Waterfall" in its name is in that it like waterfall when there is a strong down market trend. The indicator draws seven lines, one of which is sold line, others are dash line, the sold line is more stable. Indicator introduction  The indicator can effectively filter price noise since it is calculated with line regression. It can be used to analyze market trend and design new expert that is based on trend. When the trend lin
Advanced Trader MT5 is a fully automated trading robot developed by using custom indicator "Trend for MT5", which can be found here . The expert has been tested on AUDNZD、NZDCAD、AUDCAD and USDCHF using historical data of many years, you can also test it using real ticks history data on MT5 backtest platform. Even if you don't want to 100% automatically trade by it, you can still use it as a good tool for trading, there is parameters for you to control the EA trading and use it as a trade assist
GOLD EA MT5 es un robot comercial completamente automatizado, que se desarrolla utilizando el indicador "Trend for MT5". Se basa en el sistema de red neuronal + cuadrícula, selecciona oportunidades comerciales con alta probabilidad de ganancias y bajo riesgo. El depósito inicial mínimo es de 250 USD por 0,01 lotes iniciales, cada posición tiene un stop loss oculto. EA tiene buenos resultados en XAUUSD y la reducción máxima es relativamente baja. Puede usar una prueba retrospectiva de precio abi
Indicator introduction:  A channel and trend line indicator, which is a good tool for manual trading, and also can be used for creating new EAs, without drifting or repainting.  It applies to any timeframes and any symbols.   The work of the indicator is shown in the screenshots. For any novice and programming trading friend, you can write the signal into the EA to play freely, buffer 0 corresponds to the bold trend line, buffer 4 and 5 respectively corresponds to the channel's upper and lower f
Filtro:
No hay comentarios
Respuesta al comentario