Heikin Ashi Dashboard
- Indicadores
- Taras Slobodyanik
- Versión: 2.40
- Actualizado: 14 marzo 2024
- Activaciones: 10
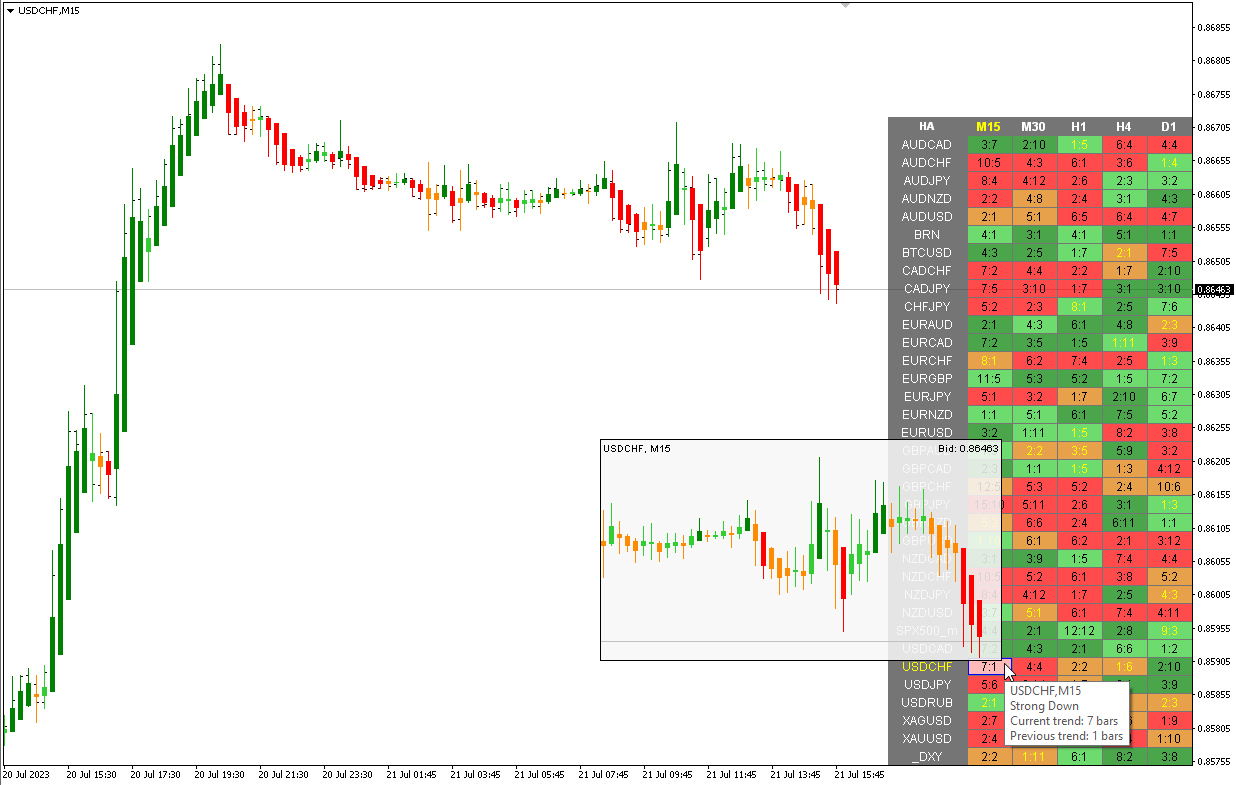
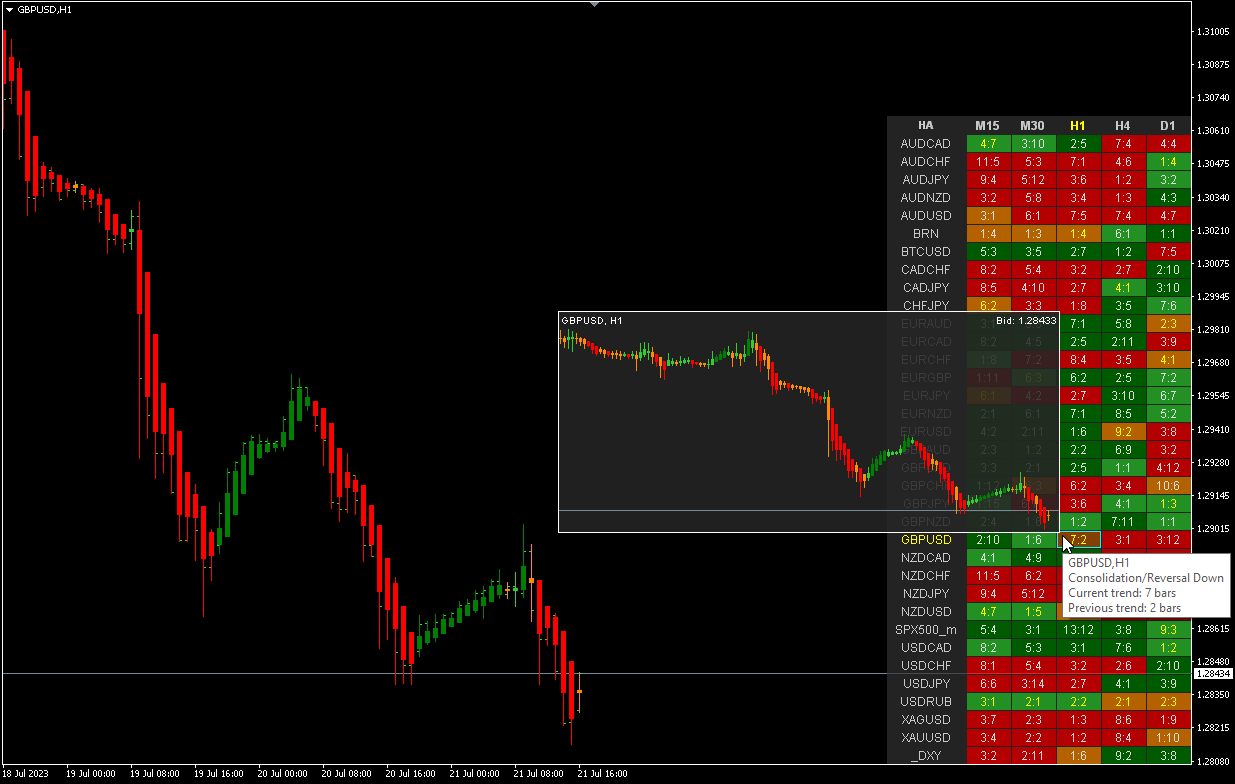
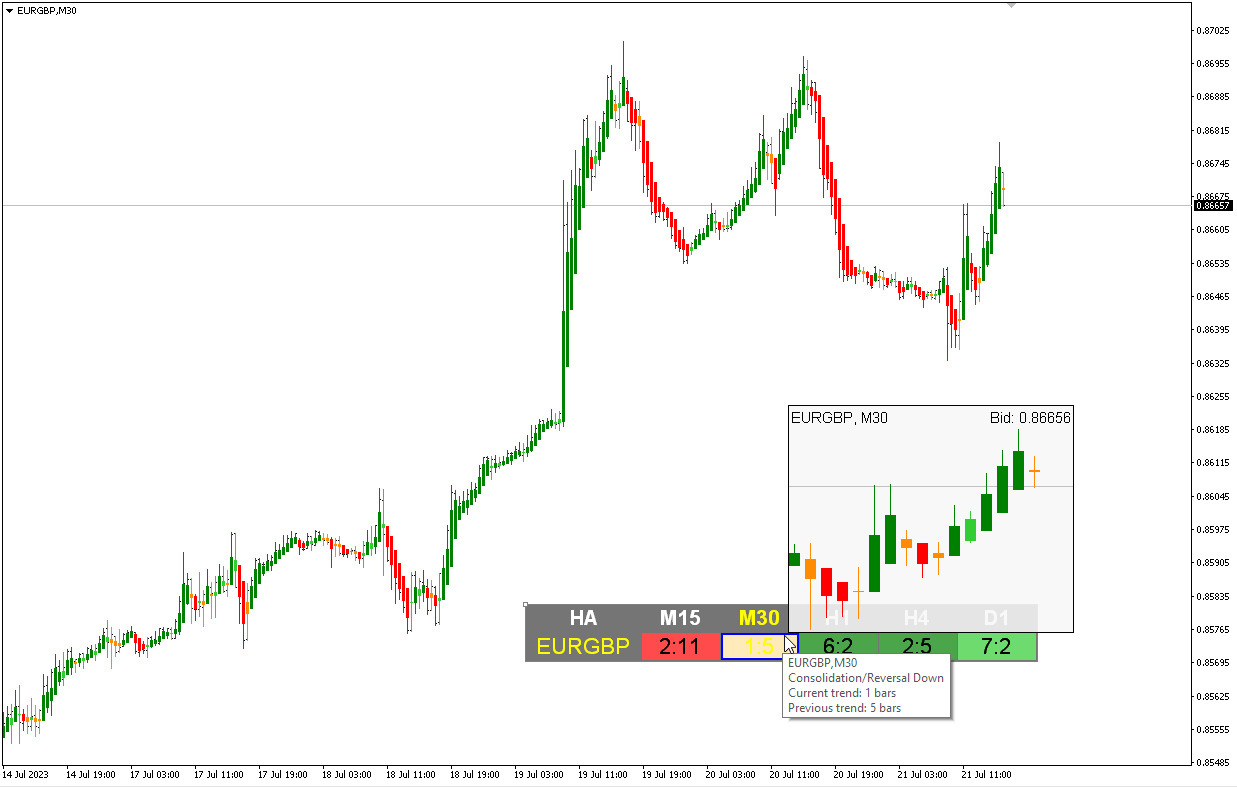
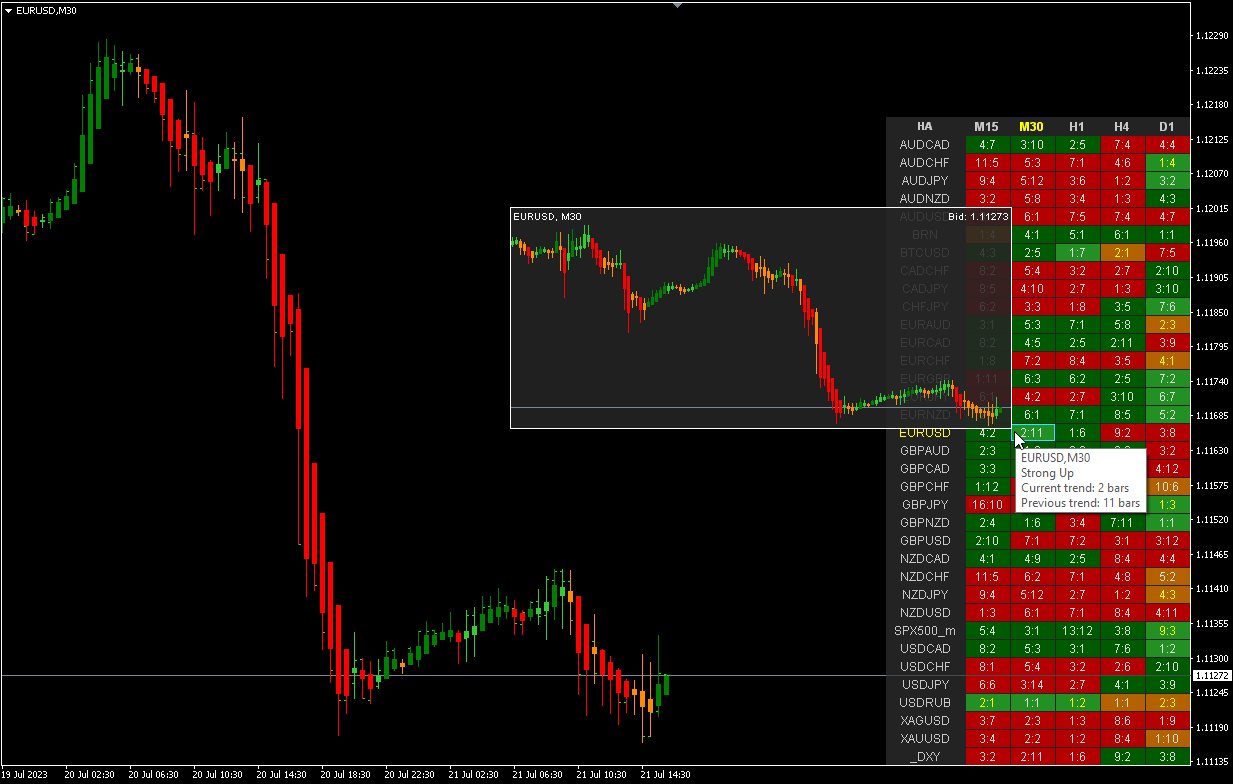
Indicador Heikin Ashi multidivisa y multiplazo. Muestra el estado actual del mercado. En el panel del escáner puede ver la dirección, la fuerza y el número de barras de la tendencia actual. Las velas de Consolidación/Reversión también se muestran usando colores. Puede especificar las monedas y períodos que desee en los parámetros. Además, el indicador puede enviar notificaciones cuando cambia la tendencia o cuando aparecen velas de reversión y consolidación (dojis). Al hacer clic en una celda, se abrirá este símbolo y punto. Este es el escáner MTF.
Heikin-Ashi es un indicador comercial y un gráfico financiero japonés que significa "ritmo promedio". Los gráficos Heikin-Ashi se parecen a los gráficos de velas, pero tienen una apariencia más suave ya que rastrean una variedad de movimientos de precios, en lugar de seguir cada movimiento de precios como ocurre con las velas. Heikin-Ashi fue creado en el siglo XVIII por Munehisa Homma, quien también creó el gráfico de velas. Los comerciantes e inversores utilizan estos gráficos para ayudar a determinar y predecir los movimientos de precios.
Parámetros
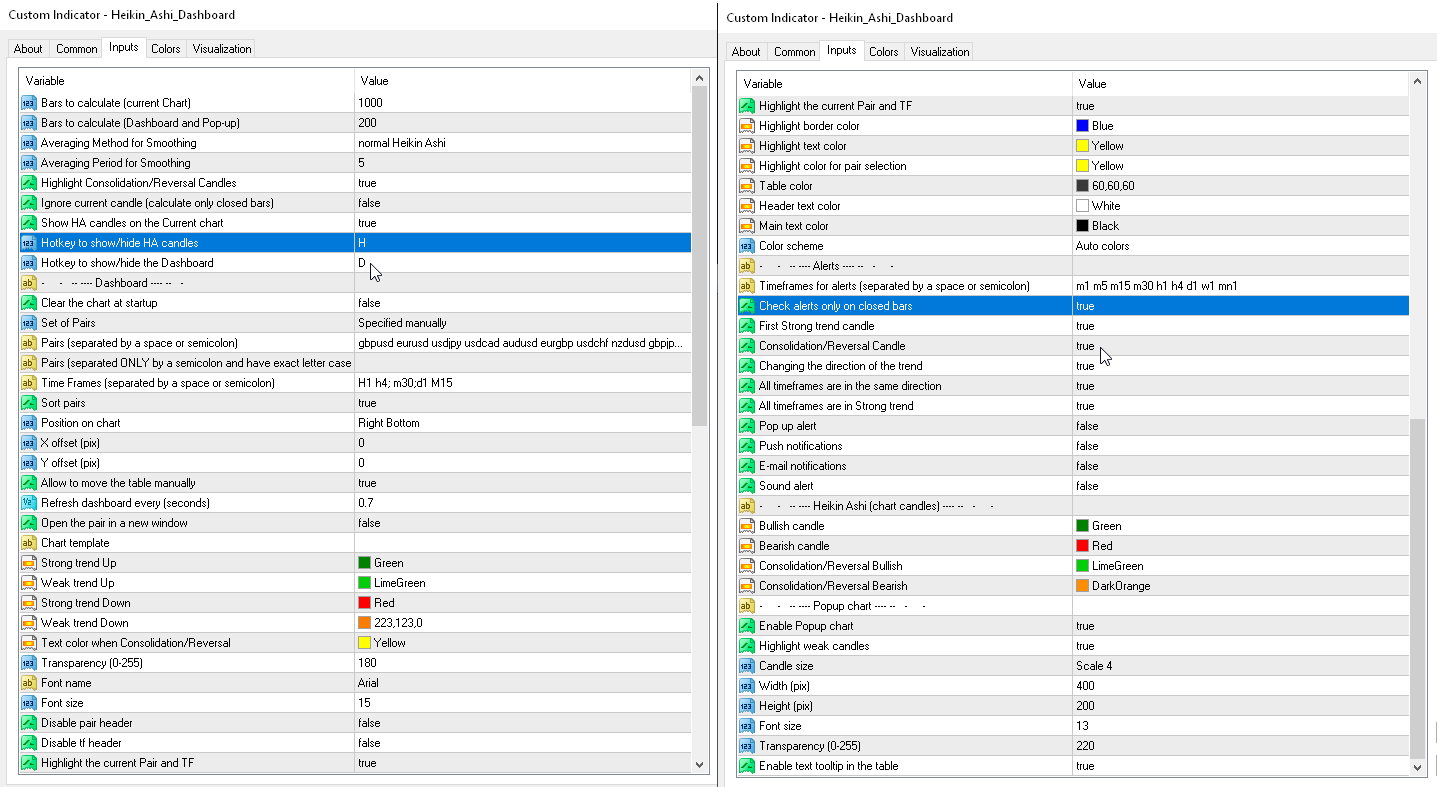
- Averaging Method for Smoothing — selección de un método para suavizar los precios de las velas.
— Simple MA — MA simple
— Exponential MA — MA exponencial
— Smoothed MA — MA suavizado
— Linear weighted MA — MA ponderada lineal
— normal Heikin Ashi — Heikin Ashi normal
- Averaging Period for Smoothing — selección del período de suavizado.
- Ignore current candle (calculate only closed bars) — deshabilita la visualización de la vela actual (no cerrada).
- Show HA candles on the current chart — las velas Heiken Ashi se dibujarán en el gráfico actual.
- Show Consolidation/Reversal Candles (Doji) — Mostrar velas de consolidación/inversión (Doji).
- Doji. Body length to the Candle length ratio, % (body<=%) — el parámetro establece el tamaño del cuerpo de la vela como un porcentaje relativo al tamaño de toda la vela. El cuerpo debe ser <= a este porcentaje.
- Doji. Wick length to the Candle length ratio, % (each wick>=%) — el parámetro establece el tamaño de las mechas superior e inferior como porcentaje, en relación con el tamaño de toda la vela. Cada mecha debe ser >= a este porcentaje.
- Hotkey to show/hide HA candles — Tecla de acceso rápido para mostrar/ocultar velas HA.
- Hotkey to show/hide the Dashboard — Tecla de acceso rápido para mostrar/ocultar el Panel de control.
Panel
Clear the chart at startup — borre el gráfico al inicio.
Set of Pairs — conjunto de símbolos
— Market Watch — pares de "Market Watch".— Specified manually — pares especificados manualmente, en los parámetros "Pares".— Current pair — muestra solo el par actual.
Pairs (separated by a space or semicolon) — lista de símbolos separados por espacios o punto y coma. Los nombres de las monedas deben escribirse exactamente igual que los del bróker, manteniendo las mayúsculas y minúsculas y el prefijo/sufijo.
Time Frames (separated by a space or semicolon) — lista de períodos de tiempo separados por espacios o punto y coma (marcos de tiempo múltiples).
Sort pairs — ordenar la lista de pares.
Position on chart — esquina para mostrar el panel en el gráfico.
X offset (pix) — desplaza el panel a lo largo del eje X;
Y offset (pix) — desplaza el panel a lo largo del eje Y;
Refresh dashboard every (seconds) — período de actualización para todos los pares y períodos de tiempo.
Open the pair in a new window — abra un símbolo en una nueva ventana del gráfico haciendo clic.
Chart template — el nombre de la plantilla del gráfico, si el gráfico se abre en una ventana nueva.
Strong trend Up — color para una fuerte tendencia alcista.
Weak trend Up — color para una tendencia alcista débil.
Strong trend Down — color para una fuerte tendencia bajista.
Weak trend Down — color para una tendencia bajista débil.
Text color when Consolidation/Reversal — resalte el color (y las velas en el gráfico) para las barras de consolidación/reversión.
Transparency (0-255) — Transparencia (0-255).
Font name — Nombre de la fuente.
Font size — Tamaño de fuente.
Alertas
Timeframes for alerts (separated by a space or semicolon) — Plazos de alertas (separados por un espacio o punto y coma).
Check alerts only when the candle is closed — Consulta las alertas solo cuando la vela esté cerrada.
First Strong trend candle — alerta de la primera vela de tendencia fuerte.
Consolidation/Reversal Candle — alerta cuando aparece una vela de consolidación/reversión.
Changing the direction of the trend — una alerta cuando cambia la dirección de la tendencia.
All timeframes are in Strong trend — estas alertas se envían una vez por barra de acuerdo con el período de tiempo mínimo en el panel. No miran el parámetro "Plazos de alertas".
All timeframes are in the same direction — estas alertas se envían una vez por barra de acuerdo con el plazo mínimo en el panel. No miran el parámetro "Plazos de alertas".
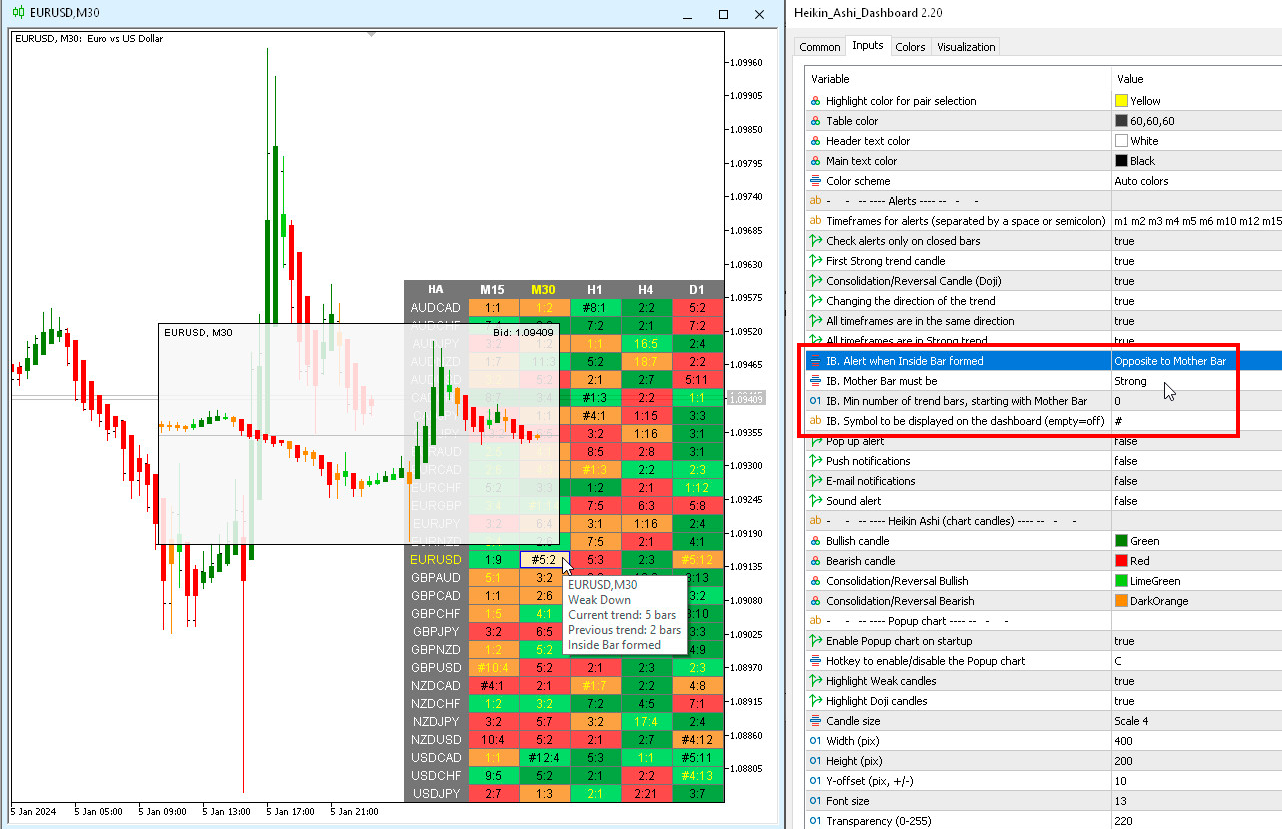
IB. Alert when Inside Bar formed — BI. Alerta cuando se formó Inside Bar.
IB. Mother Bar must be — BI. El Bar Madre debe serlo.
IB. Min number of trend bars, starting with Mother Bar — BI. Número mínimo de barras de tendencia, comenzando con la barra madre.
IB. Symbol to be displayed on the dashboard (empty=off) — BI. Símbolo que se mostrará en el tablero (vacío=apagado).


Ich habe den Dashboard am Mittwoch gekauft und Nachmittag wenn die Amis eröffnen auspropiert, muss schon sagen alle Achtung ,habs auf dem Demokonto 2 Tage getestet , hat sehr gute Ergebnisse. Am Freitag Morgen bin ich dann auf dem Realkonto mit 3Trades jeweils im Tageschart eingestiegen und alle 3waren im Gewinn. Super ich bin beeindruckt.