• Información general
  • Comentarios (2)
  • Discusión
  • Novedades

TradeighT

⭐ La herramienta identifica el movimiento real que utiliza el mercado, con cálculos matemáticos reales basados en los cambios de precios.

⭐ La ejecución de Tradeight se basa en esta relación matemática que siempre existió.

⭐ La mayoría de los traders miran las mismas cosas y estudian la misma información, razón por la cual la mayoría pierde dinero.

⭐ Es un producto basado no en las ideas de la mayoría sino en los 4 fundamentos reales que rigen el mercado.

⭐ La herramienta es una herramienta visual, fácil de entender y simple de usar, disponible para todos los símbolos que se pueden probar en retrospectiva.

Exclusivamente para MT4.


El indicador utiliza altos niveles de precios de reacción:

 Proporciona los precios actuales de toma de ganancias

 Proporciona niveles para usar con el método de acción del precio, análisis técnico / gráfico

 Proporciona zigzag

 Proporciona la tendencia actual

 Proporciona objetivos de precios con un alto % de éxito

 ________________________________________________________________________________________________________________________________________________

MÉTRICAS GENERALES

Cada número está vinculado a una vela.

Cada número tiene su propia línea de tendencia horizontal no permanente.

Cada línea de tendencia horizontal no permanente tiene su propia línea de tendencia vertical.

Cuando la línea de tendencia horizontal no permanente es tocada por el precio, desaparece.

Cuando desaparece una línea de tendencia horizontal no permanente, el número y la línea de tendencia vertical vinculadas a esa línea de tendencia horizontal no permanente desaparecerán.

Si una línea de tendencia horizontal no permanente desaparece antes de ser tocada por el precio, aparecerá una nueva línea de tendencia horizontal no permanente con el siguiente número en la dirección opuesta.

________________________________________________________________________________________________________________________________________________

TRENDLINE(seleccionable)

Compra de línea de tendencia horizontal no permanente (mql5.com)
  • numerados del 1 al 5
  • color editable desde Propiedades del indicador
  • precio que se utilizará como TP en una orden de compra


Venta de línea de tendencia horizontal no permanente (mql5.com)
  • numerados del 1 al 5
  • color editable desde Propiedades del indicador
  • precio que se utilizará como TP en una orden de venta


Línea de tendencia permanente horizontal (mql5.com)

  • para ser utilizado como soporte o resistencia


Línea de tendencia vertical (mql5.com)

  • que se utilizará como referencia temporal para el inicio de una línea de tendencia horizontal no permanente

________________________________________________________________________________________________________________________________________________

LÍNEAS VERTICALES (Propiedad del indicador: Modo)

1.

Compra de Línea Vertical (mql5.com)

  • color de la Línea de Tendencia Horizontal No Permanente Comprar
  • destaca el número de la compra de la línea de tendencia horizontal no permanente
  • Tendencia en una dirección a largo plazo


Venta de línea vertical (mql5.com)

  • color de la Venta de la Línea de Tendencia Horizontal No Permanente
  • resalta el número de la venta de la línea de tendencia horizontal no permanente
  • Tendencia en una dirección corta


2.

Línea vertical

  • color de la línea de tendencia permanente horizontal
  • resalta el número de la línea de tendencia horizontal no permanente

________________________________________________________________________________________________________________________________________________

SEÑALES

1.

Si la línea de tendencia vertical de la vela actual está conectada con:

  • Línea de tendencia horizontal no permanente con el número 1 resaltado por la línea vertical presente en la vela anterior a la actual
  • Línea de tendencia horizontal no permanente con el número 2 resaltado por la línea vertical
  • Línea de tendencia horizontal no permanente con el número 3 resaltado por la línea vertical

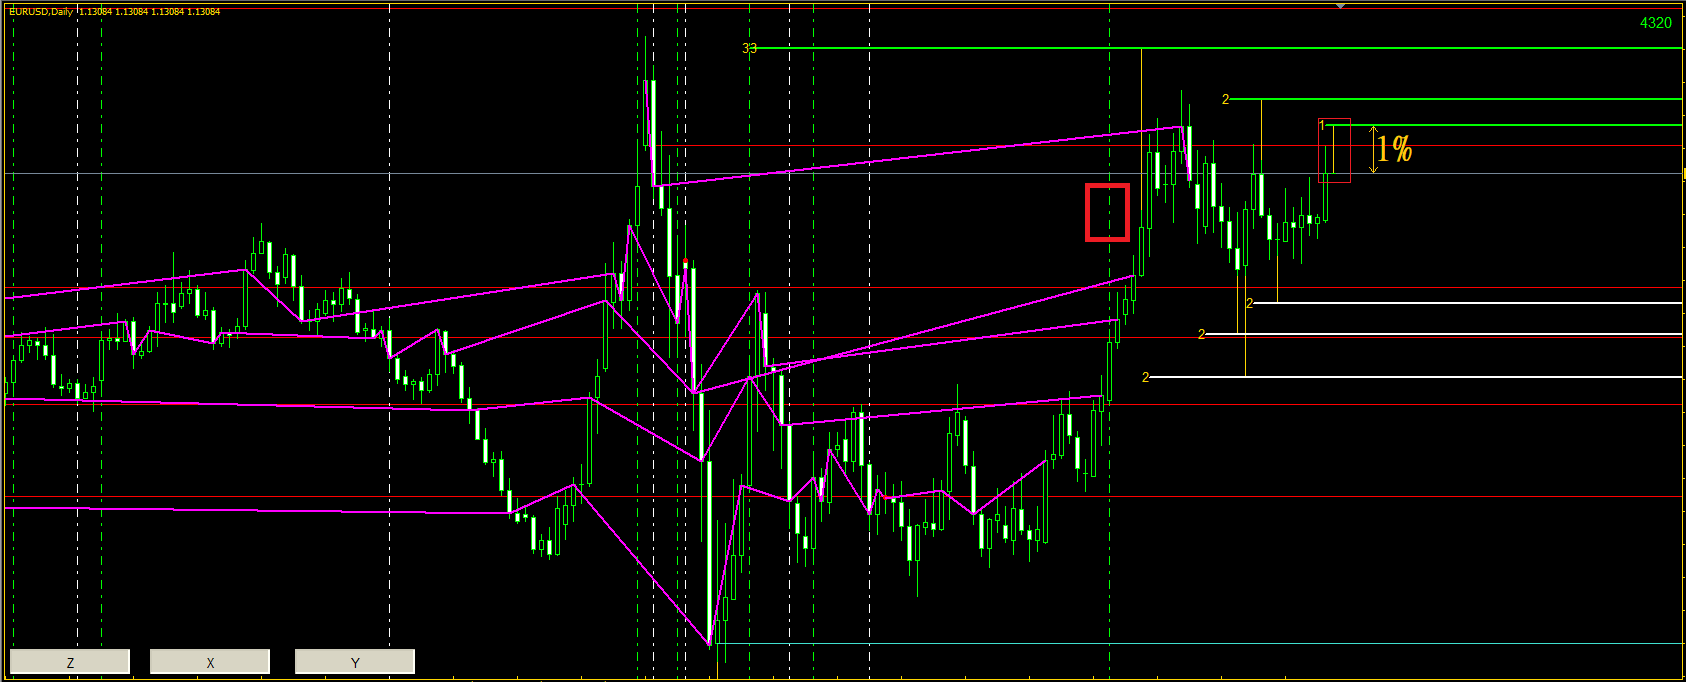
Utilice el precio de la línea de tendencia horizontal no permanente con el número 3 resaltado por la línea vertical, como objetivo.

En caso de que la línea de tendencia horizontal no permanente con el número 3 desaparezca antes de que haya sido tocada por el precio,

elija si desea cambiar la dirección de la inversión utilizando la línea de tendencia horizontal no permanente con el siguiente número o abortar la inversión.

Ver ejemplos en imágenes.

  1. Abra una posición con 0.01(1000) en la dirección elegida
  2. Introduzca como precio en beneficio⟶ el precio de la línea de tendencia elegida.
  3. Vea el valor monetario del movimiento con 0.01
  4. Elija el tamaño de la inversión de acuerdo con el tamaño del movimiento


2.

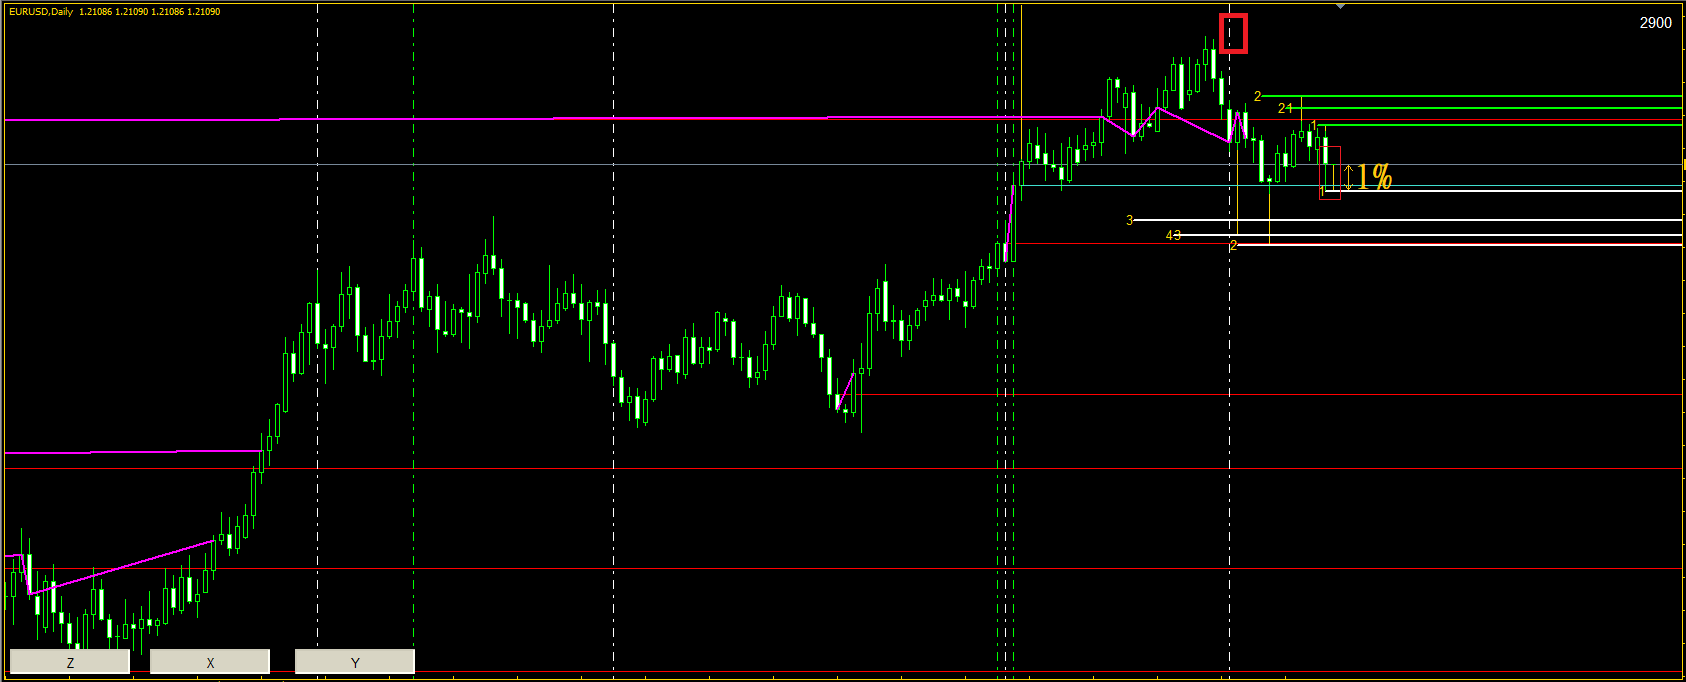
Utilice el precio de la línea de tendencia horizontal no permanente resaltada por la línea vertical como objetivo.

En caso de que la línea de tendencia horizontal no permanente elegida desaparezca antes de que haya sido tocada por el precio,

elija si desea cambiar la dirección de la inversión utilizando la línea de tendencia horizontal no permanente con el siguiente número o abortar la inversión.

Ver ejemplos en imágenes.

  1. Abra una posición con 0.01(1000) en la dirección elegida
  2. Introduzca como precio en beneficio de⟶ el precio de la línea de tendencia elegida.
  3. Vea el valor monetario del movimiento con 0.01
  4. Elija el tamaño de la inversión de acuerdo con el tamaño del movimiento

________________________________________________________________________________________________________________________________________________

CONFIGURACIÓN

Posibilidad de activar y desactivar objetos, antes del backtest desde las propiedades del indicador, después y durante el backtest a través de los botones del gráfico:
  • X = Línea de Tendencia Permanente Horizontal
  • Y = Línea vertical
  • Z = ZigZag


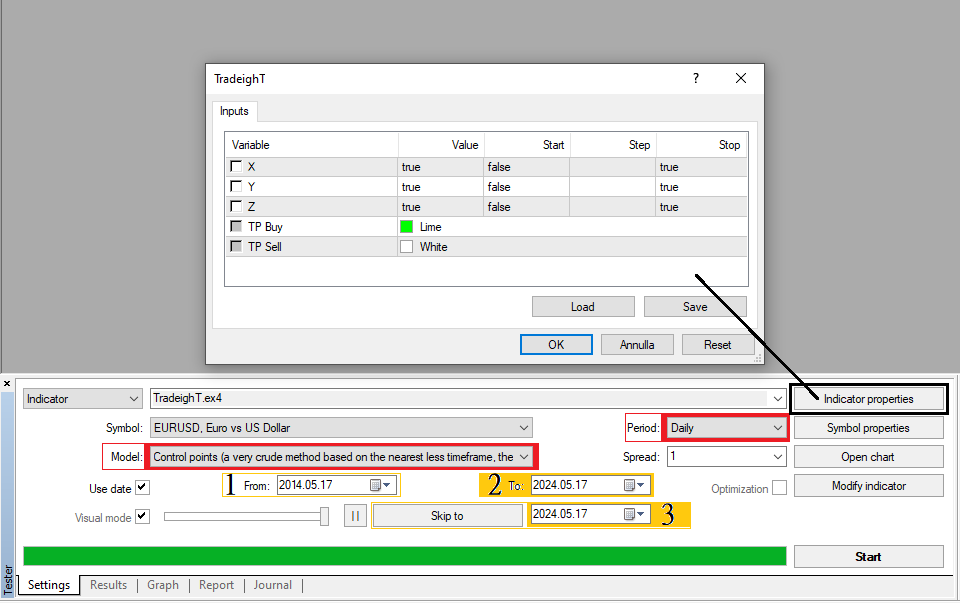
Posibilidad de elegir el tipo de Líneas Verticales antes del backtest, desde Propiedades del Indicador:

  • Y. = 1 : Compra de línea vertical , Línea vertical Sell
  • Y. = 2 : Línea vertical

Para tener la misma plantilla en cada backtest, abra un nuevo símbolo, cambie los colores y las características, y guarde la plantilla como tester.tpl

Para un análisis completo, utilice 10 años antes de la fecha actual como fecha de inicio de la prueba retrospectiva.

Agregue 1 mes más a la fecha actual y utilícela como fecha de finalización de la prueba retrospectiva.

Para acelerar el backtest, presione el botón Saltar a e ingrese la fecha igual a la fecha de finalización del backtest.

Consulte las imágenes para obtener más detalles.

________________________________________________________________________________________________________________________________________________


💬 https://t.me/

                           +bv7-BurLDeEwZDM0


Productos recomendados
Smooth price for Monarch MT4
Konstantin Gruzdev
3.67 (3)
The Smooth Price technical indicator is used for plotting a smoothed line as close to the price of the financial instrument as possible, and serves to eliminate its noise components. The indicator is part of the Monarch trading system, but here it is presented as an independent technical analysis tool. The indicator is based on the cluster digital filter , which, unlike the ClusterSMA , is applied directly to the price time series. Smooth Price does not redraw (except the very last, zero bar) an
Infinity Trend Pro
Yaroslav Varankin
1 (1)
This is a trend indicator without redrawing Developed instead of the binary options strategy (by the color of the Martingale candlestick) Also works well in forex trading When to open trades (binary options) A signal will appear in the place with a candle signaling the current candle It is recommended to open a deal for one candle of the current timeframe M1 and M5 When a blue dot appears, open a deal up When a red dot appears, open a trade down. How to open trades on Forex. When a signal is rec
Introduction It is common practice for professional trades to hide their stop loss / take profit from their brokers. Either from keeping their strategy to the themselves or from the fear that their broker works against them. Using this indicator, the stop loss / take profit points will be drawn on the product chart using the bid price. So, you can see exactly when the price is hit and close it manually.  Usage Once attached to the chart, the indicator scans the open orders to attach lines fo
VR Cub
Vladimir Pastushak
VR Cub es un indicador para obtener puntos de entrada de alta calidad. El indicador fue desarrollado para facilitar los cálculos matemáticos y simplificar la búsqueda de puntos de entrada a una posición. La estrategia comercial para la cual se diseñó el indicador ha demostrado su eficacia durante muchos años. La simplicidad de la estrategia comercial es su gran ventaja, que permite que incluso los operadores novatos negocien con éxito con ella. VR Cub calcula los puntos de apertura de posiciones
The indicator of a Professional Trader is an arrow indicator for predicting the direction of price movement. I have been working on this indicator since 2014. You can use this indicator as your main indicator, use its entry signals, and use it as your only indicator to find entry points. About the product: Recommended TF [H4-D1-W1]   . The indicator predicts the direction of the next candle. Fits a variety of tools; Flexibility in settings for different instruments and intervals through the
5 signal in 1  Product     TimeFrame   Recommend   1m-5m recommend  signal   TF  5m    Banks Pro Binary Option is Indicator for binary option Can Use Manaul Trade or Robot on Platform  Mt2Trading  https://www.mt2trading.com/?ref=104    Time Trading   good work  EU session    Recommend  Curency   EUR  GBP USD        careful   AUD JPY      Recommend  Martingale 2-5 Step   Recommend  set profit  2%-5%/Day Setting Brake  News Event High volatility   recommend  15-30 min Have Problem Contract
Diamond PRO
Fanur Galamov
5 (9)
Diamond PRO is enhanced powerful version of Diamond for advanced traders. Pro version includes optimized cores, new impoved entry points filters, new multistage profit closure algorithm and сontains number of external control parameter that allows build and fine tune own tradind decisions and algorithms. The system provides more accurate market entries, analyzes and filters upcoming economic news, contains spread protection and an advanced position management algorithm. Main goal of Diamond PRO
Black series MT4
Dmitriy Kashevich
1 (1)
Black series MT4 - The indicator is designed for trading on binary options with Timeframe M1-M5-M15 Multicurrency (Works on cryptocurrency and currency pairs) The signal appears when the candle opens Up to 90% correct signals There is no signal redrawing at all Can be used with other indicators. Good for scalping! In Settings there is: -Indicator working methods -I Allert Arrow color Red signal down Blue signal up Also watch the video how the indicator works and signals
Strength and weakness of currencies : Shows the currency status at any time, values between 50 and -50 are neutral, everything outside indicates a trend change  Waves : Current state of waves, daily, weekly monthly and yearly Recommended volume for trading a specific number of waves Yearly High Low Drawn waves on which the market will react in advance, without redrawing Yearly candle with bonus levels used to display deviations  For more info contact me
Matrixs
Andriy Sydoruk
Matrix is a Forex arrow indicator. Displays signals simply and clearly! The arrows show the direction of the transaction, and are colored accordingly, which can be seen in the screenshots. As you can see, trading with such an indicator is easy. I waited for an arrow to appear in the desired direction - I opened a deal. An arrow formed in the opposite direction - closed the deal. The indicator also displays the lines with the help of which the arrow signals are formed, taking into account the int
This indicator is, without a doubt, the best variation of the Gann Angles among others. It allows traders using Gann methods to automatically calculate the Gann angles for the traded instrument. The scale is automatically calculated when the indicator is attached to the chart. When switching timeframes, the indicator recalculates the scale for the current timeframe. Additionally, you can enter your own scales for the Gann angles. You can enter your own scales either for both vectors or for each
Mast
Sergei Zakhariia
The MT4 trend arrow indicator is a powerful tool for technical analysis that will help traders determine the direction of the trend in financial markets. This indicator is based on the use of several mathematical algorithms and methods of price analysis, which allows you to give accurate and transparent signals to enter the market. The working timeframe is H1.  The description of the indicator includes up and down arrows that indicate the future direction of price movement. In addition, the
WanaScalper MT4
Isaac Wanasolo
1 (1)
A scalping indicator based on mathematical patterns, which on average gives signals with relatively small SL, and also occasionally helps to catch big moves in the markets (more information in the video) This indicator has three main types of notifications: The first type warns of a possible/upcoming signal on the next bar The second type indicates the presence of a ready signal to enter the market/open a position The third type is for SL and TP levels - you will be notified every time price r
Limitless MT4
Dmitriy Kashevich
El MT4 ilimitado es un indicador universal adecuado para todos los operadores principiantes y experimentados. funciona en todos los pares de divisas, criptomonedas, acciones en bruto MT4 ilimitado: ya está configurado y no requiere configuración adicional Y ahora lo principal ¿Por qué MT4 ilimitado? 1 falta total de redibujo 2 dos años de pruebas por los mejores especialistas en comercio 3 la precisión de las señales correctas supera el 80% 4 tuvo un buen desempeño en el comerci
Daily Candle Predictor es un indicador que predice el precio de cierre de una vela. El indicador está destinado principalmente para su uso en gráficos D1. Este indicador es adecuado tanto para el comercio de divisas tradicional como para el comercio de opciones binarias. El indicador se puede utilizar como un sistema de negociación independiente o puede actuar como una adición a su sistema de negociación existente. Este indicador analiza la vela actual, calculando ciertos factores de fuerza dent
Sto Signal AM
Andriy Matviyevs'kyy
This indicator displays Stochastic osc signals on the price chart and allows the user to receive notifications of such signals. The Stochastic indicator is a classic and proven indicator of the technical analysis of the markets. Despite its age, it is still relevant today. Depending on the settings, the indicator allows you to work effectively on various TFs and any markets. Signals are given on fully formed bars and are not redrawn. Custom Parameters: Stochastic_Price (0-1) - The applied pric
FREE
A Boss Stats
Anthonius Soruh
Hi Trader, We are strategy development for Binary and Forex tools, our product have success for binary trading 1 min - 2 min experation. At the moment I build indicator for trading all day, not like Bonosu series with specific time. We launch A-Boss Stats Indicator for trading 1 minute to 5 minutes experation is mean can trade from 1 minutes - 5 minutes. Specification of A Boss Stats trading binary option: Work with all MT4 broker. Chart Time Frame M1 only, can use M5 Experation time for contact
Towers
Yvan Musatov
Towers - Trend indicator, shows signals, can be used with optimal risk ratio. It uses reliable algorithms in its calculations. Shows favorable moments for entering the market with arrows, that is, using the indicator is quite simple. It combines several filters to display market entry arrows on the chart. Given this circumstance, a speculator can study the history of the instrument's signals and evaluate its effectiveness. As you can see, trading with such an indicator is easy. I waited for an a
The indicator allows you to trade binary options. The recommended time frame is М1 and the expiration time is 1,2,3 minutes. The indicator suitable for auto and manual trading. A possible signal is specified as a arrows above/under a candle. You should wait until the candle closes! Arrows are not re-painted Trade sessions: TOKYO section (Half-end) Currency pairs: USD/JPY Working time frame: M1 Expiration time: 1,2,3 minutes. The indicator also shows good results when using the martingale strateg
FREE
Binary Options Support Resistance Indicator This indicator is designed for binary options trading and effectively shows retracements from support and resistance levels. Signals appear on the current candle. A red arrow pointing downwards indicates a potential selling opportunity, while a blue arrow pointing upwards suggests buying opportunities. All that needs adjustment is the color of the signal arrows. It is recommended to use it on the M1-M5 timeframes as signals are frequent on these timef
Owl smart levels
Sergey Ermolov
4.63 (54)
Versión MT5  |   FAQ El   Indicador Owl Smart Levels   es un sistema comercial completo dentro de un indicador que incluye herramientas de análisis de mercado tan populares como   los fractales avanzados de Bill Williams , Valable ZigZag que construye   la estructura de onda correcta   del mercado y   los niveles de Fibonacci   que marcan los niveles exactos de entrada. en el mercado y lugares para tomar ganancias. Descripción detallada de la estrategia Instrucciones para trabajar con el indi
El indicador construye cotizaciones actuales, que se pueden comparar con las históricas y, sobre esta base, hacer un pronóstico de movimiento de precios. El indicador tiene un campo de texto para una navegación rápida a la fecha deseada. Opciones: Símbolo - selección del símbolo que mostrará el indicador; SymbolPeriod - selección del período del cual el indicador tomará datos; IndicatorColor - color del indicador; HorisontalShift: cambio de cotizaciones dibujadas por el indicador
Trend Bilio - an arrow indicator without redrawing shows potential market entry points in the form of arrows of the corresponding color: upward red arrows suggest opening a buy, green down arrows - selling. The entrance is supposed to be at the next bar after the pointer. The arrow indicator Trend Bilio visually "unloads" the price chart and saves time for analysis: no signal - no deal, if an opposite signal appears, then the current deal should be closed. It is Trend Bilio that is considered
Master Scalping M1 es un indicador innovador que utiliza un algoritmo para determinar la tendencia de forma rápida y precisa. El indicador calcula el tiempo de apertura y cierre de posiciones, los algoritmos del indicador le permiten encontrar los momentos ideales para ingresar a una operación (comprar o vender un activo), lo que aumenta el éxito de las transacciones para la mayoría de los comerciantes. Beneficios del indicador: Fácil de usar, no sobrecarga el gráfico con información innecesari
The Chaikin Oscillator is a technical indicator developed by Marc Chaikin that combines price and volume data to measure the accumulation and distribution of a financial instrument. It aims to identify potential buying and selling opportunities in the market. The Chaikin Oscillator is calculated by subtracting a 10-day exponential moving average of the Accumulation Distribution Line (ADL) from a 3-day exponential moving average of the ADL. Here's how to use the Chaikin Oscillator indicator in tr
Fourteen plus nine TD Sequential
MOHAMMED IMAD HUSSEIN BASSEE
Fourteen plus nine What is it for? Applying Tom DeMark’s TD Sequential serves the purpose of identifying a price point where an uptrend or a downtrend exhausts itself and reverses. . What are the main components of TD Sequential? TD Sequential has two parts – TD Setup and TD Countdown. The first phase of TD Sequential starts with a TD Setup and is completed with a 9 count. When the 9 count is completed, it is at that point, a price pause, price pullback, or reversal is likely. It is also at tha
here is a link to back test results https://youtu.be/9BYDwS9aaqM https://youtu.be/iLxh43HV91Y However, the difficult task here for traders is to understand and select the indicator or tool that can help them with their trading plan and benefit their trading style. Traders want a tool that requires minimal effort and provides as much support as it can. There are multiple reasons for which traders need an indicator. One such reason is to determine the buy-sell signals in the market. The
Este innovador indicador de medición de la fuerza de la moneda de INFINITY es un ayudante indispensable para los revendedores y comerciantes que negocian en el largo plazo. El sistema de Análisis de fortaleza / debilidad de las monedas ha sido conocido y utilizado en el mercado por los principales operadores del mundo. Cualquier comercio de arbitraje no está completo sin este análisis. Nuestro indicador determina fácilmente la fuerza de las monedas subyacentes entre sí. Muestra gráficos de líne
Witch Hat for Binary Options es un indicador para opciones binarias basado en el análisis de las Bandas de Bollinger y el RSI, utilizando una estrategia modulada con configuraciones de indicadores que utilizan filtros complejos. Este indicador nunca vuelve a pintar, tiene una respuesta casi precisa para que usted realice las entradas. Hay dos formas de analizar su entrada, cuando aparece una flecha, tiene más del 90% de posibilidades de aciertos, y la otra forma son las líneas que dibuja auto
PZ Trend Trading
PZ TRADING SLU
4.75 (4)
Trend Trading es un indicador diseñado para sacar el máximo provecho posible de las tendencias que tienen lugar en el mercado, mediante el cronometraje de retrocesos y rupturas. Encuentra oportunidades comerciales al analizar qué está haciendo el precio durante las tendencias establecidas. [ Guía de instalación | Guía de actualización | Solución de problemas | FAQ | Todos los productos ] Opere en los mercados financieros con confianza y eficiencia Aproveche las tendencias establecidas sin s
Los compradores de este producto también adquieren
Presentamos el Indicador Milagroso de Forex: Desata el Poder del Trading Preciso ¿Estás cansado de buscar el mejor indicador de Forex que realmente ofrezca resultados excepcionales en todos los marcos temporales? ¡No busques más! Ha llegado el Indicador Milagroso de Forex para revolucionar tu experiencia de trading y llevar tus ganancias a nuevas alturas. Construido sobre una base de tecnología de vanguardia y años de desarrollo meticuloso, el Indicador Milagroso de Forex se erige como el pinácu
TrendMaestro
Stefano Frisetti
5 (2)
note: this indicator is for METATRADER4, if you want the version for METATRADER5 this is the link: TRENDMAESTRO recognizes a new TREND in the bud, he never makes mistakes. The certainty of identifying a new TREND is priceless. DESCRIPTION TRENDMAESTRO identifies a new TREND in the bud, this indicator examines the volatility, volumes and momentum to identify the moment in which there is an explosion of one or more of these data and therefore the moment in which prices have strong probability of f
Candle Power Pro
Thushara Dissanayake
4.33 (6)
Libere el poder de la información de volumen real con el indicador   Candle Power Pro   . Esta herramienta dinámica captura los datos del volumen real de cada vela y los presenta como un porcentaje del volumen total. Al hacerlo, le permite discernir la lucha en curso entre compradores y vendedores en el mercado. Candle Power Pro muestra la batalla entre compradores y vendedores como un porcentaje del volumen total, brindándole información valiosa sobre la dinámica del mercado. Puede confirmar fá
Market Breaker Updated version 3
Allistair Kabelo Mandow
1 (1)
Features for software Main functions: Accurate entry signals WITHOUT REPAINTING! Once a signal appears, it remains valid! This is a significant distinction from repainting indicators that might provide a signal and then alter it, potentially leading to deposit losses. Now, you can enter the market with higher probability and precision. There's also a function to colour candles after an arrow appears until the target (take profit) is reached or a reversal signal appears . Display of STOP LOSS
Weis Wave with Alert
Trade The Volume Waves Single Member P.C.
4.79 (19)
Rental/Lifetime Package Options and Privileges' * For optimum results the yearly or lifetime package is suggested due to live training and Discord  channel trading with the  creator! Rent Monthly Six Months   Yearly/Lifetime Weis Wave with Speed with Alert+Speed Index x x x Manual  x x x Quick Set up Video x x x Blog x x x Lifetime Updates x x x Setup and Training Material x x Free Rectangle Break Alert Tool      x Discord Access Channel "The SI traders" x 2-hour live methodology traini
VTrende Pro mt4
Andrii Diachenko
3 (2)
VTrende Pro MT4 - MTF indicator for trend trading with a display panel for MT5 *** Videos can be translated into any language using subtitles (video language - Russian) Although the signals of the VTrende Pro indicator can be used as signals of a full-fledged trading system, it is recommended to use them in conjunction with the Bill Williams TS. VTrende Pro  MT4 is an extended version of the VTrende indicator. Difference between Pro version and VTrende: - Time zones - Signal V - signal 1-
Full STO
Roman Smoroda
Indicador STO completo (incluye todas las versiones de tres indicadores STO: Premium, Gold, Silver) - STABLE TRADE OPTION está diseñado para el comercio automático de opciones binarias.  ¡¡¡¡¡LEA CUIDADOSAMENTE!!!!! IMPORTANTE En un terminal cree dos plantillas con diferentes vencimientos, una plantilla para las 18:01, 18:02 con vencimientos de 1 a 15 minutos y una plantilla para las 22:00 con vencimientos de 10 a 20 minutos. Winrate: 71% en los últimos 5 años Gestión del dinero: 0,3% d
Idea: RSI ( Relative Strength Index) and CCI ( Commodity Channel Index ) are powerfull to solved the market.  This indicator has Smoothed Algorithmic signal of RSI and CCI. So that, it separates the market into buy and sell zones, these areas are marked with arrows, red for downtrend, green for uptrend. This algorithm has the effect of predicting the next trend based on the historical trend, so users need to be cautious when the trend has gone many candles. Please visit screenshots
DESCRIPTION The CHAOS INDICATOR has been developed to be used for the TRADING STRATEGY OF CHAOS, as described in the book. The book is in italian language only and can be obtained only on my website indicated below. DATAS COLLECTED AND SHOWN ON GRAPHS The CHAOS INDICATOR apply easily to any graph and any asset, and it is a TRADING FACILITATOR, as it identify immediately the following items on any graph: - The GP (= RIGHT PRICE) i.e. the price to which the asset should be attracted within 24
Gann Swing Structure
Kirill Borovskii
5 (1)
This indicator is based on the mathematics of the great trader W.D. Ganna. With its help, you can easily find strong levels by analyzing swings to find the optimal entry point. The indicator works on all instruments and all timeframes. The indicator is fully manual and has control buttons. All you need to do is press the NEW button, a segment will appear, which you can place on any movement, swing or even 1 candle that you want to analyze. By placing the segment, press the OK button. A grid (th
Gann Zone Pro
Kirill Borovskii
This indicator identifies and displays zones, as it were areas of strength, where the price will unfold. The indicator can work on any chart, any instrument, at any timeframe. The indicator has two modes. The indicator is equipped with a control panel with buttons for convenience and split into two modes. Manual mode: To work with manual mode, you need to press the NEW button, a segment will appear. This segment is stretched over the movement and the LVL button is pressed. The level is displayed
Full Forex Market View Dashboard
Opengates Success International
5 (2)
VISTA COMPLETA DEL MERCADO FOREX Indicador del tablero Este es un indicador personalizado creado para brindar a los comerciantes una visión completa de lo que está sucediendo en el mercado. Utiliza datos en tiempo real para acceder al mercado y mostrar toda la información necesaria para realizar transacciones exitosas. INSTALACIÓN: Antes de adjuntar este indicador a su gráfico de ventana, vaya al panel Market Watch de su MT4 y OCULTE todos los pares de divisas que no necesita ni opere y
The indicator is designed to work on any trading platform. The program is based on proprietary algorithms and W.D.Ganna's mathematics, allowing you to calculate target levels of price movement based on three points with the highest degree of certainty. It is a great tool for stock trading. The indicator has three buttons: NEW - call up a triangle for calculation. DEL - delete the selected triangle. DELS - completely remove all constructions. The probability of achieving the goals is more than 80
IA Trendx3 PRO
Marco Aurelio Santos Costa
What if God Created a Trade System? No miracles... Just see how mathematics can be effective in the market. We managed to combine technical analysis / price action into indicators, creating the best setup for trading, be it in Forex, Indices, or stocks. It took us 2 years to create something that really works, and now it's time for you to discover it. TrendX3 is a revolution in trend analysis. Based on advanced algorithms and real-time data, it provides valuable insights so that you can make inf
The breakout algorithm is a technique based on price, price features, to shape a breakout strategy. The strategy in this indicator will not be redrawn (none-repaint indicator), it is suitable for short or long term traders In the screenshot is the EURUSD pair, these currency pairs, commodities or stocks, it have similar strength *Non-Repainting (not redrawn) *For Metatrader4 Only *Great For Scalping *Great For Swing Trading *Arrow Entry, Green is Long, Red is Short *Works On Any Timeframe *Work
Si a menudo pierde operaciones porque solo usa un indicador, pruebe esta herramienta comercial. Esta herramienta comercial utiliza más de un indicador. A menudo observo a traders que sólo utilizan el indicador RSI. Muy a menudo el mercado está sobrevendido pero todavía está abajo o el mercado está sobrecomprado pero todavía está arriba. Por este motivo, es necesario utilizar más de un indicador. Presentamos la nueva versión V 3.40 MTF PPAAF: Flecha de acción de precio precisa de múltiples marco
Market Breaker Pro
Allistair Kabelo Mandow
PYTHONFX INCEPTION TRADING SYSTEM THE BROKERS WORST NIGHTMARE... IMPORTANT! After the purchase please send me a private message to receive the installation manual and the setup instructions. We proudly introduce the PYTHONFX ROYAL CIRCLE Inception trading system, your key to financial freedom.   This is the brokers worst nightmare. Seriously! Modern market conditions require modern solutions & if you are still struggling to analyse the charts and struggling to find consistency in the
"Dragon's Tail" is an integrated trading system, not just an indicator. This system analyzes each candle on a minute-by-minute basis, which is particularly effective in high market volatility conditions. The "Dragon's Tail" system identifies key market moments referred to as "bull and bear battles". Based on these "battles", the system gives trade direction recommendations. In the case of an arrow appearing on the chart, this signals the possibility of opening two trades in the indicated directi
SMCpro VIP MT4  Original Price  $620   ---  Currently Price 20% OFF ( for unlimited use )   BONUS  AUX VIP Club 2024 : Include  EA Airbag  and  Load Data History  to enhance the performance of this tool to its maximum potential  Click Here to Download Files   ( for users only )   Hello World! Introducing.. SMCpro VIP tool and Indicator for MetaTrader 4, designed to revolutionize your trading experience with the ICT Smart Money Concept. This system is meticulously crafted to empower trad
Fibonacci Retracements Pro
Savia Forex Software Solutions
Fibonacci Retracements Pro The Fibonacci Retracements Pro is a powerful yet easy to use indicator. It automatically plots all the important Fibonacci retracement and extension levels for you. FRP is dynamic powerful and seamlessly adjusts to whatever timeframe you are analyzing. Fibonacci Retracement Pro is optimized for ALL timeframes and ALL Currency pairs, Indices, Commodities, and Cryptocurrency pairs. Trade with improved confidence and maximize your success rate. Benefits Dynamic and Power
Fnix l long position
Monique Ellen Miranda Dos Santos
¿Eres un inversor en busca de oportunidades a largo plazo en el mercado financiero? Te presento el Indicador de Tendencia Personalizado a Largo Plazo. Este indicador está diseñado para traders que desean operar en plazos más largos que los gráficos diarios, semanales y mensuales. Con señales claras y precisas, contarás con la asistencia necesaria para tomar decisiones informadas. Características clave: Estrategia a Largo Plazo: Este indicador es perfecto para inversores comprometidos con el trad
Daotradingfx
Huynh Cong Chinh
Title: "Daotradingfx - The Perfect Key for Wave Trading with 7 Years of Experience" Forex trading is never easy, but with the daotradingfx indicator, I have found a reliable partner, unlocking the door to success in wave trading. Built on the foundation of my 7 years of trading experience, this indicator is not just a tool; it is a comprehensive canvas of market understanding and convenience in trading. Daotradingfx stands out with its ability to use multiple timeframes, a crucial feature t
The Stochastic Basket Currency Strenght  brings the Stochastic indicator to a new level.  Expanding the boundaries of TimeFrames and mono-currency analysis, the SBCS take the movements of each currency that composes the cross and confront them in the whole basket of 7 crosses.  The indicator works with any combination of AUD, CAD, CHF, EUR, GBP, JPY, NZD, USD pairs and with full automation takes in account every stochastic value (main line) for the selected Time Frame.  After that, the indicator
Introducing the "Magic Trades" for MetaTrader 4 – your ultimate tool for precision trading in dynamic markets. This innovative indicator revolutionizes the way you perceive market trends by harnessing the power of advanced analysis to detect subtle changes in character, paving the way for optimal trading opportunities. The Magic Trades Indicator is designed to empower traders with insightful entry points and well-defined risk management levels. Through its sophisticated algorithm, this indica
Oni Scalper
Goh Cheng Wai
5 (2)
Dear Onis, This Indicator is used for   GBPUSD, US30 and GOLD on 1-Min Chart . For US30 , Depending on your broker, Minimum Lot Size will differ from 0.01 to 1.0 lots. My Current Account is trading at 1.0 lots at $1 per point . Please check with your Broker what's the Margin Required for your Minimum lot sizes before you trade on your Real account. I have Forward Tested the indicator for around 6 months before releasing it to the public. ( No Demo is available for the Indicator, Strategy
Clidro FX
Mahmood Abdur Rafey Siddiqui
Clidro FX is a complete trading system designed and developed by Auxrum Analytics targeting the EURUSD, USDJPY, and GBPUSD FX pairs. It is currently available to MetaTrader 4 users. The Clidro FX algorithm, along with the optimized money-management and order-management rules sets up the basis for excellent trading results consistently over an extended period of time. The fundamental premise of the system is that each FX pair displays its unique quantitative characteristics while oscillating thro
Intro to APAMI, PROfessional edition Trace exactly how far prices trend between two price levels with fractional pip precision, while qualifying price movement between the same price levels. Completely automate when trends change direction and volatility, without any lag .  This is possible because the Accurate Price Action Measurement Indicator (APAMI) actually does what no other indicator can:  measure price distance between two points and simultaneously qualify the price action that occurs
Automatic, live & interactive picture of all trendlines. Assign push, email and sound alerts to the lines of your choice and be informed about price rollback, breakout, rollback after breakout, number of rollbacks, line expiration by double breakout. Correct, drag or delete the lines and interactively tune the line system. https://youtu.be/EJUo9pYiHFA . Chart examples https: //www.mql5.com/en/users/efficientforex Price Interaction Events All events are effective immediately and only after on
The indicator displays the probable ( Support and resistance ) levels. The indicator draws horizontal and trend levels of support and resistance. The indicator settings: Trends - the mode for displaying trend lines or horizontal lines of support and resistance Yes - display trend lines only No - display horizontal lines only UseResource - use the resources built into the indicator. Yes - use the ZigZag indicator from the resources of the product. No - use a custom ZigZag indicator. HistoryBar -
The [GRAFF] III manual trading system is based on multiple MetaTrader (MT4) indicators. Together, the entire PACK of GRAFF III indicators makes an advanced trading tool. The system consists of over 20 different custom-built indicators which have been carefully selected and tested in the long term to produce strong and efficient trading signals. The particular indicators are based on different mathematical formulas, so the entire system is calibrated to remove false signals from its own indicator
Filtro:
maurizio1
24
maurizio1 2023.06.15 13:56 
 

El usuario no ha dejado ningún comentario para su valoración

eexxqq
19
eexxqq 2023.06.15 12:54 
 

El usuario no ha dejado ningún comentario para su valoración

Respuesta al comentario
Versión 17.12 2024.01.04
https://t.me/tradeightrading
Versión 17.11 2024.01.03
https://t.me/tradeightrading
Versión 17.10 2024.01.02
https://t.me/tradeightradingroup
Versión 17.0 2023.08.27
tradeightrecords
Versión 11.12 2023.05.31
TradeighTrading
Versión 5.50 2023.05.23
TradeighT.Tester
Versión 5.0 2023.05.17
www.tradeightrading.com
Versión 4.0 2023.02.08
TradeighT