• Información general
  • Comentarios
  • Discusión
  • Novedades

Market Structure MTF

El indicador Market Structure MTF es un intento exitoso de formalizar la estructura del movimiento del precio de acuerdo con un algoritmo único. Establece inequívocamente cualquier movimiento de precios en los elementos constituyentes y le permite no perderse ningún punto de entrada o salida interesante.
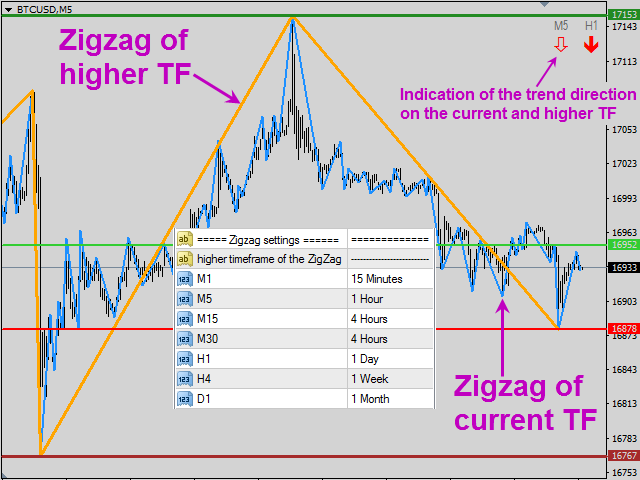
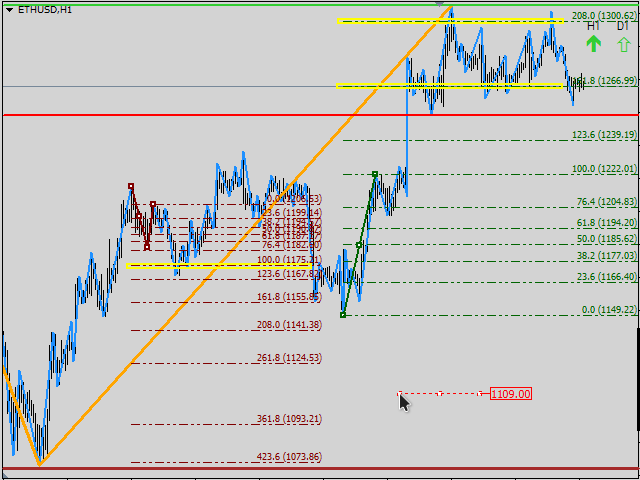
Una característica importante del indicador Market structure MTF es la visualización de la estructura del movimiento del precio a la vez en dos Marcos de tiempo: en el actual y en cualquier superior a elección del usuario.
A pesar de la similitud externa con varios Zigzags, este indicador es fundamentalmente diferente de ellos y está desprovisto de todos los inconvenientes que existen en los Zigzags: retrasos y redibujos.
El uso del indicador Market Structure MTF le permite trabajar confiando solo en la estructura de "corrección de impulso", tanto siguiendo la tendencia como determinando los momentos de reversión de la tendencia.
Además, este indicador se combina perfectamente con cualquier sistema comercial y estrategias (niveles, líneas de tendencia, perfil del mercado, zonas de margen, niveles de opciones, etc.) reforzándolos, y le permite encontrar puntos de entrada al comienzo del movimiento y salir cuando cambia la dirección de la tendencia.
Además, el indicador Market structure MTF incluye las siguientes herramientas:
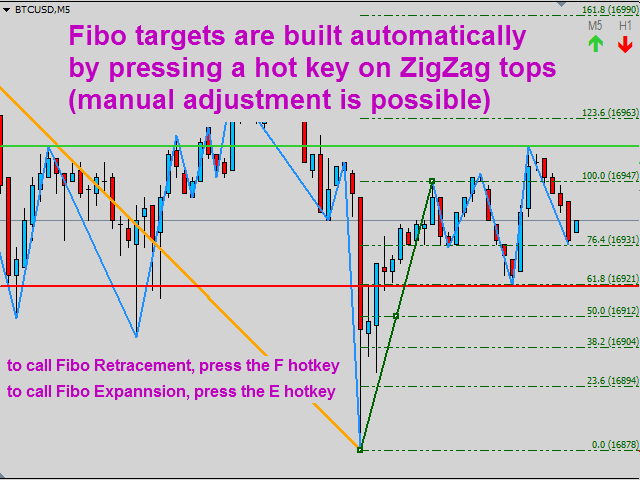
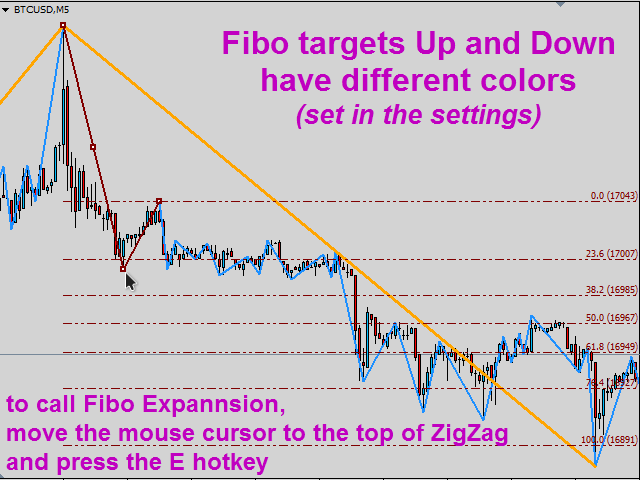
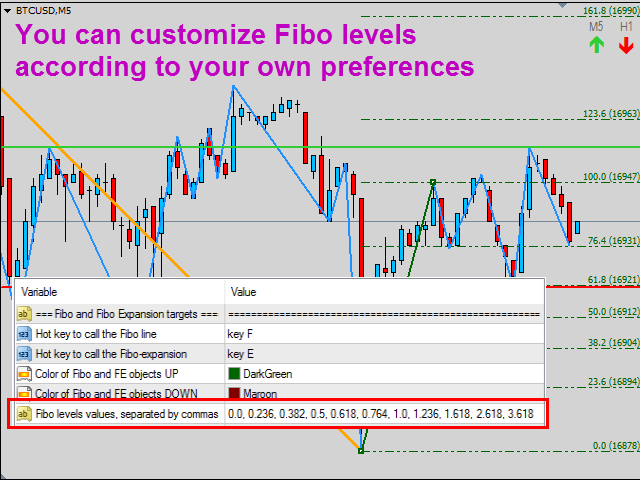
* Fibo Retracement y Fibo Expansion para identificar objetivos de movimiento y áreas importantes en el camino del movimiento de precios
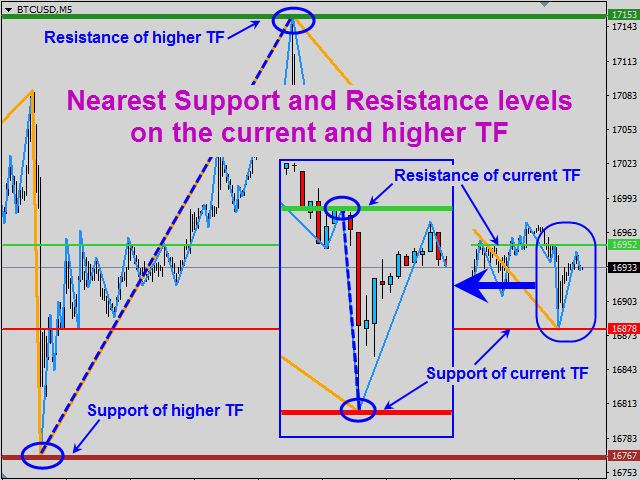
* Creación automática de líneas horizontales: los niveles de soporte y resistencia más cercanos, determinados por extremos importantes por encima y por debajo del precio actual tanto en el marco de tiempo actual como en el anterior.
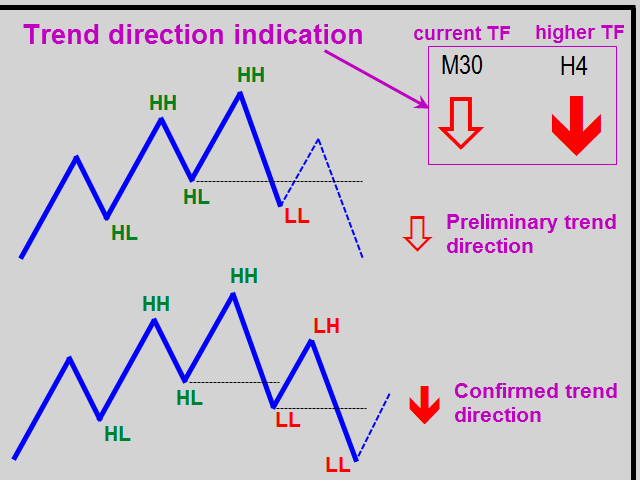
* Detección automática del estado del mercado en los Marcos de tiempo actuales y anteriores (tendencia arriba/abajo o plano) y la salida gráfica de esta información en forma de flechas
* Alertas "inteligentes": marcas que se establecen con solo presionar un botón. Al tocar el precio, el usuario recibe una notificación.
* Profundidad configurable de la historia de visualización de la estructura de precios
* Todas las notificaciones y alertas posibles disponibles en el terminal MT4
Cualquier configuración de color y configuración de teclas de acceso rápido para todas las funciones integradas están disponibles para el usuario. Los niveles para las herramientas de FIBO también se pueden configurar de acuerdo con sus propias preferencias.
Productos recomendados
The Profit Factor indicator calculates one of the three parameters: 1 - market entry level (in the 'Calculate the' parameter - Market Open Trade), 2 - the Stop Loss level (Calculate the - Market Price Loss), 3 - the Take Profit level (Calculate the - Market Price Profit) - with a desired profit/loss ratio (Profit Factor), as well as the lot size (trade volume) according to the value of the risk percentage of available funds specified in the settings (a simpler analog is the Lot Calculation indic
MarketProfile EForex
Veridiana Adorno Kendrick
Market Profile Muestra dónde ha pasado más tiempo el precio, destacando los niveles importantes que se pueden utilizar en la negociación. Es una poderosa herramienta que está diseñada para tomar los componentes fundamentales que componen cada mercado; precio / volumen / tiempo, y mostrar visualmente su relación en tiempo real a medida que el mercado se desarrolla durante un período de tiempo predeterminado. ¡Herramienta muy poderosa!
BoxChart MT4
Evgeny Shevtsov
4.57 (7)
The market is unfair if only because 10% of participants manage 90% of funds. An ordinary trader has slim changes to stand against these "vultures". This problem can be solved. You just need to be among these 10%, learn to predict their intentions and move with them. Volume is the only preemptive factor that faultlessly works on any timeframe and symbol. First, the volume appears and is accumulated, and only then the price moves. The price moves from one volume to another. Areas of volume accumu
El indicador construye cotizaciones actuales, que se pueden comparar con las históricas y, sobre esta base, hacer un pronóstico de movimiento de precios. El indicador tiene un campo de texto para una navegación rápida a la fecha deseada. Opciones: Símbolo - selección del símbolo que mostrará el indicador; SymbolPeriod - selección del período del cual el indicador tomará datos; IndicatorColor - color del indicador; HorisontalShift: cambio de cotizaciones dibujadas por el indicador
El colector de pepitas Chinetti XL es un completo sistema de comercio llave en mano. Si un comerciante aún no tiene su propio sistema de negociación, puede aplicar el colector de pepitas XL de Chinetti al comercio. Operar con este indicador es muy sencillo. Incluso un principiante en Forex puede manejarlo. Reglas comerciales: espere a que el indicador comience a dibujar una línea azul. Esto significa que la tendencia de precios comienza ahora. Ahora estamos esperando que el indicador analice
TTF 2x Osc AM
Andriy Matviyevs'kyy
This indicator is based on the idea of a popular Trend Trigger Factor indicator (TTF). The indicator determines a price movement direction comparing high and low of the current candle with high and low of a price for a longer period. Parameters: Long_TTF_Bars - number of candles to calculate the price movement direction for a longer period of time (cannot be less than 2) Short_TTF_bars - number of candles to calculate the price movement direction for a shorter period of time (cannot be less tha
FREE
FATL Candles 2 AM
Andriy Matviyevs'kyy
This indicator displays candle prices on the chart, colored in accordance with the data of the FATL digital filter built on closing prices. The indicator has no configurable parameters. Allows you to effectively follow the short-term trend. Usage: After the full formation of a candle colored in the opposite color to the previous candle, place a stop order at the high / low of such a candle. When the price overcomes such a high/low, a position will be opened. With the full formation of a candle p
FREE
Dollar mint indicator is a special workmanship with years of experience in forex.   Dollar mint ea is a fully non repaint indicator optimised with price action data such that once it gives you a signal t . The indicator   can be used to trade anything on the mt4 with much ease. Benefits ; Fully non repaint Use in any timeframe Use in all the available tradable assets on mt4 Best to use on h4. It generates fully analysed buy and sell signals based on trend and also filters out retracement
AQ XFifteen
HIT HYPERTECH INNOVATIONS LTD
4.36 (11)
Χ15 indicator is a MetaTrader 4 tool that allows you to BUILD & BACKTEST ON REAL TIME your own strategies quickly, easily and efficiently. It contains 15 of the most popular technical analysis indicators that you can use, each one in a different way. Choose the indicators that you want to use, select how you will use them and you will see on the chart BUY (green) and SELL (red) arrows implementing your strategy. Choose Take Profit and Stop Loss and you will see the results of your strategy with
FREE
AQ XFifteen Pro
HIT HYPERTECH INNOVATIONS LTD
Χ15 indicator is a MetaTrader 4 tool that allows you to  BUILD & BACKTEST ON REAL TIME  your own strategies quickly, easily and efficiently. It contains  15 of the most popular technical analysis indicators  that you can use, each one in a different way. Choose the indicators that you want to use, select how you will use them and you will see on the chart BUY (green) and SELL (red) arrows implementing your strategy. Choose Take Profit and Stop Loss and you will see the results of your strategy w
The Chaikin Oscillator is a technical indicator developed by Marc Chaikin that combines price and volume data to measure the accumulation and distribution of a financial instrument. It aims to identify potential buying and selling opportunities in the market. The Chaikin Oscillator is calculated by subtracting a 10-day exponential moving average of the Accumulation Distribution Line (ADL) from a 3-day exponential moving average of the ADL. Here's how to use the Chaikin Oscillator indicator in tr
WPR Signal AM
Andriy Matviyevs'kyy
This indicator displays the signals based on the values of the classic WPR indicator. The WPR indicator can be used for determining the overbought or oversold areas on the chart. Reaching these levels means that the market can soon turn around, but it does not give signal, as in a strong trend the market can stay in the overbought or oversold state for quite a long time. As with most oscillators, the signals are generated when leaving these areas. This indicator allows to display three types of
FREE
The indicator analyzes the change in the minimum and maximum prices of the previous bars fixing the entrance of the big players. If the change (delta) increases, a signal is displayed on the graph in the form of an arrow. At the same time, virtual trade on history is carried out. In case of a repeat of the signal, the positions are increased (refilling). Thus the lot of positions can differ. The results of virtual trading in the form of losses / losses, profitability, drawdown and transaction li
VR Cub
Vladimir Pastushak
VR Cub es un indicador para obtener puntos de entrada de alta calidad. El indicador fue desarrollado para facilitar los cálculos matemáticos y simplificar la búsqueda de puntos de entrada a una posición. La estrategia comercial para la cual se diseñó el indicador ha demostrado su eficacia durante muchos años. La simplicidad de la estrategia comercial es su gran ventaja, que permite que incluso los operadores novatos negocien con éxito con ella. VR Cub calcula los puntos de apertura de posiciones
The Pairs Spread indicator has been developed for the popular strategy known as pairs trading, spread trading, or statistical arbitrage. This indicator measures the distance (spread) between prices of two directly (positively) correlated instruments and shows the result as a curve with standard deviations. So, traders can quickly identify when the instruments are too far apart and use this information for trade opportunities.  How to use the Pairs Spread indicator Best results are attained wh
Daily Candle Predictor es un indicador que predice el precio de cierre de una vela. El indicador está destinado principalmente para su uso en gráficos D1. Este indicador es adecuado tanto para el comercio de divisas tradicional como para el comercio de opciones binarias. El indicador se puede utilizar como un sistema de negociación independiente o puede actuar como una adición a su sistema de negociación existente. Este indicador analiza la vela actual, calculando ciertos factores de fuerza dent
RSX Signal 2 AM
Andriy Matviyevs'kyy
The indicator displays the signals of the RSX oscillator on the price chart. (To display these signals in a separate window, along with the oscillator, another indicator is used -  RSX Osc 4 AM ). It is optimal to use the indicator signals as signals to open a trade when the price overcomes the maximum or minimum of the bar at which the signal was given. An opposite signal cancels the previous signal. Settings: Data period for indicator calculation - data period for indicator calculation; Data
FREE
Blahtech Market Profile
Blahtech Limited
4.61 (18)
Was: $249  Now: $99   Market Profile defines a number of day types that can help the trader to determine market behaviour. A key feature is the Value Area, representing the range of price action where 70% of trading took place. Understanding the Value Area can give traders valuable insight into market direction and establish the higher odds trade. It is an excellent addition to any system you may be using. Blahtech Limited presents their Market Profile indicator for the MetaTrader community. Ins
Simply The Best Pro
Szymon Palczynski
5 (1)
This indicator displays the histogram and arrows on chart. When Simple The Best Pro are placed on a chart, they identify the trend.  The color of may be blue or red. The blue color stands for upside moves and the red color stands for downside trends. The indicator offers to set Stop Loss (SL) and  Take Profit (TP)  setting. The default value is ATR. Indicator has automatic optimization. The STB is a unique indicator that shows the tendency (button Bars) of a particular signals. The STB tells us
Icebergs
Mikhail Nazarenko
Icebergs displays areas of the greatest confrontation between major sellers and buyers on the chart. It also marks a forthcoming strong movement from a specified point. The accumulation of icebergs indicates the strength of the level and interest of major players at this level. Application Icebergs are areas marked by the indicator. They are optimal for opening trades and are also targets for taking profit. Features The indicator warns of a forthcoming movement. The indicator pattern works o
Старый, добрый "AP" в версии трендового осциллятора. Это простой индикатор, который использует максимум возможностей языка MQL4. Но при этом он работает достаточно быстро даже на процессорах 1 Гигагерц и менее. При анализе следует обращать внимание на пересечение уровня 50, если вы намеренны использовать его как трендовый индикатор. Индикатор не перерисовывает, и работает на всех типах графиков и таймфреймах. Сделаны основные возможности оповещения, оповещения работают в обоих направлениях
Extremes Day
Aleksey Maltsev
v. 1.0 This indicator can show with maximum accuracy up to 1 bar the presence of a Maximum/minimum on the chart, regardless of the timeframe. It has a flexible configuration. You can use either one value on all TF, or you can use your own value on each TF individually. This indicator is already being improved and those who purchase it receive all updates for free. Next, it is planned to display an indication of the strength of the pivot point at each extremum (in % or in color drawing). It
Questo tipo di indicatore fa previsioni leggendo il volume delle candele. Il valore ATR, compreso nell'indicatore FORECAST PRO,è confrontato con i livelli di supporto e resistenza con le medie dei prezzi di apertura e chiusura delle candele. Creando così segnali di ingresso sul mercato tramite frecce colorate. Le frecce saranno confermate una volta che si è verificato il breakout.
Market Dynamics
Thomas Bradley Butler
Market Dynamics es para el scalping de tendencias. El azul es comprar y el rojo es vender. Las líneas son áreas de consolidación de precios y las velas de barra regulares no están decididas. El precio se consolidará entre las líneas de soporte y resistencia y luego habrá una ruptura de la acción del precio fuera de las áreas. Pica las áreas por encima o por debajo del cuero cabelludo y sigue las tendencias principales o el comercio diario de cueros cabelludos.
Profit Loss Meter
Alexander Sevastyanov
5 (8)
This indicator allow you to measure Profit/Loss of current, closed or future trade in account currency and estimate margin level at the trade close point. Profit/Loss indicator is based on MT4 native Crosshair instrument and has following inputs:  Trade Direction = Buy/Sell Lot size = 0.1 Font size = 8 Font color = DeepSkyBlue Offset horizontal Offset vertical   
FREE
Blahtech Supply Demand
Blahtech Limited
4.63 (35)
Was: $299  Now: $99   Supply Demand uses previous price action to identify potential imbalances between buyers and sellers. The key is to identify the better odds zones, not just the untouched ones. Blahtech Supply Demand indicator delivers functionality previously unavailable on any trading platform. This 4-in-1 indicator not only highlights the higher probability zones using a multi-criteria strength engine, but also combines it with multi-timeframe trend analysis, previously confirmed swings
VolumeDeltaM1
Stanislav Korotky
3.67 (3)
This indicator provides tick volume delta analysis on M1 timeframe. It monitors up and down ticks and sums them up as separate volumes for buys and sells, as well as their delta volumes, and volume clusters on price scale within a specified number of bars. This indicator complements VolumeDelta , which uses similar algorithms but does not process ticks and therefore cannot work on M1. VolumeDelta can show its signals on entire history because it reads M1 volumes for calculations on higher timefr
BoxInside MT4
Evgeny Shevtsov
4.56 (9)
This indicator calculates the volume profile and places labels that correspond to the VAH, VAL and POC levels, for each candle individually. Indicator operation features The indicator works on the timeframes from M5 to MN, but it uses the history data of smaller periods: M1 - for periods from M5 to H1, M5 - for the H4 period, M30 - for the D1 period, H4 - for the W1 period, D1 - for the MN period. The color and location of the VAL, VAH and POC labels on the current candle are considered to be
FREE
Multicurrency indicator in table format. Signals appear with confirmation, do not redraw. The indicator works on the current (open) timeframe. Notifications come for an open instrument. The strategy includes: price touching the moving average in the direction of the trend, as well as an extraordinary recalculation of the classic ADX indicator to determine the trend as an additional filtering of entries. Entries are displayed on the chart as arrows and, as mentioned above, the arrows are not redr
you are in a trade making profit... should you take profit now or wait...? This easy to use Dynamic Take Profit Indicator  helps you to decide when to get out  of a winning trade. Or you can supervise or overrule any EA when to close an open order when manual trading, or read out the buffers[1][2] to integrate in an Expert! As soon as the price crosses  the yellow line, price direction should reverse soon and orders should be closed. The band is dynamic and changing with every new candle as it
Los compradores de este producto también adquieren
Atomic Analyst
Issam Kassas
5 (2)
En primer lugar, vale la pena enfatizar que este Indicador de Trading no repinta, no redibuja y no se retrasa, lo que lo hace ideal tanto para el trading manual como para el automatizado. El Analista Atómico es un Indicador de Acción del Precio PA que utiliza la fuerza y el impulso del precio para encontrar una mejor ventaja en el mercado. Equipado con filtros avanzados que ayudan a eliminar ruidos y señales falsas, y aumentan el potencial de trading. Utilizando múltiples capas de indicadores
TPSproTREND PrO
Roman Podpora
5 (15)
TPSpro TRENDPRO  - is a trend indicator that automatically analyzes the market and provides information about the trend and each of its changes, as well as giving signals for entering trades without redrawing! The indicator uses each candle, analyzing them separately. referring to different impulses - up or down impulse. Exact entry points into transactions for currencies, crypto, metals, stocks, indices!  -  Version MT5               DETAILED DESCRIPTION        /       TRADING SETUPS           
ACTUALMENTE 26% DE DESCUENTO ¡La mejor solución para cualquier operador novato o experto! Este indicador es una herramienta única, de alta calidad y asequible porque hemos incorporado una serie de características propias y una nueva fórmula. ¡Con sólo UN gráfico puede leer la Fuerza de la Divisa para 28 pares de Divisas! Imagínese cómo mejorará su operativa porque podrá señalar el punto exacto de activación de una nueva tendencia o de una oportunidad de scalping. Manual del usuario: haga
¡Actualmente 20% OFF ! ¡La mejor solución para cualquier novato o trader experto! Este software funciona con 28 pares de divisas. Se basa en 2 de nuestros principales indicadores (Advanced Currency Strength 28 y Advanced Currency Impulse). Proporciona una gran visión general de todo el mercado de divisas. Muestra los valores de Advanced Currency Strength, la velocidad de movimiento de las divisas y las señales para 28 pares de divisas en todos los (9) marcos temporales. Imagine cómo mejorar
Scalper Inside PRO
Alexey Minkov
4.75 (55)
SALE NOW! Limited Time Offer! An exclusive indicator that utilizes an innovative algorithm to swiftly and accurately determine the market trend. The indicator automatically calculates opening, closing, and profit levels, providing detailed trading statistics. With these features, you can choose the most appropriate trading instrument for the current market conditions. Additionally, you can easily integrate your own arrow indicators into Scalper Inside Pro to quickly evaluate their statistics and
TPSpro RFI Levels
Roman Podpora
5 (13)
A key element in trading is zones or levels from which decisions to buy or sell a trading instrument are made. Despite attempts by major players to conceal their presence in the market, they inevitably leave traces. Our task was to learn how to identify these traces and interpret them correctly. Reversal First Impulse levels (RFI)   -  Version MT5                INSTRUCTIONS                 RUS                 ENG                                       R ecommended to use with an indicator   -  
Introduciendo       Indicador Quantum Trend Sniper   , el innovador indicador MQL5 que está transformando la forma en que identificas y negocias los cambios de tendencia. Desarrollado por un equipo de comerciantes experimentados con experiencia comercial de más de 13 años,       Indicador de francotirador de tendencia cuántica       está diseñado para impulsar su viaje comercial a nuevas alturas con su forma innovadora de identificar cambios de tendencia con una precisión extremadamente alta.
Quantum Breakout Indicator PRO
Bogdan Ion Puscasu
4.96 (26)
Introduciendo       Quantum Breakout PRO   , el innovador indicador MQL5 que está transformando la forma en que comercia con Breakout Zones. Desarrollado por un equipo de operadores experimentados con experiencia comercial de más de 13 años,   Quantum Breakout PRO   está diseñado para impulsar su viaje comercial a nuevas alturas con su innovadora y dinámica estrategia de zona de ruptura. El indicador de ruptura cuántica le dará flechas de señal en las zonas de ruptura con 5 zonas objetivo de
Advanced Supply Demand
Bernhard Schweigert
4.92 (310)
¡Actualmente con 33% de descuento! ¡La mejor solución para cualquier tráder principiante o experto! Este indicador es una herramienta comercial única, de alta calidad y asequible, porque incorpora una serie de características patentadas y una nueva fórmula. Con esta actualización, podrá mostrar zonas de doble marco temporal. No solo podrá mostrar un marco temporal más alto, sino también mostrar ambos, el marco temporal del gráfico MÁS el marco temporal más alto: MOSTRANDO ZONAS ANIDADAS. A todos
Presentamos el Indicador Milagroso de Forex: Desata el Poder del Trading Preciso ¿Estás cansado de buscar el mejor indicador de Forex que realmente ofrezca resultados excepcionales en todos los marcos temporales? ¡No busques más! Ha llegado el Indicador Milagroso de Forex para revolucionar tu experiencia de trading y llevar tus ganancias a nuevas alturas. Construido sobre una base de tecnología de vanguardia y años de desarrollo meticuloso, el Indicador Milagroso de Forex se erige como el pinácu
Entry Points Pro
Yury Orlov
4.7 (225)
Este es un genial indicador para MT4 que ofrece señales precisas para entrar en una transacción sin redibujar. Se puede aplicar a cualquier activo financiero: fórex, criptomonedas, metales, acciones, índices. Nos dará valoraciones bastante precisas y nos dirá cuándo es mejor abrir y cerra una transacción. Eche un vistazo  al vídeo  (6:22), ¡contiene un ejemplo de procesamiento de una sola señal que ha amortizado el indicador! La mayoría de los tráders mejoran sus resultados comerciales durante l
TrendMaestro
Stefano Frisetti
5 (2)
note: this indicator is for METATRADER4, if you want the version for METATRADER5 this is the link: TRENDMAESTRO recognizes a new TREND in the bud, he never makes mistakes. The certainty of identifying a new TREND is priceless. DESCRIPTION TRENDMAESTRO identifies a new TREND in the bud, this indicator examines the volatility, volumes and momentum to identify the moment in which there is an explosion of one or more of these data and therefore the moment in which prices have strong probability of f
FX Volume
Daniel Stein
4.6 (35)
Obtenga su actualización diaria del mercado con detalles y capturas de pantalla a través de nuestro Morning Briefing aquí en mql5 y en Telegram ! FX Volume es el PRIMER y ÚNICO indicador de volumen que proporciona una visión REAL del sentimiento del mercado desde el punto de vista de un bróker. Proporciona una visión impresionante de cómo los participantes institucionales del mercado, como los brokers, están posicionados en el mercado Forex, mucho más rápido que los informes COT. Ver esta info
Price Action Entry Alerts
Stephen Sanjeeve Sahayam
5 (3)
Este indicador analiza cada barra en busca de presión de compra o venta e identifica 4 tipos de patrones de velas con el volumen más alto. Estas velas luego se filtran utilizando varios filtros lineales para mostrar señales de compra o venta. Las señales funcionan mejor, junto con una dirección de marco de tiempo más alta y cuando se negocian durante horas de alto volumen. Todos los filtros son personalizables y funcionan de forma independiente. Puede ver señales de una sola dirección con el cli
How to use Pair Trading Station Pair Trading Station is recommended for H1 time frame and you can use it for any currency pairs. To generate buy and sell signal, follow few steps below to apply Pair Trading Station to your MetaTrader terminal. When you load Pair Trading Station on your chart, Pair Trading station will assess available historical data in your MetaTrader platforms for each currency pair. On your chart, the amount of historical data available will be displayed for each currency pai
FX Power MT4 NG
Daniel Stein
5 (8)
Obtenga su actualización diaria del mercado con detalles y capturas de pantalla a través de nuestro Morning Briefing aquí en mql5 y en Telegram ! FX Power MT4 NG es la nueva generación de nuestro popular medidor de fuerza de divisas, FX Power. ¿Y qué ofrece este medidor de fuerza de nueva generación? Todo lo que le encantaba del FX Power original PLUS Análisis de fuerza de ORO/XAU Resultados de cálculo aún más precisos Períodos de análisis configurables individualmente Límite de cálculo persona
Cycle Sniper
Elmira Memish
4.4 (35)
NEW YEAR SALE PRICE FOR LIMITED TIME!!! Please contact us after your purchase and we will send you the complimentary indicators to complete the system Cycle Sniper is not a holy grail but when you use it in a system which is explained in the videos, you will feel the difference. If you are not willing to focus on the charts designed with Cycle Sniper and other free tools we provide, we recommend not buying this indicator. We recommend watching the videos about the indiactor and system before pu
PTS Precision Index Oscillator V2
PrecisionTradingSystems
5 (1)
El Oscilador de Índice de Precisión (Pi-Osc) de Roger Medcalf de Precision Trading Systems La versión 2 ha sido cuidadosamente recodificada para cargar rápidamente en su gráfico y se han incorporado algunas otras mejoras técnicas para mejorar la experiencia. El Pi-Osc fue creado para proporcionar señales precisas de temporización de operaciones diseñadas para encontrar puntos de agotamiento extremos, los puntos a los que los mercados se ven obligados a llegar solo para eliminar las órdenes
TakePropips Donchian Trend Pro
Eric John Pajarillaga Aldana
4.82 (17)
¡TakePropips Donchian Trend Pro   (MT4) es una herramienta poderosa y efectiva que detecta automáticamente la dirección de la tendencia utilizando el Canal Donchian y le proporciona señales comerciales de entrada y salida! Este indicador multifunción incluye un escáner de tendencias, señales comerciales, panel estadístico, filtro, sesiones comerciales y panel de historial de alertas. ¡Está diseñado para proporcionarle señales comerciales y ahorrarle horas analizando los gráficos! Puede descargar
GOLD Impulse with Alert
Bernhard Schweigert
4.56 (9)
Este indicador es una super combinación de nuestros 2 productos Advanced Currency IMPULSE with ALERT  +   Currency Strength Exotics . ¡Funciona para todos los marcos de tiempo y muestra gráficamente el impulso de fuerza o debilidad para las 8 divisas principales más un Símbolo! Este Indicador está especializado en mostrar la aceleración de la fuerza de la divisa para cualquier símbolo como Oro, Pares Exóticos, Materias Primas, Índices o Futuros. Es el primero de su clase, cualquier símbol
PTS - Buscador de Compras por Divergencia de Precision Trading Systems El Buscador de Divergencias de Precisión fue diseñado para encontrar los mínimos del mercado con una precisión milimétrica y lo hace con frecuencia. En el análisis técnico, la habilidad de identificar mínimos generalmente es mucho más fácil que identificar máximos, y este elemento está diseñado precisamente para esa tarea. Después de identificar una divergencia alcista, es prudente esperar a que la tendencia se vuelva al
El Indicador de Venta PTS Divergence Finder de Roger Medcalf - Precision Trading Systems. Este indicador solo proporciona indicaciones bajistas - de venta. En primer lugar, muchas veces me han preguntado por qué no proporcioné un indicador de divergencia de venta mientras proporcionaba felizmente un buscador de divergencias de señal de compra durante muchos años. Di la respuesta de que las divergencias de venta son menos confiables que las divergencias de compra, lo cual sigue siendo cierto. Se
TPA True Price Action indicator reveals the true price action of the market makers through 100% non-repainting signals (except early signals mode) strictly at the close of a candle! TPA shows entries and re-entries, every time the bulls are definitely stronger than the bears and vice versa. Not to confuse with red/green candles. The shift of power gets confirmed at the earliest stage and is ONE exit strategy of several. There are available now two free parts of the TPA User Guide for our custo
Indicator : RealValueIndicator Description : RealValueIndicator is a powerful tool designed specifically for trading on the EURUSD pair. This indicator analyzes all EUR and USD pairs, calculates their real currency strength values, and displays them as a single realistic value to give you a head start on price. This indicator will tell you moves before they happen if you use it right. RealValueIndicator allows you to get a quick and accurate overview of the EURUSD currency pair tops and bottoms,
Reversal Sniper
Elmira Memish
5 (3)
Reversal Sniper is designed to find the extreme reversals of the price. Indicator collects data of Cycle Sniper Indicator. NOTE: REVERSAL SNIPER Indicator is made for Cycle Sniper Users as an additional tool.  However, it can be used by the traders who look for finding out strong reversal levels. Indicator works on all timeframes and all instruments. Reversal  Sniper  Checks: Harmonic Patterns RSI Zig Zag and Harmonic Swings Cycle Sniper Indicator's Buy / Sell Signals The complex algo i
XQ Indicator MetaTrader 4
Marzena Maria Szmit
3 (2)
Step into the realm of Forex trading with confidence and precision using XQ, a cutting-edge Forex indicator designed to elevate your trading game to unprecedented heights. Whether you're a seasoned trader or just stepping into the world of currency exchange,   XQ Forex Indicator   empowers you with the insights and signals needed to make informed trading decisions. The signal conditions are a combination of three indicators, and XQ Forex Indicator only display  medium and long-term trends . The
XPointer
Andrey Kozak
5 (3)
XPointer is a completely ready trading system. It shows the trader when to open and close a trade. It works on all currency pairs and all time frames. Very easy to use and does not require additional indicators for its operation. Even a beginner trader can start working with XPointer. But it will also be useful for professional traders to confirm the opening of orders. Features of the XPointer indicator It does not redraw its values. It works on all currency pairs and all time frames. It has a
Presentamos ON Trade Waves Patterns Harmonic Elliot Wolfe, un indicador avanzado diseñado para detectar diversas formas de patrones en el mercado mediante métodos tanto manuales como automáticos. A continuación, te explicamos cómo funciona: Patrones Armónicos: Este indicador puede identificar patrones armónicos que aparecen en tu gráfico. Estos patrones son esenciales para los traders que practican la teoría del trading armónico, tal como se popularizó en el libro de Scott Carney "Harmonic Tradi
NO REPAINT ADVANCED CHART PATTERN INDICATOR By definition, a price ( chart)  pattern is a recognizable configuration of price movement that is identified using a series of  trendlines  and/or curves. When a price pattern signals a change in trend direction, it is known as a reversal pattern; a continuation pattern occurs when the trend continues in its existing direction following a brief pause. Advanced Chart Pattern Tracker is designed to find the MOST ACCURATE patterns. A special script is
Currency Strength Exotics
Bernhard Schweigert
4.88 (33)
¡ACTUALMENTE 20% DE DESCUENTO ! ¡La mejor solución para cualquier operador novato o experto! Este indicador está especializado en mostrar la fuerza de la divisa para cualquier símbolo como Pares Exóticos, Materias Primas, Índices o Futuros. Es el primero de su clase, cualquier símbolo se puede añadir a la 9 ª línea para mostrar la verdadera fuerza de la moneda de Oro, Plata, Petróleo, DAX, US30, MXN, TRY, CNH etc. Se trata de una herramienta de trading única, de alta calidad y asequible por
Otros productos de este autor
Bar Size MT4
Mikhail Tcvetkov
5 (6)
El indicador técnico, en tiempo real, busca velas que su Tamaño excede el especificado en la configuración y da señales. Como regla general, tales velas anormalmente grandes aparecen al comienzo de impulsos fuertes o al final del movimiento direccional del precio. Al comienzo del impulso, la señal puede servir como base para encontrar el punto de entrada, al final del movimiento, es un signo de clímax y puede hablar sobre el final cercano de la tendencia. El Tamaño de referencia para filtrar vel
FREE
Trigger KX5
Mikhail Tcvetkov
5 (1)
El indicador en tiempo real da señales de compra y venta. Al elegir la dirección de la tendencia principal, alrededor del 75-80% de las señales funcionan en beneficio. Absolutamente todas las señales permanecen en el gráfico y no cambian su posición, por lo que puede probar fácilmente el funcionamiento del indicador tanto en la historia como en el probador de estrategias. La configuración del indicador es simple y lógica: el parámetro Velocity es responsable del número y la frecuencia de las señ
Filtro:
No hay comentarios
Respuesta al comentario
Versión 2.12 2022.12.11
Исправлена мелкая ошибка