• Información general
  • Comentarios (1)
  • Discusión
  • Novedades

Alert Waves for mt5

4

Indicator introduction:

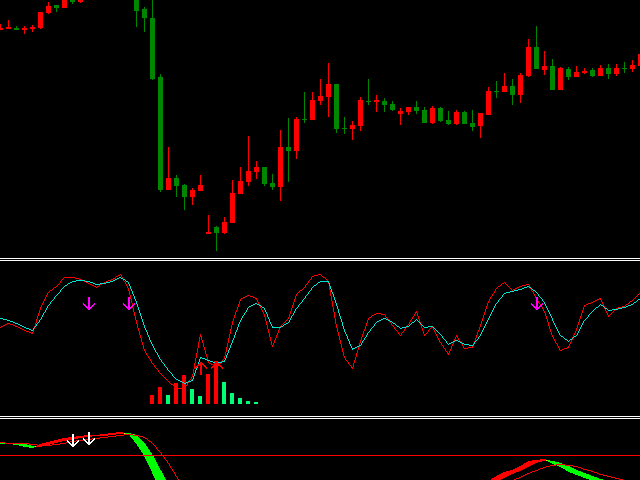
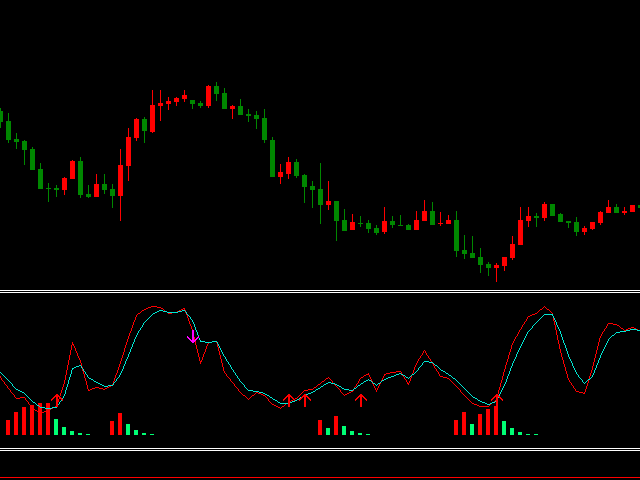
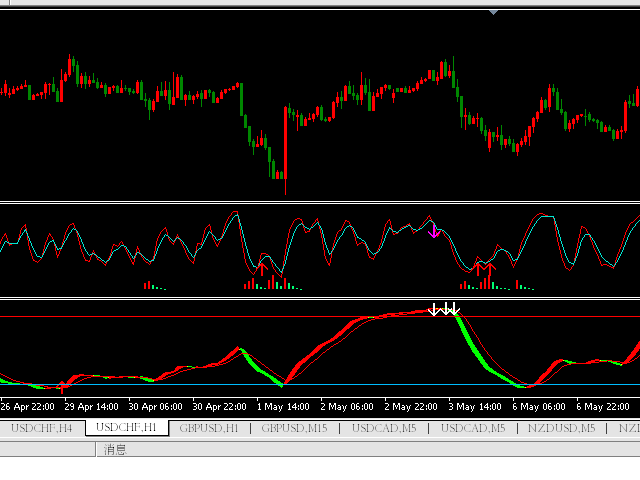
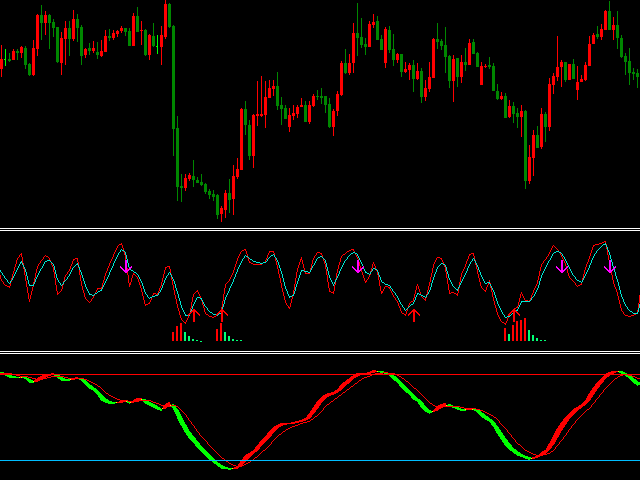
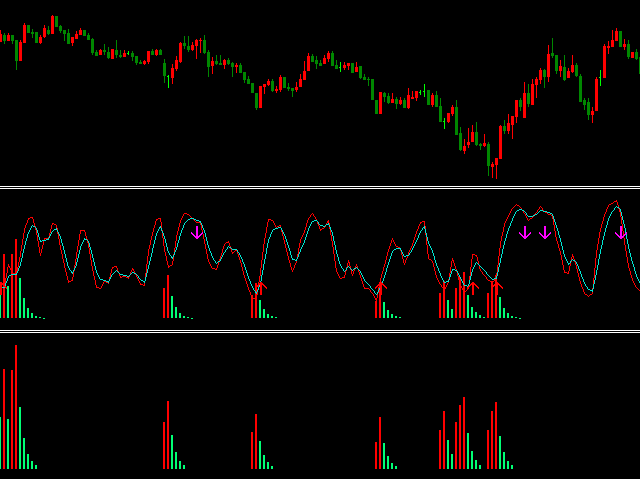
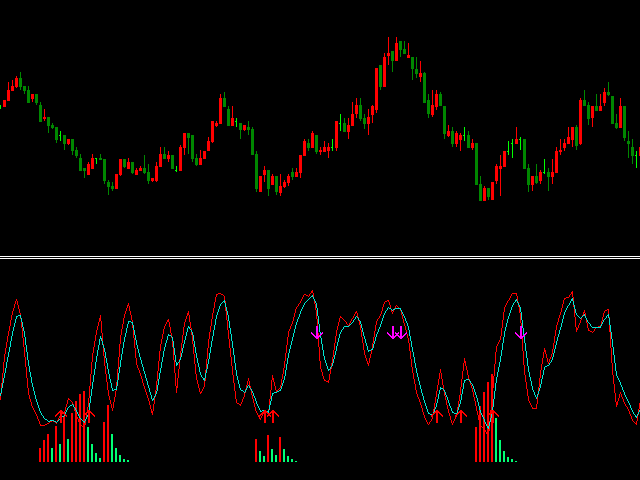
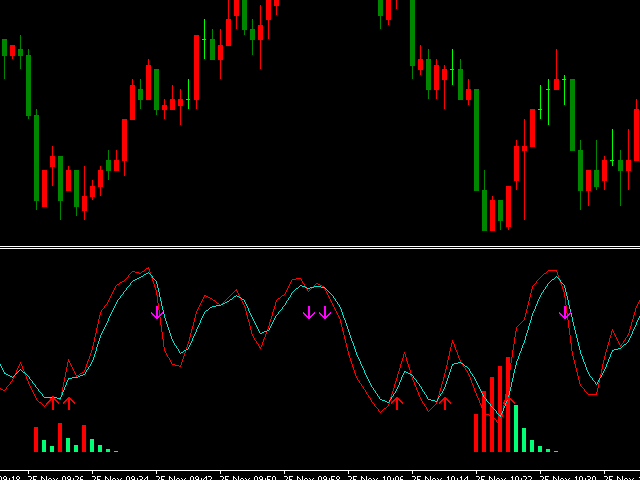
  • The indicator draws wave lines and histograms, It has small price lag, and the signal will not drift.
  • The indicator can send emails, alerts and notifications to you when previous k line has an up arrow and it is under the histogram sections or it has a down arrow.
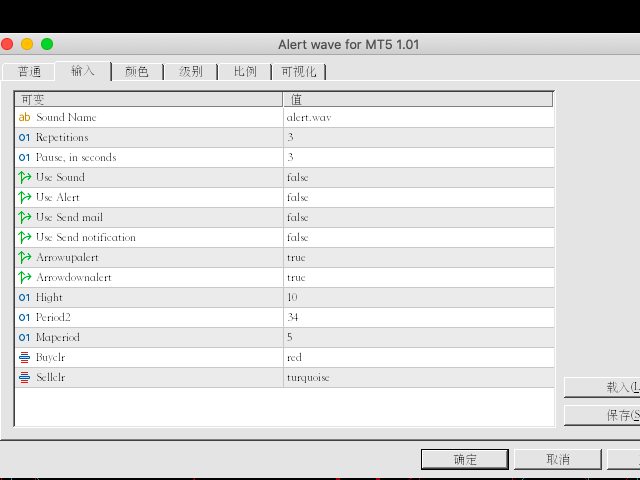
  • you can choose whether or not to send the two kind of alerts, the alerts repetition times can also be changed.
  • If the indicator appears red and green histograms, this is a buy zone. It can be used to analyze market's low price and design new expert that is need to judge low price range.
  • The indicator has more than 5 parameters, including ma periods, colors, histogram hights and parameters about alerts. 
  • It applies to any timeframe, it is suitable for M1 and above time frames. 
  • The work of the indicator is shown in the screenshots, I hope this indicator can be helpful to your trading.

My other indicators and EAs can be found at herehttps://www.mql5.com/zh/users/hzx/seller.

Comentarios 1
7Biblo7Induc7
385
7Biblo7Induc7 2023.04.17 15:03 
 

Very good indicator!

Productos recomendados
Free automatic Fibonacci is an indicator that automatically plots a Fibonacci retracement based on the number of bars you select on the BarsToScan setting in the indicator. The Fibonacci is automatically updated in real time as new highest and lowest values appears amongst the selected bars. You can select which level values to be displayed in the indicator settings. You can also select the color of the levels thus enabling the trader to be able to attach the indicator several times with differe
FREE
PZ Penta O MT5
PZ TRADING SLU
4 (6)
The Penta-O is a 6-point retracement harmonacci pattern which usually precedes big market movements. Penta-O patterns can expand and repaint quite a bit. To make things easier this indicator implements a twist: it waits for a donchian breakout in the right direction before signaling the trade. The end result is an otherwise repainting indicator with a very reliable trading signal. The donchian breakout period is entered as an input. [ Installation Guide | Update Guide | Troubleshooting | FAQ | A
FREE
La esencia del sistema consiste en la identificación del momento de formación de la vela compuesta "de vuelta" con características determinadas (tamaño de la vela en puntos, estructura de sombras).En el análisis de las velas japonesas el análogo de estas velas de vuelta son "Martillo" (Hammer) y "Hombre colgado" (Hanging Man), pero en este sistema el cuerpo de la vela no tiene que ser obligatoriamente pequeño, y la vela resultante se construye de varias velas. Parámetros de entrada del sistema:
FREE
"Hunttern harmonic pattern finder" base on the dynamic zigzag with the notification and prediction mode This version of the indicator identifies 11 harmonic patterns and predicts them in real-time before they are completely formed. It offers the ability to calculate the error rate of Zigzag patterns depending on a risk threshold. It moreover sends out a notification once the pattern is complete. The supported patterns: ABCD BAT ALT BAT BUTTERFLY GARTLEY CRAB DEEP CRAB CYPHER SHARK THREE
FREE
All Harmonics 26 demo
Alexey Isavnin
4.22 (9)
This is the demo version of "All Harmonics 26" indicator . "All Harmonics 26" searches for 26 types of harmonic patterns and outputs them in a convenient way. You can check out the documentation here . This demo version has the following limitations: The indicator searches only for one type of harmonic patterns out of 26:- Gartley. The indicator outputs new patterns with a lag of 10 bars.
FREE
Follow The Line MT5
Oliver Gideon Amofa Appiah
4.4 (30)
This indicator obeys the popular maxim that: "THE TREND IS YOUR FRIEND" It paints a GREEN line for BUY and also paints a RED line for SELL. (you can change the colors). It gives alarms and alerts of all kinds. IT DOES NOT REPAINT and can be used for all currency pairs and timeframes. Yes, as easy and simple as that. Even a newbie can use it to make great and reliable trades. NB: For best results, get my other premium indicators for more powerful and reliable signals. Get them here: https://www.m
FREE
Donchian Pro
Paulo Henrique Faquineli Garcia
5 (2)
The Donchian Channel Channels are among the most popular tools of technical analysis, as they visually convey to the analyst the limits within which most price movement tends to occur. Channel users know that valuable information can be obtained at any time, whether prices are in the central region of a band or close to one of the border lines. One of the best known techniques to explore these concepts is Bollinger Bands. However, John Bollinger was not the only one to research the applicatio
FREE
Are you tired of drawing trendlines every time you're analyzing charts? Or perhaps you would like more consistency in your technical analysis. Then this is for you. This indicator will draw trend lines automatically when dropped on a chart. How it works Works similar to standard deviation channel found on mt4 and mt5. It has 2 parameters: 1. Starting Bar 2. Number of bars for calculation The   starting bar   is the bar which drawing of the trend lines will begin, while the   number of bars for c
FREE
Bollinger Bands B
Flavio Javier Jarabeck
5 (3)
John Bollinger created this indicator in 2010 as a way to read the original indicator (Bollinger Bands) in a more "technical" way, shown as an oscillator. The typical range of the Bollinger Bands %B is 0 - 0.5 - 1.0, where "0" represents the lower band, the "0.5" the middle band, and "1" the upper band. The line on the indicator represents the Closing prices. As simple as that. SETTINGS Bollinger Bands period of analysis Standard Deviation multiplier Shift Price type to be analyzed If you
FREE
Necessary for traders: tools and indicators Waves automatically calculate indicators, channel trend trading Perfect trend-wave automatic calculation channel calculation , MT4 Perfect trend-wave automatic calculation channel calculation , MT5 Local Trading copying Easy And Fast Copy , MT4 Easy And Fast Copy , MT5 Local Trading copying For DEMO Easy And Fast Copy , MT4 DEMO Easy And Fast Copy , MT5 DEMO The homeopathic indicator is also called the CCI indicator. The CCI indicator was propos
FREE
Cybertrade Keltner Channels
Emanuel Andriato
4.67 (3)
Cybertrade Keltner Channels - MT5 Created by Chester Keltner, this is a volatility indicator used by technical analysis. It is possible to follow the trend of financial asset prices and generate support and resistance patterns. In addition, envelopes are a way of tracking volatility in order to identify opportunities to buy and sell these assets. It works on periods longer than the period visible on the chart. All values ​​are available in the form of buffers to simplify possible automations.
FREE
LT Donchian Channel
Thiago Duarte
4.75 (4)
Donchian Channel is an indicator created by Richard Donchian. It is formed by taking the highest high and the lowest low of the last specified period in candles. The area between high and low is the channel for the chosen period. Its configuration is simple. It is possible to have the average between the upper and lower lines, plus you have alerts when price hits one side. If you have any questions or find any bugs, please contact me. Enjoy!
FREE
Spike Catch Pro
Amani Fungo
4 (5)
Spike Catch Pro 22:03 release updates Advanced engine for searching trade entries in all Boom and Crash pairs (300,500 and 1000) Programmed strategies improvements Mx_Spikes (to combine Mxd,Mxc and Mxe), Tx_Spikes,   RegularSpikes,   Litho_System,   Dx_System,   Md_System,   MaCross,   Omx_Entry(OP),  Atx1_Spikes(OP),   Oxc_Retracement (AT),M_PullBack(AT) we have added an arrow on strategy identification, this will help also in the visual manual backtesting of the included strategies and see h
FREE
Value Chart Candlesticks
Flavio Javier Jarabeck
4.67 (9)
The idea of a Value Chart indicator was presented in the very good book I read back in 2020 , " Dynamic Trading Indicators: Winning with Value Charts and Price Action Profile ", from the authors Mark Helweg and David Stendahl. The idea is simple and the result is pure genius: Present candlestick Price analysis in a detrended way! HOW TO READ THIS INDICATOR Look for Overbought and Oversold levels. Of course, you will need to test the settings a lot to find the "correct" one for your approach.
FREE
PZ Three Drives MT5
PZ TRADING SLU
3.11 (9)
This indicator finds Three Drives patterns. The Three Drives pattern is a 6-point reversal pattern characterised by a series of higher highs or lower lows that complete at a 127% or 161.8% Fibonacci extension. It signals that the market is exhausted and a reversal can happen. [ Installation Guide | Update Guide | Troubleshooting | FAQ | All Products ] Customizable pattern sizes Customizable colors and sizes Customizable breakout periods Customizable 1-2-3 and 0-A-B ratios It implements visua
FREE
El Capturador de Tendencias: La Estrategia del Capturador de Tendencias con Indicador de Alerta es una herramienta versátil de análisis técnico que ayuda a los traders a identificar las tendencias del mercado y los posibles puntos de entrada y salida. Presenta una Estrategia dinámica del Capturador de Tendencias, adaptándose a las condiciones del mercado para una clara representación visual de la dirección de la tendencia. Los traders pueden personalizar los parámetros para que se ajusten a s
FREE
KeltnerChannelIndicatorMT5
Todd Terence Bates
3 (2)
The Keltner Channel is a volatility-based technical indicator composed of three separate lines. The middle line is an exponential moving average (EMA) of the price. Additional lines are placed above and below the EMA. The upper band is typically set two times the Average True Range (ATR) above the EMA, and the lower band is typically set two times the ATR below the EMA. The bands expand and contract as volatility (measured by ATR) expands and contracts. Since most price action will be encompasse
FREE
Supports And Resistances Lines
Francisco Gomes Da Silva
4.78 (40)
Indicador de zonas de soporte y resistencia MT5 este indicador sabe cómo identificar techos y suelos automáticamente. Este indicador de soporte y resistencia crea líneas de soporte y líneas de resistencia basadas en máximos y mínimos. cómo hacer líneas de soporte y resistencia. este es un indicador para hacer líneas automáticas de soporte y resistencia. cómo encontrar el nivel de soporte con indicador. este indicador encuentra máximos y mínimos automáticamente. El indicador crea automáticamente
FREE
Bar Color Trend
Germano Chagas
4.5 (10)
Combining the best of Price Action , Directional Movement , and Divergence/Convergence analysis, Candle Color Trend is a easy and reliable way to identify trend direction. The indicator automatically paints the candles according to the assumption that an uptrend is defined by prices that form a series of higher highs and higher lows. In contrast, a downtrend is defined by prices that form a series of lower highs and lower lows. Additionally, ADX Wilder indicator is used to measure trend weakness
FREE
Hunt markets with Hunttern ZigZag . Easy to use with one parameter    You can use it for the following:       -Classic patterns       -Heads and shoulders       -Harmonic patterns       -Elliott Wave       -Support and resistance       -Supply and Demand Single parameter:      -Period (1-120) Features:        -Candle time        -Single parameter        -Light mode template This is version 1 of Hunttern ZigZag. We are very happy to receive feedback from you.
FREE
O indicador grafico de rompimento foi desenvolvido para elevar a precisão e confiabilidade na identificação de oportunidades de rompimento no mercado financeiro. Projetado com algoritmos avançados, este indicador destaca barras de rompimento com uma precisão notável, permitindo que traders identifiquem pontos de entrada e saída estratégicos. Recursos Principais: Precisão Aprimorada: Utiliza algoritmos avançados para identificar barras de rompimento com uma precisão excepcional. Alertas em Tempo
FREE
Mitimom
Danil Poletavkin
The indicator is based on Robert Miner's methodology described in his book "High probability trading strategies" and displays signals along with momentum of 2 timeframes. A Stochastic oscillator is used as a momentum indicator. The settings speak for themselves period_1 is the current timeframe, 'current' period_2 is indicated - the senior timeframe is 4 or 5 times larger than the current one. For example, if the current one is 5 minutes, then the older one will be 20 minutes The rest of the
FREE
UPD1 X00 Levels MT5
Vitaliy Kuznetsov
5 (1)
El indicador muestra niveles   redondos   en el gráfico. También se denominan niveles   psicológicos , bancarios o de jugadores importantes. En estos niveles, hay una verdadera pelea entre alcistas y bajistas, la acumulación de muchos pedidos, lo que conduce a una mayor volatilidad. El indicador se ajusta   automáticamente   a cualquier instrumento y período de tiempo. Cuando el   nivel 80   se rompe y luego se prueba,   compramos . Cuando el   nivel 20   se rompe y luego se prueba,   vendemos
FREE
MIDAS Super VWAP
Flavio Javier Jarabeck
4.29 (14)
Imagine VWAP, MVWAP and MIDAS in one place... Well, you found it! Now you can track the movement of Big Players in various ways, as they in general pursue the benchmarks related to this measuring, gauging if they had good execution or poor execution on their orders. Traders and analysts use the VWAP to eliminate the noise that occurs throughout the day, so they can measure what prices buyers and sellers are really trading. VWAP gives traders insight into how a stock trades for that day and deter
FREE
Functional in the Forex market. Functional in the B3 market - Bolsa Brasil Balcão. Motivation The technical Fibonacci retraction indicator for many is essential and the basis for all market movement forecasts. The name of the tool comes from the Italian mathematician Leonardo de Pisa (13th century). This DEMO version will work in Meta Trader with Demo and Strategy Tester. To purchase the Full version that works on a Real account, click on: https://www.mql5.com/en/market/product/38089
FREE
Weis Waves
Flavio Javier Jarabeck
3.15 (26)
The original author is David Weis, an expert in the Wyckoff Method. The Weis Wave is a modern adaptation of the 1930's Wyckoff Method, another expert in Tape Reading techniques and Chart Analysis. Weis Waves takes market volume and stacks it into waves according to price conditions giving the trader valuable insights about the market conditions. If you want to learn more about this subject you can find tons of videos in YouTube. Just look for "The Wickoff Method", "Weis Wave" and "Volume Spread
FREE
Introduction This indicator detects volume spread patterns for buy and sell opportunity. The patterns include demand and supply patterns. You might use each pattern for trading. However, these patterns are best used to detect the demand zone (=accumulation area) and supply zone (=distribution area). Demand pattern indicates generally potential buying opportunity. Supply pattern indicates generally potential selling opportunity. These are the underlying patterns rather than direct price action. T
FREE
Dual RSI
Paul Conrad Carlson
Indicator alerts for Dual Relative strength index rsi. Large rsi preset at 14 is below 30 small rsi preset at 4 is below 10 for buy bullish signals . Large rsi preset are 14 is above 70 small rsi preset at 4 is above 90 for sell bearish signals . Includes mobile and terminal alerts. draws lines when alerts. This indicator can help identify extremes and then the tops or bottoms of those extremes .
FREE
Easy Gold is the latest addition to the BotGPT family. It is surprising and very powerful. It is ideal for beginners due to its simplicity.  There is absolutely nothing to do, it's 100% automated, simply indicate the percentage of risk you want to take per trade and the EA is ready. Whatever your capital, the EA takes care of everything. Optimized on (XAUUSD).  Unleash all the power with the professional version (AGI Gold) and its connection to the neural network, available in my store. My othe
FREE
ZigZag Support Resistance
Emmanuel Tshepang Mosweu
5 (3)
This indicator uses the Zigzag indicator to identify swing highs and swing lows in the price chart.  Once it has identified the swing highs and swing lows, it can use them to determine potential support and resistance levels. A support level is formed when the price drops and bounces back up from a swing low, indicating that there is buying pressure at that level. A resistance level is formed when the price rises and reverses downward from a swing high, suggesting selling pressure at that level.
FREE
Los compradores de este producto también adquieren
Primero que todo, vale la pena enfatizar que este Sistema de Trading es un Indicador No Repintado, No Redibujado y No Retrasado, lo que lo hace ideal tanto para el trading manual como para el automatizado. El "Sistema de Trading Inteligente MT5" es una solución completa de trading diseñada para traders nuevos y experimentados. Combina más de 10 indicadores premium y presenta más de 7 estrategias de trading robustas, lo que lo convierte en una opción versátil para diversas condiciones del merca
Atomic Analyst MT5
Issam Kassas
5 (11)
En primer lugar, vale la pena enfatizar que este Indicador de Trading no repinta, no redibuja y no se retrasa, lo que lo hace ideal tanto para el trading manual como para el automatizado. El Analista Atómico es un Indicador de Acción del Precio PA que utiliza la fuerza y el impulso del precio para encontrar una mejor ventaja en el mercado. Equipado con filtros avanzados que ayudan a eliminar ruidos y señales falsas, y aumentan el potencial de trading. Utilizando múltiples capas de indicadores
FX Volume MT5
Daniel Stein
4.94 (17)
Obtenga su actualización diaria del mercado con detalles y capturas de pantalla a través de nuestro Morning Briefing aquí en mql5 y en Telegram ! FX Volume es el PRIMER y ÚNICO indicador de volumen que proporciona una visión REAL del sentimiento del mercado desde el punto de vista de un bróker. Proporciona una visión impresionante de cómo los participantes institucionales del mercado, como los brokers, están posicionados en el mercado Forex, mucho más rápido que los informes COT. Ver esta info
Quantum Trend Sniper
Bogdan Ion Puscasu
5 (37)
Introduciendo       Indicador Quantum Trend Sniper   , el innovador indicador MQL5 que está transformando la forma en que identificas y negocias los cambios de tendencia. Desarrollado por un equipo de comerciantes experimentados con experiencia comercial de más de 13 años,       Indicador de francotirador de tendencia cuántica       está diseñado para impulsar su viaje comercial a nuevas alturas con su forma innovadora de identificar cambios de tendencia con una precisión extremadamente alta.
Gold Stuff mt5
Vasiliy Strukov
4.89 (166)
Gold Stuff mt5: un indicador de tendencia diseñado específicamente para el oro, también se puede usar en cualquier instrumento financiero. El indicador no se vuelve a dibujar ni se retrasa. El marco de tiempo recomendado es H1. IMPORTANTE! Póngase en contacto conmigo inmediatamente después de la compra para obtener instrucciones y bonificación! PARÁMETROS Draw Arrow-incl.desactivado. dibujar flechas en el gráfico. Alerts-incl.desactivado.alertas de sonido. E-mail notification-incl.desacti
Trend Screener Pro MT5
STE S.S.COMPANY
4.89 (61)
Desbloquee el poder del comercio de tendencias con el indicador Trend Screener: ¡su solución definitiva para el comercio de tendencias impulsada por lógica difusa y un sistema multidivisa!Mejore su comercio de tendencias con Trend Screener, el revolucionario indicador de tendencias impulsado por lógica difusa. Es un poderoso indicador de seguimiento de tendencias que combina más de 13 herramientas y funciones premium y 3 estrategias comerciales, lo que lo convierte en una opción versátil para co
FX Power MT5 NG
Daniel Stein
5 (4)
Obtenga su actualización diaria del mercado con detalles y capturas de pantalla a través de nuestro Morning Briefing aquí en mql5 y en Telegram ! FX Power MT5 NG es la nueva generación de nuestro popular medidor de fuerza de divisas, FX Power. ¿Y qué ofrece este medidor de fuerza de nueva generación? Todo lo que le encantaba del FX Power original PLUS Análisis de fuerza de ORO/XAU Resultados de cálculo aún más precisos Períodos de análisis configurables individualmente Límite de cálculo persona
Este es un genial indicador para MT5 que ofrece señales precisas para entrar en una transacción sin redibujar. Se puede aplicar a cualquier activo financiero: fórex, criptomonedas, metales, acciones, índices. Nos dará valoraciones bastante precisas y nos dirá cuándo es mejor abrir y cerra una transacción. Eche un vistazo  al vídeo  (6:22), ¡contiene un ejemplo de procesamiento de una sola señal que ha amortizado el indicador! La mayoría de los tráders mejoran sus resultados comerciales durante l
Ante todo, vale la pena enfatizar que esta Herramienta de Trading es un Indicador No Repintado, No Redibujado y No Retrasado, lo que la hace ideal para el trading profesional. El Indicador de Conceptos de Acción del Precio Inteligente es una herramienta muy potente tanto para traders nuevos como experimentados. Combina más de 20 indicadores útiles en uno solo, combinando ideas avanzadas de trading como el Análisis del Trader del Círculo Interior y Estrategias de Trading de Conceptos de Dinero
RelicusRoad Pro MT5
Relicus LLC
4.82 (22)
Ahora $ 147 (aumentando a $ 499 después de algunas actualizaciones) - Cuentas ilimitadas (PC o Mac) Manual de usuario de RelicusRoad + Videos de capacitación + Acceso al grupo privado de Discord + Estado VIP UNA NUEVA MANERA DE VER EL MERCADO RelicusRoad es el indicador comercial más poderoso del mundo para divisas, futuros, criptomonedas, acciones e índices, y brinda a los comerciantes toda la información y las herramientas que necesitan para mantenerse rentables. Brindamos análisis téc
Auto Order Block with break of structure based on ICT and Smart Money Concepts Futures Break of Structure ( BoS )             Order block ( OB )            Higher time frame Order block / Point of Interest ( POI )    shown on current chart           Fair value Gap ( FVG ) / Imbalance   ,  MTF      ( Multi Time Frame )    Volume Imbalance     ,  MTF          vIMB Gap’s Equal High / Low’s     ,  MTF             EQH / EQL Liquidity               Current Day High / Low           HOD /
XQ Indicator MetaTrader 5
Marzena Maria Szmit
5 (1)
Step into the realm of Forex trading with confidence and precision using XQ, a cutting-edge Forex indicator designed to elevate your trading game to unprecedented heights. Whether you're a seasoned trader or just stepping into the world of currency exchange, XQ Forex Indicator empowers you with the insights and signals needed to make informed trading decisions. The signal conditions are a combination of three indicators, and XQ Forex Indicator only display  medium and long-term trends . The ind
Blahtech Supply Demand MT5
Blahtech Limited
4.57 (14)
Was: $299  Now: $99   Supply Demand uses previous price action to identify potential imbalances between buyers and sellers. The key is to identify the better odds zones, not just the untouched ones. Blahtech Supply Demand indicator delivers functionality previously unavailable on any trading platform. This 4-in-1 indicator not only highlights the higher probability zones using a multi-criteria strength engine, but also combines it with multi-timeframe trend analysis, previously confirmed swings
Advanced Supply Demand MT5
Bernhard Schweigert
4.53 (15)
¡Actualmente con 33% de descuento! ¡La mejor solución para cualquier tráder principiante o experto! Este indicador es una herramienta comercial única, de alta calidad y asequible, porque incorpora una serie de características patentadas y una nueva fórmula. Con esta actualización, podrá mostrar zonas de doble marco temporal. No solo podrá mostrar un marco temporal más alto, sino también mostrar ambos, el marco temporal del gráfico MÁS el marco temporal más alto: MOSTRANDO ZONAS ANIDADAS. A todos
AW Trend Predictor MT5
AW Trading Software Limited
4.76 (54)
La combinación de niveles de tendencia y ruptura en un sistema. Un algoritmo de indicador avanzado filtra el ruido del mercado, determina la tendencia, los puntos de entrada y los posibles niveles de salida. Las señales indicadoras se registran en un módulo estadístico, que le permite seleccionar las herramientas más adecuadas, mostrando la efectividad del historial de señales. El indicador calcula las marcas Take Profit y Stop Loss. Manual e instrucciones ->   AQUÍ   / Versión MT4 ->   AQUÍ Có
ICT, SMC, SMART MONEY CONCEPTS, SMART MONEY, Smart Money Concept, Support and Resistance, Trend Analysis, Price Action, Market Structure, Order Blocks, BOS/CHoCH,   Breaker Blocks ,  Momentum Shift,   Supply&Demand Zone/Order Blocks , Strong Imbalance,   HH/LL/HL/LH,    Fair Value Gap, FVG,  Premium  &   Discount   Zones, Fibonacci Retracement, OTE, Buy Side Liquidity, Sell Side Liquidity, BSL/SSL Taken, Equal Highs & Lows, MTF Dashboard, Multiple Time Frame, BigBar, HTF OB, HTF Market Structure
TPSpro TRENDPRO  - is a trend indicator that automatically analyzes the market and provides information about the trend and each of its changes, as well as giving signals for entering trades without redrawing! The indicator uses each candle, analyzing them separately. referring to different impulses - up or down impulse. Exact entry points into transactions for currencies, crypto, metals, stocks, indices!  -  Version MT4                  DETAILED DESCRIPTION        /       TRADING SETUPS       
El Indicador de Cuadrados de Gann es una herramienta poderosa de análisis de mercado basada en el artículo "Fórmula Matemática para Predicciones de Mercado" escrito por W.D. Gann, que se basa en conceptos matemáticos para el análisis. Incorpora elementos de las técnicas de Gann relacionadas con los cuadrados de 144, 90 y 52, así como el cuadrado de 9. Además, incluye el método del  sobre cómo combinar el cuadrado de 9 con canales y patrones de estrellas. Manual del Usuario y Modo de Uso: Antes d
Conviértase en un Breaker Trader y obtenga beneficios de los cambios en la estructura del mercado a medida que se invierte el precio. El indicador de ruptura de bloque de órdenes identifica cuándo una tendencia o movimiento de precio se acerca al agotamiento y está listo para revertirse. Le alerta sobre cambios en la estructura del mercado que generalmente ocurren cuando una reversión o un retroceso importante están a punto de suceder. El indicador utiliza un cálculo patentado que identific
Dibuja automáticamente los niveles de soporte y resistencia MÁS los gaps de las velas de propulsión en su gráfico, para que pueda ver hacia dónde es probable que el precio se dirija a continuación y/o potencialmente retroceda. Este indicador está diseñado para ser utilizado como parte de la metodología de negociación de posiciones que se enseña en mi sitio web (The Market Structure Trader) y muestra información clave para la orientación y entradas potenciales. MT4 Version:  https://www.mql5.c
A key element in trading is zones or levels from which decisions to buy or sell a trading instrument are made. Despite attempts by major players to conceal their presence in the market, they inevitably leave traces. Our task was to learn how to identify these traces and interpret them correctly. Reversal First Impulse levels (RFI)   -  Version MT4                  INSTRUCTIONS                 RUS                 ENG                         R ecommended to use with an indicator   -  TREND PRO  
Introduciendo       Quantum Breakout PRO   , el innovador indicador MQL5 que está transformando la forma en que comercia con Breakout Zones. Desarrollado por un equipo de comerciantes experimentados con experiencia comercial de más de 13 años,       Desglose cuántico PRO       está diseñado para impulsar su viaje comercial a nuevas alturas con su innovadora y dinámica estrategia de zona de ruptura. El indicador de ruptura cuántica le dará flechas de señal en las zonas de ruptura con 5 zonas
The Volume by Price Indicator for MetaTrader 5 features Volume Profile and Market Profile TPO (Time Price Opportunity). Get valuable insights out of currencies, equities and commodities data. Gain an edge trading financial markets. Volume and TPO histogram bar and line charts. Volume Footprint charts. TPO letter and block marker charts including split structures. Versatile segmentation and compositing methods. Static, dynamic and flexible ranges with relative and/or absolute visualizations. Lay
Owl Smart Levels MT5
Sergey Ermolov
4.47 (36)
Versión MT4  |  FAQ El Indicador Owl Smart Levels es un sistema comercial completo dentro de un indicador que incluye herramientas de análisis de mercado tan populares como los fractales avanzados de Bill Williams , Valable ZigZag que construye la estructura de onda correcta del mercado y los niveles de Fibonacci que marcan los niveles exactos de entrada. en el mercado y lugares para tomar ganancias. Descripción detallada de la estrategia Instrucciones para trabajar con el indicador Asesor de c
TrendLine PRO MT5
Evgenii Aksenov
4.78 (49)
El indicador Trend Line PRO es una estrategia comercial independiente. Muestra el cambio de tendencia, el punto de entrada a la transacción, así como calcula automáticamente tres niveles de Take Profit y la protección contra la pérdida de Stop Loss Trend Line PRO es perfecto para todos los símbolos de Meta Trader: monedas, metales, criptomonedas, acciones e índices Ventajas de Trend Line PRO: Nunca vuelve a dibujar sus señales Posibilidad de utilizar como estrategia independiente Tiene tres niv
Gartley Hunter Multi
Siarhei Vashchylka
5 (5)
Gartley Hunter Multi - An indicator for searching for harmonic patterns simultaneously on dozens of trading instruments and on all classic timeframes: (m1, m5, m15, m30, H1, H4, D1, Wk, Mn). Manual (Be sure to read before purchasing) | Version for MT4 Advantages 1. Patterns: Gartley, Butterfly, Shark, Crab. Bat, Alternate Bat, Deep Crab, Cypher 2. Simultaneous search for patterns on dozens of trading instruments and on all classic timeframes 3. Search for patterns of all possible sizes. Fr
Trend Line Map Pro MT5
STE S.S.COMPANY
4.67 (9)
El indicador Trend Line Map es un complemento para Trend Screener Indicator. Funciona como un escáner para todas las señales generadas por el evaluador de tendencias (Trend Line Signals). Es un escáner de líneas de tendencia basado en el indicador de evaluación de tendencias. Si no tiene el indicador Trend Screener Pro, Trend Line Map Pro no funcionará. It's a Trend Line Scanner based on Trend Screener Indicator. If you don't have Trend Screener Pro Indicator,     the Trend Line Map Pro will
TrendDecoder Premium MT5
Christophe, Pa Trouillas
5 (1)
Identifique los rangos y los próximos movimientos probables  |  Obtenga las señales más tempranas y la fuerza de las Tendencias   |  Obtener salidas claras antes de reversión   |  Detecte los niveles de Fibo que el precio pondrá a prueba   |  Indicador no repintado y no retardado - ideal para la trading manual y automatizada - adecuado para todos los activos y todas las unidades temporales 69$   para el lanzamiento - luego de nuevo a >>   $ 149 Después de la compra,   póngase en contacto con mi
MetaBands M5
Vahidreza Heidar Gholami
4.67 (3)
MetaBands utiliza algoritmos potentes y únicos para dibujar canales y detectar tendencias para que pueda proporcionar a los traders puntos potenciales para entrar y salir de operaciones. Es un indicador de canal junto con un potente indicador de tendencia. Incluye diferentes tipos de canales que se pueden fusionar para crear nuevos canales simplemente utilizando los parámetros de entrada. MetaBands utiliza todos los tipos de alertas para notificar a los usuarios sobre eventos del mercado. Caract
Was: $249  Now: $99   Market Profile defines a number of day types that can help the trader to determine market behaviour. A key feature is the Value Area, representing the range of price action where 70% of trading took place. Understanding the Value Area can give traders valuable insight into market direction and establish the higher odds trade. It is an excellent addition to any system you may be using. Inspired by Jim Dalton’s book “Mind Over Markets”, this indicator is designed to suit the
Otros productos de este autor
Introducción del indicador: El indicador dibuja la línea de tendencia y el histograma, tiene un pequeño retraso en el precio y no tiene funciones futuras, las señales no se desviarán. Cuando el mercado está bajo oscilaciones entre áreas, si el indicador aparece histograma rojo y verde, esta es una zona de precio bajo, si el indicador aparece histograma magenta y amarillo, esta es una zona de precio alto. También se puede utilizar para analizar la tendencia del mercado según la zona de precio
FREE
Indicator Introduction: The indicator comes from network ,It is more stable relative to RSI or CCI. It can be used to analyze market trend and design new expert that is based on trend. If the indicator below the axis ,this is a buy zone. The trend indicator is suitable for M1 and above timeframes.  The work of the indicator is shown in the screenshots. My other indicators and EAs can be found at here :  https://www.mql5.com/zh/users/hzx/seller
FREE
Indicator introduction: The indicator is calculated by volumes and prices, It is a single side indicator, only has up arrow signals. It is better to use it in conjunction with other trend indicators, and you need to find the most efficient time to use it in order to acquire a high winning probability. The indicator can send emails, alerts and notifications to you when the indicator before k line has an up arrow. The indicator's parameters can be changed, including the computation period of the
FREE
Indicador Introducción El indicador está diseñado de acuerdo con fórmulas de promedio móvil, que es más estable y tiene menos retraso que RSI o CCI. El indicador tiene tres valores de indicador, el período de promedio móvil y los colores de la línea se pueden cambiar manualmente. ¿Qué puede aportarte este indicador? Señales de entrada precisas: el indicador dibuja señales de flecha hacia arriba y hacia abajo. Análisis de tendencia multiperíodo: al cargar este indicador en un gráfico de marco de
The Waterfall Trend Indicator MT5 uses line regression algorithm, using "Waterfall" in its name is in that it like waterfall when there is a strong down market trend. The indicator draws seven lines, one of which is sold line, others are dash line, the sold line is more stable. Indicator introduction  The indicator can effectively filter price noise since it is calculated with line regression. It can be used to analyze market trend and design new expert that is based on trend. When the trend lin
Advanced Trader MT5 is a fully automated trading robot developed by using custom indicator "Trend for MT5", which can be found here . The expert has been tested on AUDNZD、NZDCAD、AUDCAD and USDCHF using historical data of many years, you can also test it using real ticks history data on MT5 backtest platform. Even if you don't want to 100% automatically trade by it, you can still use it as a good tool for trading, there is parameters for you to control the EA trading and use it as a trade assist
GOLD EA MT5 es un robot comercial completamente automatizado, que se desarrolla utilizando el indicador "Trend for MT5". Se basa en el sistema de red neuronal + cuadrícula, selecciona oportunidades comerciales con alta probabilidad de ganancias y bajo riesgo. El depósito inicial mínimo es de 250 USD por 0,01 lotes iniciales, cada posición tiene un stop loss oculto. EA tiene buenos resultados en XAUUSD y la reducción máxima es relativamente baja. Puede usar una prueba retrospectiva de precio abi
Indicator introduction:  A channel and trend line indicator, which is a good tool for manual trading, and also can be used for creating new EAs, without drifting or repainting.  It applies to any timeframes and any symbols.   The work of the indicator is shown in the screenshots. For any novice and programming trading friend, you can write the signal into the EA to play freely, buffer 0 corresponds to the bold trend line, buffer 4 and 5 respectively corresponds to the channel's upper and lower f
Filtro:
7Biblo7Induc7
385
7Biblo7Induc7 2023.04.17 15:03 
 

Very good indicator!

Zhi Xian Hou
3223
Respuesta del desarrollador Zhi Xian Hou 2023.04.17 15:13
Thanks for your positive feedback, my other indicators and EAs are also good, you can try it.
Respuesta al comentario
Versión 1.2 2022.11.28
Fixed zero divided error
Versión 1.1 2022.11.25
changed parameter settings