Diamond by MMD MT5
- Indicadores
- Mariusz Maciej Drozdowski
- Versión: 7.33
- Actualizado: 26 abril 2023
- Activaciones: 5
Diamante por MMD
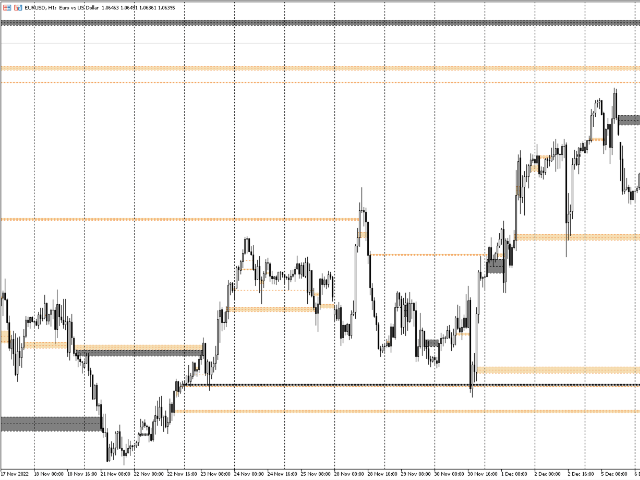
Diamond by MMD es un indicador avanzado que identifica lugares que son importantes para el comportamiento de los precios.
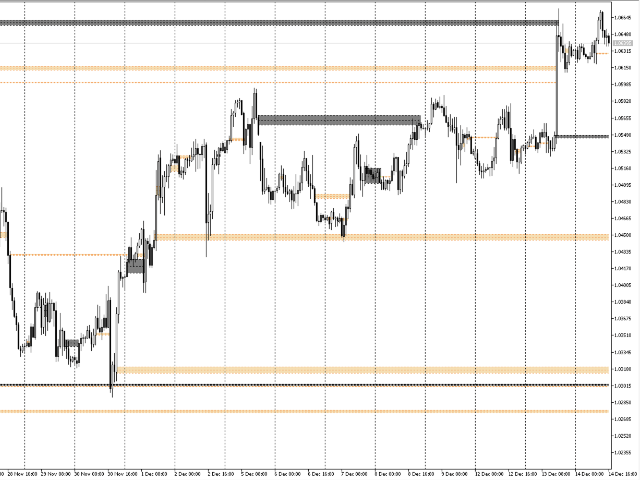
Este indicador, en cualquier período de tiempo, detecta y marca zonas de reacción de precios en el gráfico.
Los diamantes, uno de los elementos de la pirámide del conocimiento en la metodología MMD, son velas que cumplen condiciones muy estrictas.
Hay dos tipos principales de diamantes:
- diamante estándar
- demencia inversa.
Ambos modelos se identifican y marcan automáticamente en el gráfico.
El indicador puede marcar diamantes, por ejemplo, desde el intervalo M5 en el intervalo H1. La configuración predeterminada del indicador muestra diamantes en el período de tiempo en el que actualmente tiene abierto su gráfico.
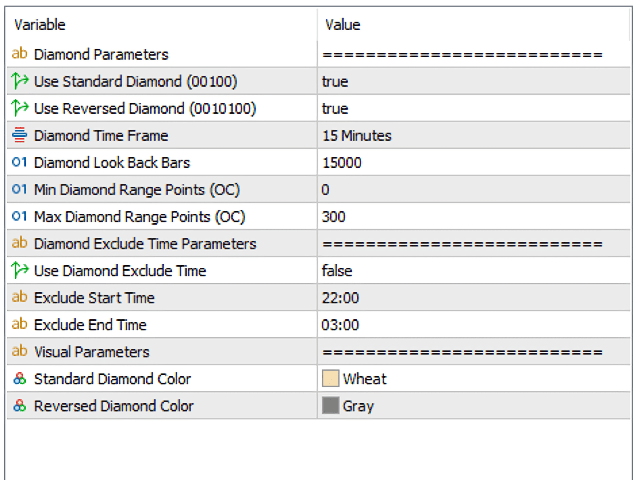
Descripción de los parámetros del indicador.
Usar diamante estándar: muestra/oculta diamantes en el modelo 00100
Usar diamante invertido: muestra/oculta diamantes en el modelo 0010100
Marco de tiempo de diamantes: una opción que le permite indicar el intervalo a partir del cual se mostrarán los diamantes. Es posible mostrar, por ejemplo, diamantes del intervalo M5 en el gráfico con velas M1 o H1.
Barras de búsqueda de diamantes: especifican el número de velas, en un intervalo dado, que se escanearán, en busca de velas que cumplan con los parámetros seleccionados para los diamantes.
Puntos mínimos de rango de diamantes: tamaño mínimo de diamantes (en puntos).
Max Diamond Range Points: tamaño máximo de diamante (en puntos).
Use Diamond Exclude Time - activación/desactivación del parámetro. Este parámetro es el encargado de determinar el tiempo en que las velas que cumplan las condiciones establecidas para los diamantes no se marcarán en el gráfico. Esto se aplica en particular a las horas nocturnas.
Excluir hora de inicio: indicación del comienzo del período en el que los diamantes no se marcarán.
Excluir hora de finalización: indicación del final del período en el que los diamantes no se marcarán.
Color de diamante estándar: el color del diamante estándar.
Color del diamante invertido: el color del diamante invertido.