Trend speed vector oscillator MT4
- Indicadores
- Ekaterina Saltykova
- Versión: 1.0
- Activaciones: 5
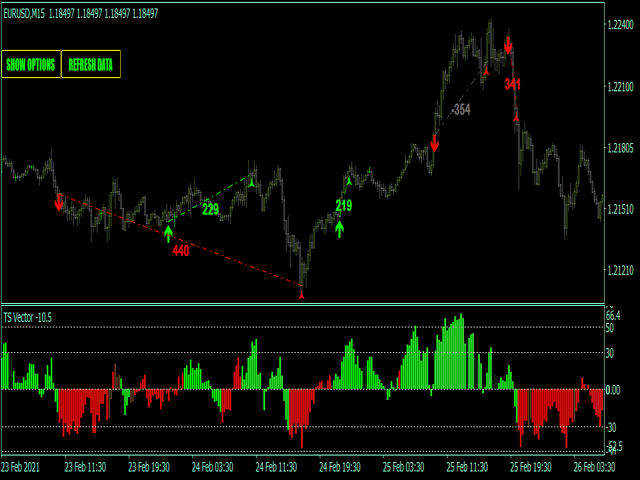
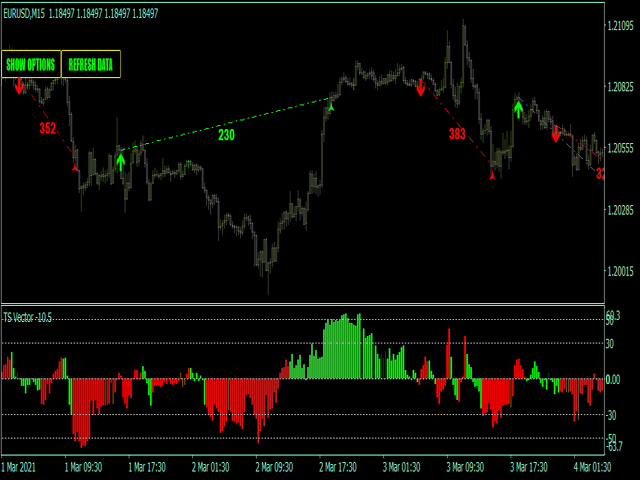
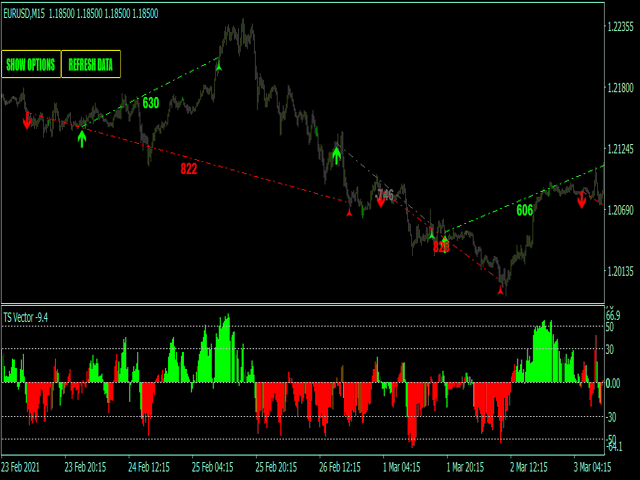
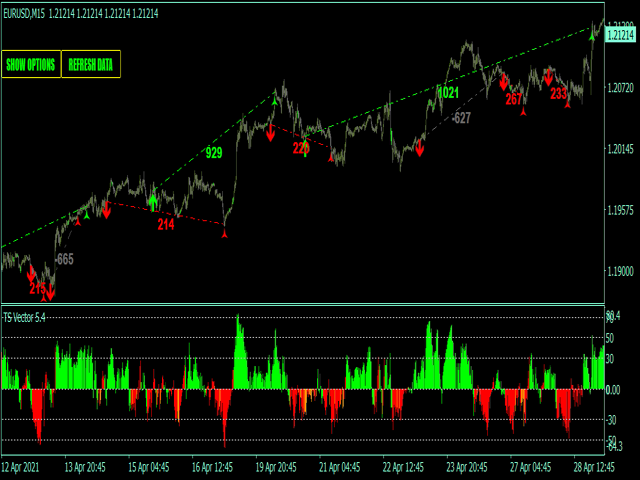
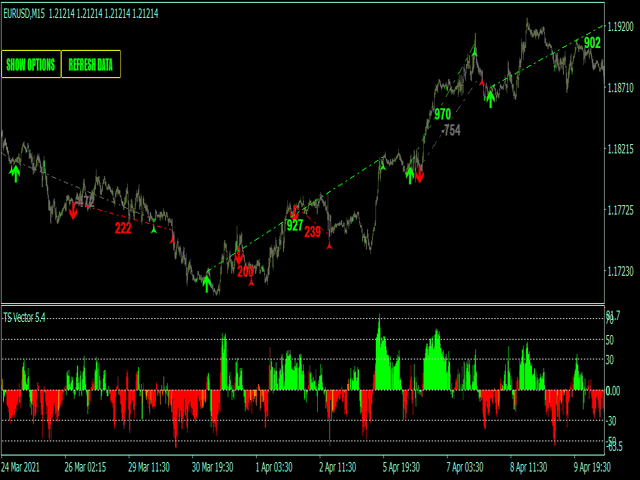
Trend speed vector - is the oscillator for manual trading. System measures trend direction and it's speed.
Histogram shows 4 colors:
- Lime --> Strong up movement with good gain speed;
- Green --> Up movement with low gain speed
- Red --> Strong down movement with good gain speed;
- Orange --> Down movement with low gain speed
Green and Orange histograms show weak market's movements and thуese places excluded from signal points. Buy arrow is plotted during strong down movement when bearish gain speed is low and up reverse background appears. Sell arrow is plotted during strong up movement when bullish gain speed is low and down reverse background appears.
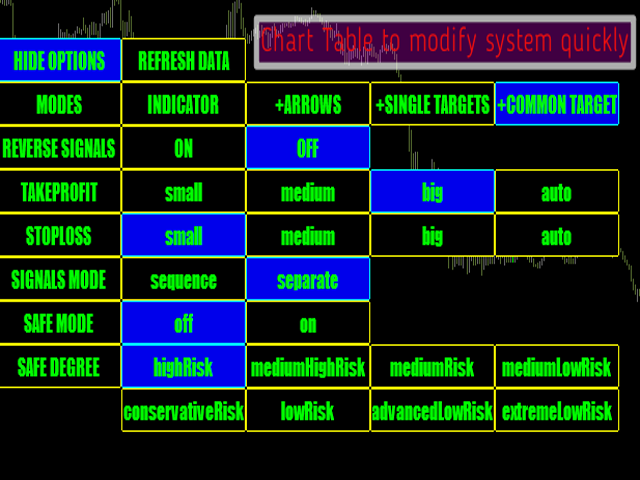
Main indicator's adjustable inputs :
- marketTrendPeriod - period for main indicator calculations;
- marketSpeedTrigger - measures from 10 - till 60 ;
Main Indicator's Features
- Signals are not repaint, late or disappear;
- Every signal comes at the open of new bar(system uses only confirmed signals);
- Indicator has Alerts, Mail and Push notifications(allow to trade out of PC, from smartphone/mobile app);
- Indicator has profit/loss targets;
Recommendations for trading
- EURUSD, GBPUSD, GBPJPY, AUDUSD, USDJPY;
- Best timeframes - M5-M30 timeframe;