Triple trend index
- Indicadores
- Ekaterina Saltykova
- Versión: 1.0
- Activaciones: 5
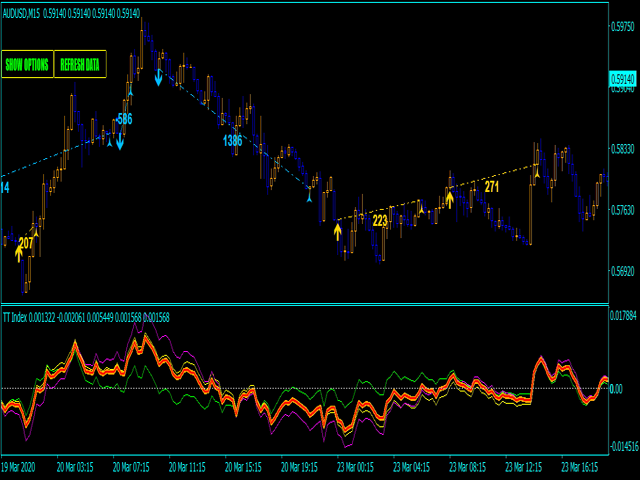
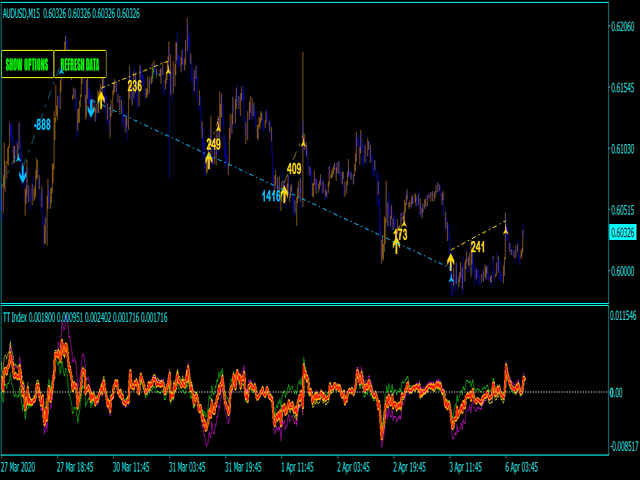
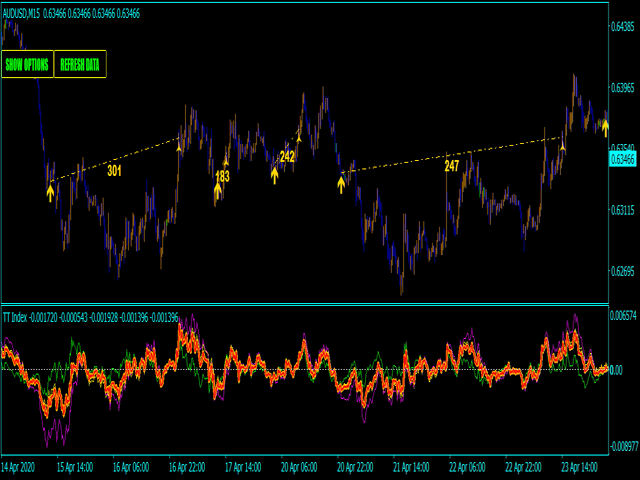
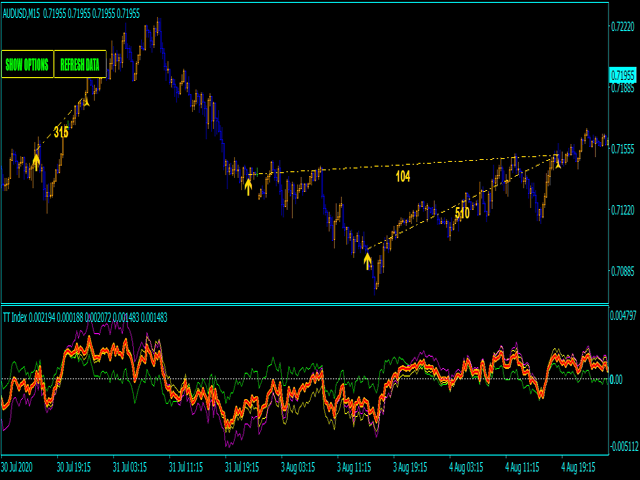
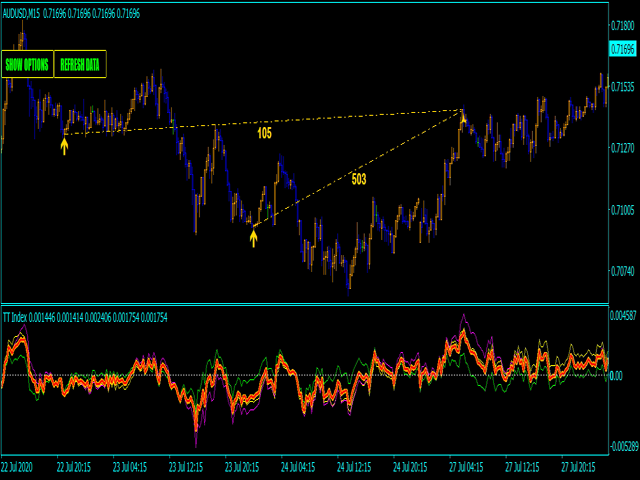
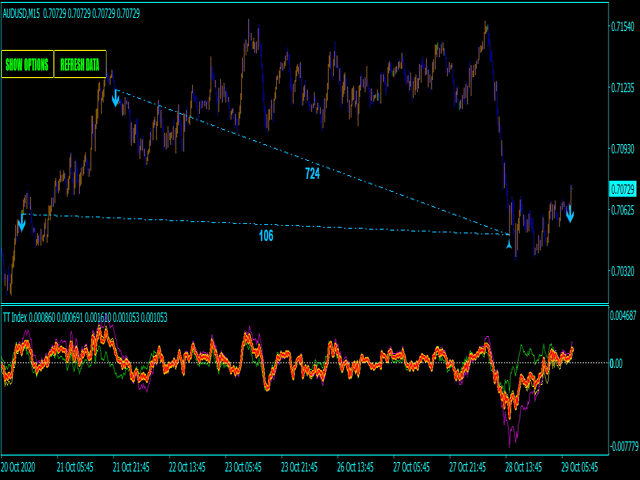
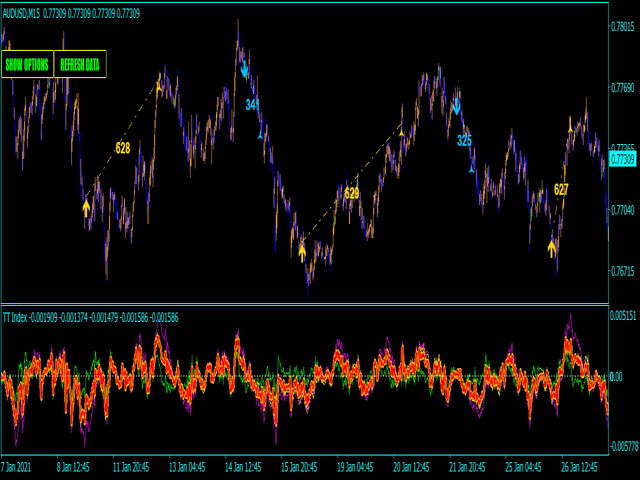
Triple trend index is the manual trading system/indicator. It looks for trend reversal points according to main trend index datas. Indicator represents 4 lines. 3 lines shows trend power by main market's parametres. 4th line (OrangeRed) is the main index. When line is above zero level - market is bullish, value below zero show bearish pressure. Indicator "looks" for weak places(reversal points) on bullish market to plot a sell arrow and weak places(reversal points) on bearish market to plot a buy arrow.
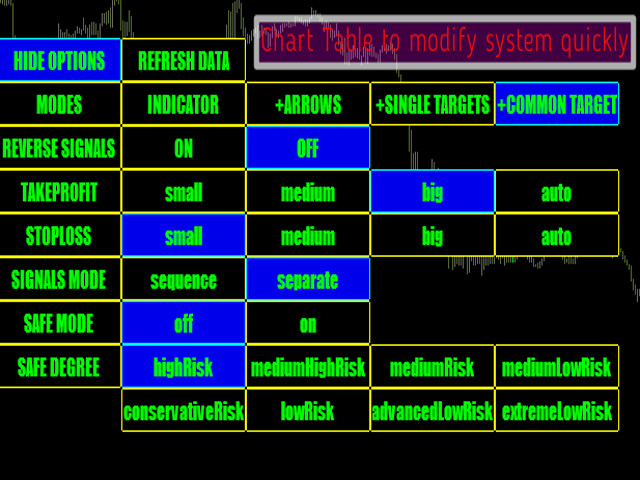
Aslo, system allows to reverse signal points.
Main indicator's adjustable inputs :
- mainPeriod
- smoothPeriod
- filterPeriod
All 3 periods participates in the Triple trend index formation.
Main Indicator's Features
- Signals are not repaint, late or disappear;
- Every signal comes at the open of new bar(system uses only confirmed signals);
- Indicator has Alerts, Mail and Push notifications(allow to trade out of PC, from smartphone/mobile app);
- Indicator has profit/loss targets;
Recommendations for trading
- EURUSD, GBPUSD, AUDUSD, USDCAD, USDJPY;
- Best timeframes - M15-H4 timeframe;