RFOC Mini Chart
- Indicadores
- Ronaldo Franco De Oliveira Cardoso
- Versión: 1.0
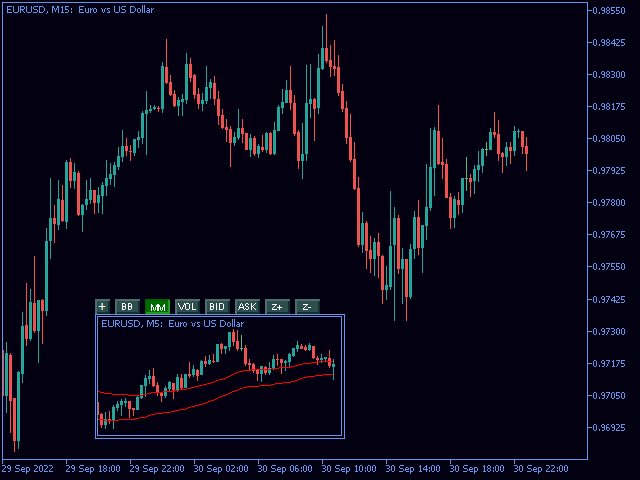
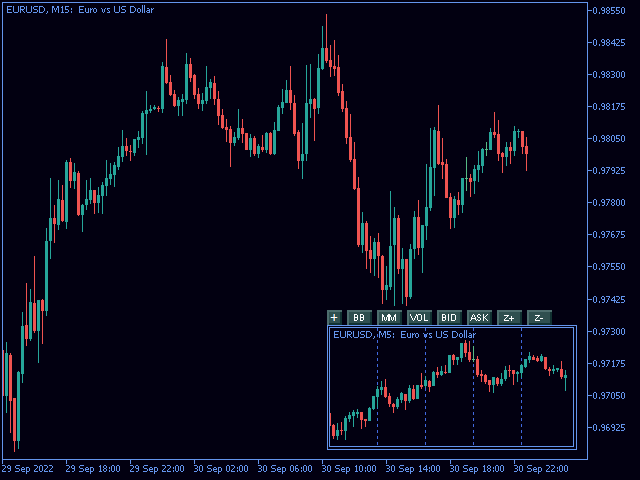
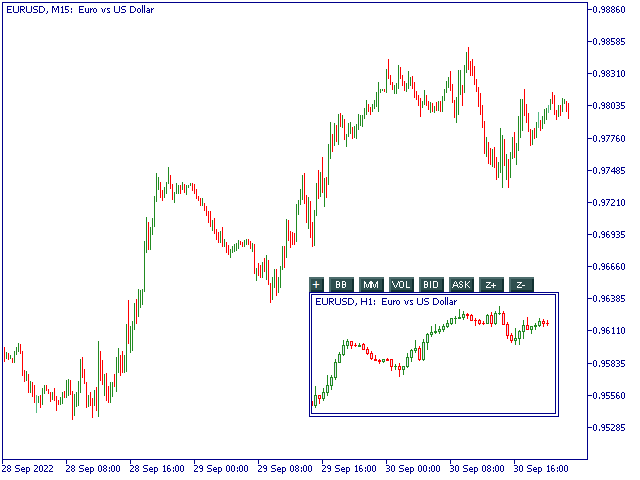
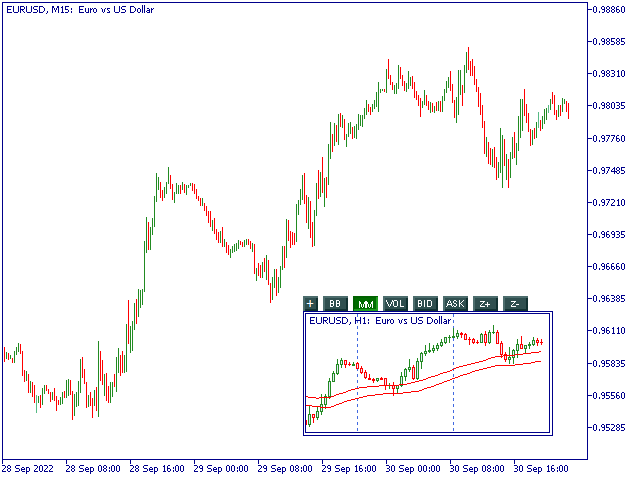
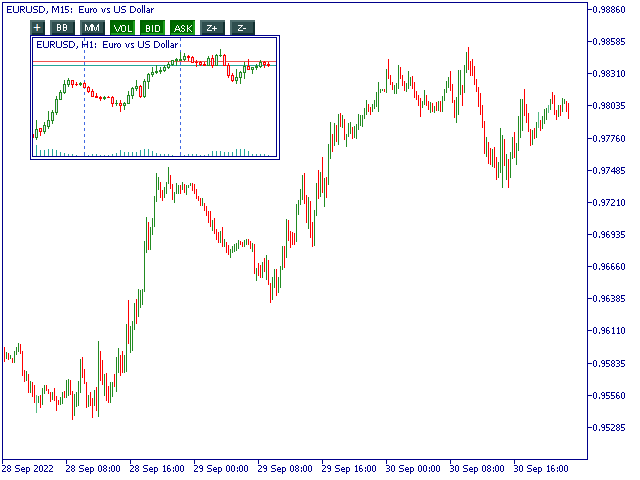
The RFOC Mini Chart was created to project a macro view of the market, which the option to select the timeframe of interest other than the main chart, it is possible to include 2 indicators:
1 - Moving average channel On the mini chart, the moving average will be created based on the prices of the selected time frame for the RFOC Mini Chart.
The moving average period must be selected in the indicator settings pannel.
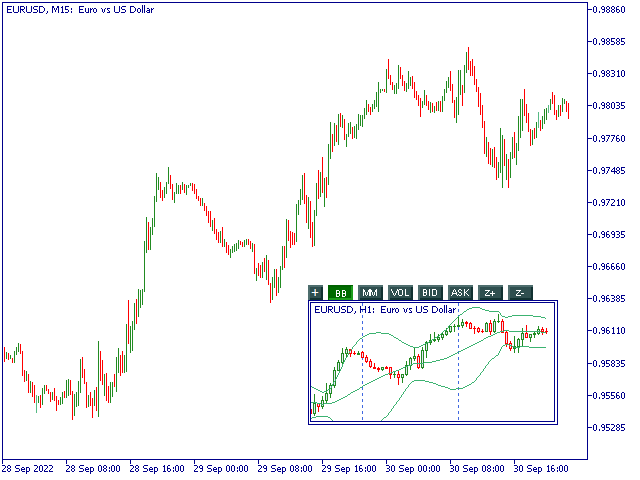
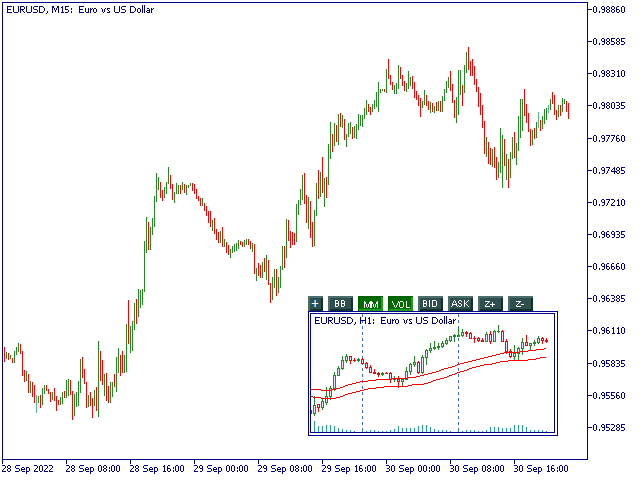
2 - Boillinger Band In the mini chart, a boillinger band will be created based on the prices of the time frame selected for the RFOC Mini Chart.
The boillinger band is configurable in the indicator settings pannel.