Digital Trend Detector mt5
- Indicadores
- Francisco De A Vilar Enriquez
- Versión: 1.0
- Activaciones: 5
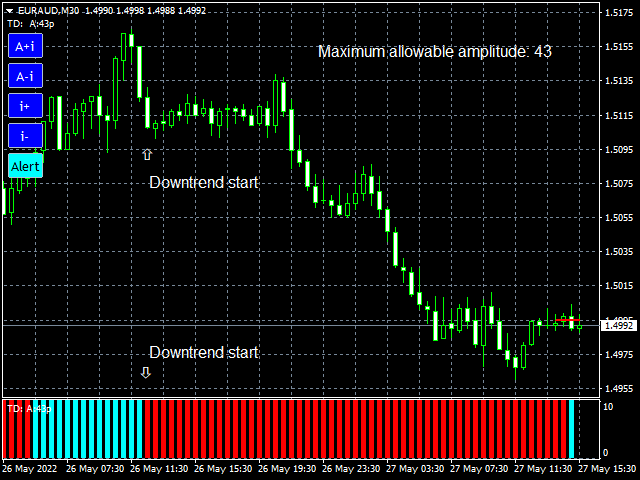
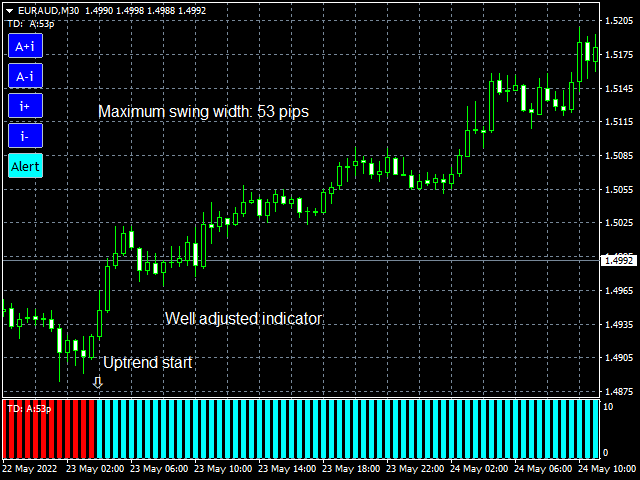
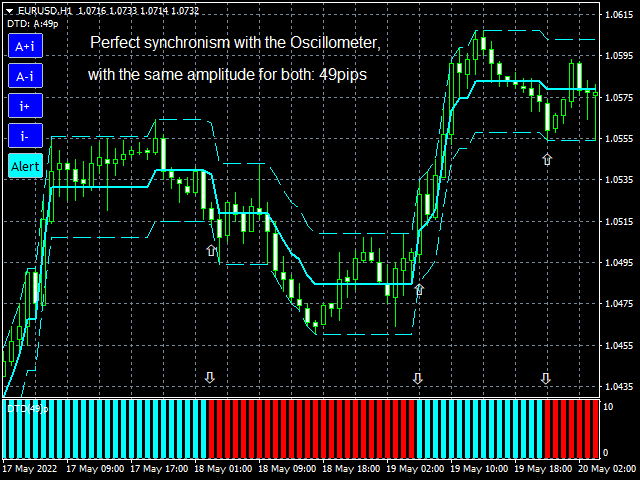
It is a very comfortable and easy to use indicator, as well as very powerful and precise. It is a digitalization of the Oscillometer indicator. Detects and visually shows us the beginning of a new trend. The way to present it, is by means of a two-color bar graph, one for the start of the uptrend, and one for the start of the downtrend. The parameter with which the indicator is built, is the maximum allowed amplitude of price oscillation. The indicator will follow the price checking its amplitude of oscillation, as soon as this is greater than the maximum amplitude allowed, it will be identified as the beginning of a new trend and it will change color on the bar chart.
Features:
- It has no delay.
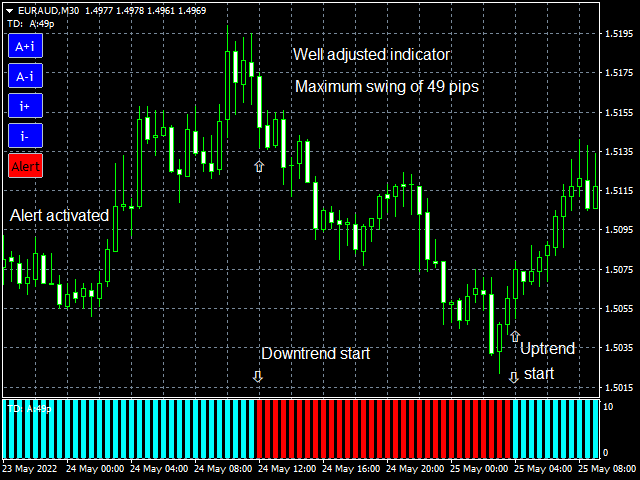
- It has the option to activate the new trend alert with an alert control.
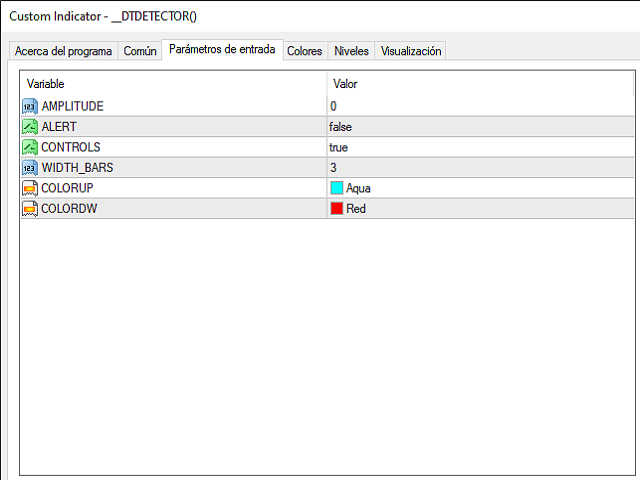
- Blue controls to vary the maximum amplitude allowed, given in pips, dynamically, on the chart with the mouse. With an amplitude value of 0 in the parameter box, the indicator calculates one by default.
- It is robust against price distortions.
- By default, it uses the color aqua for the start uptrend, and red for the start downtrend.
- It does not depend on the time frame in which it is, being transferable from one time frame to another without further ado.
- The width of the bar graph is variable with the mouse.
- It is exactly synchronized with the Oscillometer indicator, with the same amplitude of oscillation.
Blue controls.
There are four. The first two, marked A+i and A-i , increase or decrease the maximum allowed amplitude with increment i. The bottom two, marked i+ and i-, increase or decrease the increment i by multiplying it, or dividing it, by 2. All this in pips. Both the amplitude and the increment are shown on the graph at the top left.
Alert Control.
Allows you to activate/deactivate the alert of new trend. It turns red when activated. To make it permanent, it must be set in the parameters box.
Indicator adjustment.
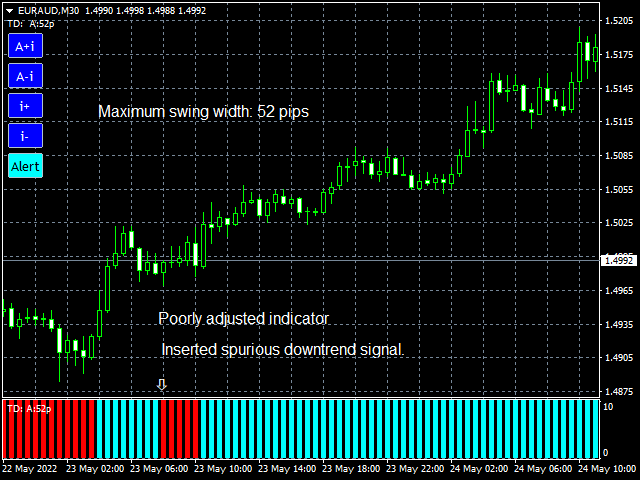
For the indicator to be useful, it is necessary to adjust it to the price, modifying it with the controls until it does not show bar changes in the sections of interest. Once the amplitude is set, it will be set in the indicator's parameter box.
Adjustment rule: always set the smallest amplitude of oscillation allowed within the same section, which does not present spurious signals.
Recommended indicator: The Oscillometer mt5, Deviation Index mt5.
Contact email: fve2022@hotmail.com