• Información general
  • Comentarios
  • Discusión
  • Novedades

Pipsurfer

Overview:

With so much noise and distraction in the markets I wanted to create clarity for traders to have a simple, efficient, and fun trading experience. This is why I created Pipsurfer. Pipsurfer is an trend following indicator that visually shows you important Institutional Smart Money levels in the market and helps you to trace Market Structure in the markets. Most traders find it difficult to visually see trading elements such as trend, structure and momentum which are key for understanding any potential entry.

After teaching hundreds of people to trade and currently have over 2000 students I have seen why so many traders struggle to have effective results in the trading world and wanted to provide an answer to the struggling traders to finally reach that level of understanding and proficiency in trading. Every Component of Pipsurfer is carefully calibrated and designed to give traders a unique but effective trading experience.

Pipsurfer Features:

  • A very easy to understand trading window that will guide you on what to pay attention to in the market
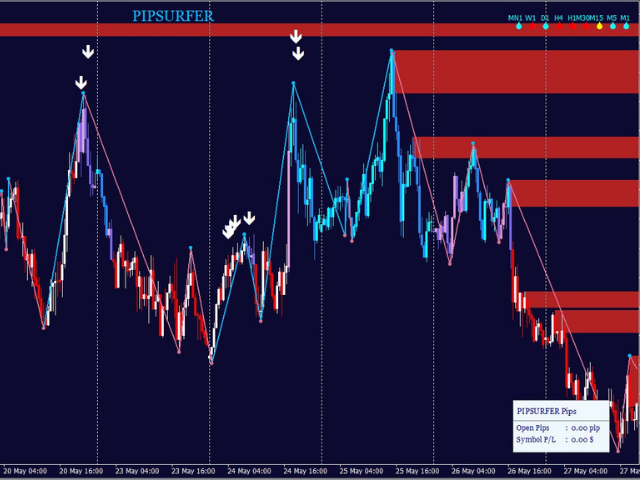
  • Entry Signal Arrows based on many different Market Structure, Trend And Institutional Levels 
  • 2 built in Trend Indicators for long term and short term trend, the multi time frame dashboard that shows you long term trend on every time frame for that pair and the trend candles which change color based on immediate and shorter term trend.
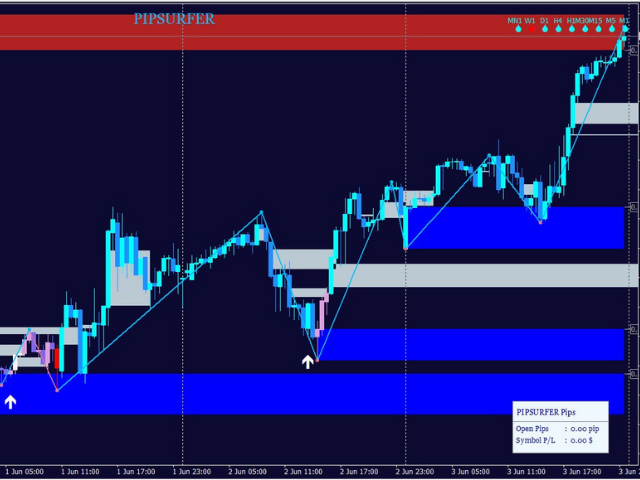
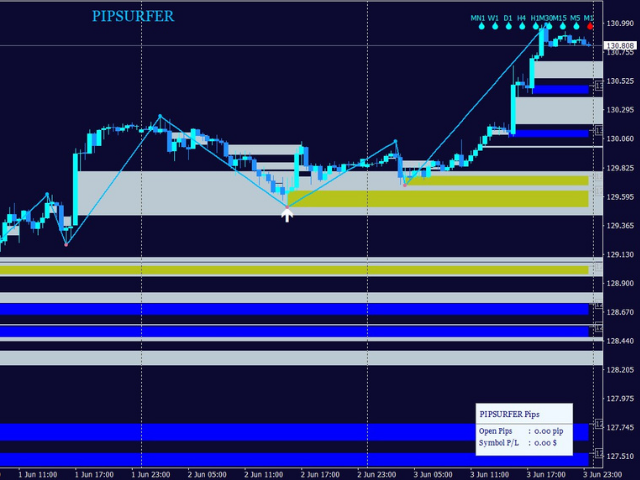
  • Automated Institutional Supply And Demand Zones ( Blue And Red Zones) that are different from the basic retail traders support and resistance show the real more effective price levels
  • Imbalance Zones (Gray Zones) that help you see the often hidden smart money levels in the market so traders know what levels to pay attention to for a smooth trading experience. 
  • Market Structure Indicator That tells you when there are bullish or bearish market structure in the markets 
  • Pip Counter and Profit Tracker 
  • Access To A Setup And Pipsurfer Strategy Course 
  • Access To My Weekly Live Calls 
  • Free Access To Tide Meter Indicator (listed in MQL5) which is designed to work with Pipsurfer Indicator and help traders determine swings in momentum in real time.

Disclaimer:

*Pipsurfer doesn't guarantee profits and trading involves financial risk. Do not trade with money you cannot afford to lose. Consult with a licensed financial professional to determine if trading is right for you. 


Productos recomendados
CyberZingFx Volume Plus
Afsal Meerankutty
4.93 (15)
Advanced version of CyberZingFx Volume Plus, the ultimate MT4 indicator for traders seeking highly accurate buy and sell signals. With an additional strategy and price action dot signals that enhances its effectiveness, this indicator offers a superior trading experience for professionals and beginners alike. The CyberZingFx Volume Plus Advanced version combines the power of volume analysis and historical price data with an additional strategy, resulting in even more precise and reliable signals
Indicador Forex "patrón del hombre colgado" para MT4 El indicador "Patrón del hombre colgado" es un indicador muy potente para el comercio de acción del precio: sin repintado, sin retrasos; El indicador detecta patrones bajistas del Hombre Colgado en el gráfico: señal de flecha roja en el gráfico (ver imágenes) Se incluyen alertas para PC, dispositivos móviles y correo electrónico El indicador "Patrón del hombre colgado" es excelente para combinar con niveles de soporte/resistencia: https://w
Elliott Wave Trend was designed for the scientific wave counting. This tool focuses to get rid of the vagueness of the classic Elliott Wave Counting using the guideline from the template and pattern approach. In doing so, firstly Elliott Wave Trend offers the template for your wave counting. Secondly, it offers Wave Structural Score to assist to identify accurate wave formation. It offers both impulse wave Structural Score and corrective wave Structure Score. Structural Score is the rating to sh
Gartley Projection D
Oleksandr Medviediev
3.71 (7)
El indicador identifica los patrones armónicos (XABCD) según los desarrollos de H.M.Gartley ("Beneficios en el mercado de valores", 1935г). Proyecta el punto D como un punto en la proyección en perspectiva (especifique ProjectionD_Mode = true en la configuración). No vuelve a dibujar. Cuando se cierra una barra del período de trabajo, si el punto del patrón identificado no se ha movido durante las barras Patterns_Fractal_Bars, aparece una flecha en el gráfico (en la dirección del movimiento
Introduction to Chart Pattern MT Chart Pattern MT is a chart pattern scanner to detect the triangle pattern, falling wedge pattern, rising wedge pattern, channel pattern and so on. Chart Pattern MT uses highly sophisticated chart pattern detection algorithm. However, we have designed it in the easy to use with intuitive user interface. Chart Pattern MT will show all the patterns in your chart in the most efficient format for your trading. You do not have to do tedious manual pattern detection an
Day Pattern
Oleksandr Martsynyshen
Description: - D ay Pattern - an indicator that helps to identify patterns of price changes for the development of trading algorithms and strategies. For whom this tool? - For developers of trading strategies and algorithms. - Medium- and long-term traders. Time frames H1-W1. Features of the indicator: - There is a function of exporting indicator values to a file of the csv format. - Using the information panel, you can conduct an express analysis of trading tool. - The indicat
Monster Harmonic Indicator
Paul Geirnaerdt
4.61 (31)
Monster Harmonics Indicator is a harmonic pattern indicator. It recognizes Gartley, Bat, Crab, Butterfly, Cypher, White Swan, Black Swan, Shark and several other patterns. Projected patterns that are not yet completed are recognized, too. Monster even shows the PRZ (Potential Reversal Zone). Users can add their own user defined patterns to Monster. Besides the current pattern, Monster also shows all patterns in the symbols history. Monster will provide alerts for developing patterns. Introduced
ZigZag Professional
Dmitriy Kashevich
5 (1)
the zigzag indicator draws lines on the chart from the highest point to the lowest There are built-in fibonacci levels built-in sound alert the indicator highlights trends on small timeframes with a thin line and trends highlights with a coarse line Fibonacci levels can be turned on and off in the settings settings are very simple and clear the same sound alert can be turned on and off, you can change the colors of the lines.
Introduction to X3 Chart Pattern Scanner X3 Cherart Pattern Scanner is the non-repainting and non-lagging indicator detecting X3 chart patterns including Harmonic pattern, Elliott Wave pattern, X3 patterns, and Japanese Candlestick patterns. Historical patterns match with signal patterns. Hence, you can readily develop the solid trading strategy in your chart. More importantly, this superb pattern scanner can detect the optimal pattern of its kind. In addition, you can switch on and off individu
El indicador muestra patrones armónicos en el gráfico basado en Dynamic ZigZag (   https://www.mql5.com/en/market/product/5356   ) y es casi un análogo completo de una de las versiones de los conocidos korHarmonics. El indicador reconoce los siguientes patrones y sus variedades: ABCD, Gartley (Butterfly, Crab, Bat), 3Drives, 5-0, Batman, SHS, One2One, Camel, Triangles, WXY, Fibo y Vibrations. Solo la visualización de patrones ABCD y Gartley está habilitada en la configuración de forma predetermi
Introduction It is common practice for professional trades to hide their stop loss / take profit from their brokers. Either from keeping their strategy to the themselves or from the fear that their broker works against them. Using this indicator, the stop loss / take profit points will be drawn on the product chart using the bid price. So, you can see exactly when the price is hit and close it manually.  Usage Once attached to the chart, the indicator scans the open orders to attach lines fo
The multitime frame channel indicator in automatic mode provides a visual display of support and resistance lines. It will be useful to all traders who use technical analysis in their work. The indicator can be used as a standalone market analysis tool, or as part of a trading strategy. Settings TimeFrame - timeframe to build the channel; Line color - The color of the channel lines; Mark the intersection? - Mark with a marker the price crossing the channel borders?
[ MT5 Version ] Bulls and Bears Power Bulls and Bears Power is an indicator that clearly highlights if bulls or bears are currently in control of the market. A price movement started with high Bulls control in the market can indicate the beginning of a new trend movement. The relative indicator power between price peaks also indicates if the movement is losing strength and might foresee a significant correction or a trend reversal. Bulls and Bears Power indicator offers a clear and simplified vi
The indicator detects and displays Shark harmonic pattern (see the screenshot). The pattern is plotted by the extreme values of the ZigZag indicator (included in the resources, no need to install). After detecting the pattern, the indicator notifies of that by a pop-up window, a mobile notification and an email. The indicator highlights the process of the pattern formation and not just the complete pattern. In the former case, it is displayed in the contour triangles. After the pattern is comple
UPD1 Volume Pixel
Vitaliy Kuznetsov
5 (3)
El indicador encuentra un volumen bajo, alto y extremo basado en los coeficientes dados y los colorea en los colores especificados. Reemplaza la función estándar de dibujo de volúmenes en el terminal metatrader. Las velas también se pueden pintar en el color del volumen. En las velas con un volumen extremo, se determina el volumen horizontal máximo (cluster/POC). Dependiendo de su ubicación (empujar, neutral, detener), el clúster también tiene su propio color. Si el clúster está en la sombra y
Master Scalping M1 es un indicador innovador que utiliza un algoritmo para determinar la tendencia de forma rápida y precisa. El indicador calcula el tiempo de apertura y cierre de posiciones, los algoritmos del indicador le permiten encontrar los momentos ideales para ingresar a una operación (comprar o vender un activo), lo que aumenta el éxito de las transacciones para la mayoría de los comerciantes. Beneficios del indicador: Fácil de usar, no sobrecarga el gráfico con información innecesari
Market Structure Zig Zag
Lesedi Oliver Seilane
4.77 (22)
Free Market structure zig zag to assist in price action trading the screenshots describe how to use and how to spot patterns new version comes with alerts, email alert and  push notification alert can be used on all pairs  can be used on all timeframes  you can add additional confirmation indicators the indicator shows you your higher high and low highs as well as your lower lows and lower highs  the indication makes price action analysis easier to spot.
FREE
VIP signals
BUYUK SAVDOGAR
VIP signal for binary options. This indicator was created specifically for binary options. Set up for profitable work in binary options. Try this indicator if you want to trade binary options profitably. The terms of trade are very simple. We are waiting for directions. We open a deal on the current timeframe in the direction. < < < Indicator non repaint > > > Many users have already rated it positively. The results will surprise you too. According to the test results, this indica
"Bitcoin indicator" is a ready-made mechanical trading system for Bitcoin. The system is implemented as an indicator that shows the trader on the chart the price reversal points and the current trend direction. This information is enough to effectively trade in the market. The "Bitcoin indicator" consists of a complex analytical block that constantly analyzes the market and shows the trader where the trend is heading. The indicator also shows with dots on the chart, the price reversal points. S
MonsterDash Harmonic Indicator is a harmonic pattern dashboard. It recognizes all major patterns. MonsterDash is a dashboard that displays all detected patterns for all symbols and (almost) all timeframes in sortable and scrollable format. Users can add their own user defined patterns . MonsterDash can open and update charts with the pattern found. Settings MonsterDash's default settings are good enough most of the time. Feel free to fine tune them to your needs. The color settings are for tho
Apex Trader MT4
Profalgo Limited
5 (4)
PROMOCIÓN DE LANZAMIENTO: Solo 5 copias disponibles a 199$ Precio final: 999$ NUEVO: ¡Compre ahora y obtenga 1 EA gratis!   (para 2 cuentas comerciales) Resultados en vivo:   https://www.mql5.com/es/señales/1836525 high risk account Presentamos la última incorporación a nuestra línea de robots de compraventa de divisas:     el Apex Trader   . Desarrollado con años de experiencia en la creación de asesores expertos, Apex Trader es una poderosa herramienta comercial para el mercado de divisas.
Super Gator
Agustinus Biotamalo Lumbantoruan
This indi shows the following 1. Supertrend 2. Alligator (Not a regular alligator) 3. ZigZag 4. Moving Average 5. Trend Continuation/Mini correction Signal (plotted in X) (See screenshots in green background color 6. Early Signal Detection (See screenshots in green background color) You may treat Alligator as the lagging indicator The leading indicator is the supertrend. The zig zag is based on the leading indicator where it gets plotted when the leading indicator got broken to the opposite.
Darwin Swing MT4
Guillaume Duportal
4.79 (14)
Darwin SWING Precio de lanzamiento 999 USD , precio futuro 1490 USD DESCRIPCIONES : -- Para entender cómo funciona, venga a leer el blog (Este EA refleja mi filosofía de comercio de divisas ... Si te gusta la forma en que veo las cosas, entonces te gustará mi EA. Tómate el tiempo para hacerlo. (Forex no es una carrera): https://www.mql5.com/en/blogs/post/745790 -- Para ver los resultados anteriores aquí están los enlaces a las señales Señales en vivo y de demostración: https://ww
RTrends
Nikolay Likhovid
The RTrends indicator does two things: first, it automatically draws the layout of the price chart by plotting trend lines and, secondly, it produces bearish and bullish signals. The layout reflects the fractal nature of the market. Trends from different time horizons are applied simultaneously on the chart. Thus, from a single chart a trader can see trend lines of higher timeframes. The lines, depending on the horizon, differ in color and width: the older the horizon, the thicker the line is. T
The new update makes this indicator a complete tool for studying, analyzing and operating probabilistic patterns. It includes: On-chart Multi-asset percentage monitor. Configurable martingales. Twenty-one pre-configured patterns , including Mhi patterns and C3. An advanced pattern editor to store up to 5 custom patterns. Backtest mode to test results with loss reports. Trend filter. Hit operational filter. Martingale Cycles option. Various types of strategies and alerts. Confluence between patte
The indicator displays Renko bars on the chart, uses them to plot the ZigZag - trend lines connecting the local Lows and Highs of the price movement, and highlights them based on the Gartley patterns, showing the potential price reversal points. Renko - specialized display of the price action, in which the graph is displayed not every bar of the time frame, but only under the condition that the price had passed more than the specified number of points. Renko bars are not bound to a time frame, s
The main idea of this indicator is rates analysis and prediction by Fourier transform. Indicator decomposes exchange rates into main harmonics and calculates their product in future. You may use the indicator as a standalone product, but for better prediction accuracy there is another related indicator - FreqoMaster - which uses FreqoMeterForecast as a backend engine and combines several instances of FreqoMeterForecast for different frequency bands. Parameters: iPeriod - number of bars in the ma
SMCpro VIP MT4  Original Price  $620   ---  Currently Price 20% OFF ( for unlimited use )   BONUS  AUX VIP Club 2024 : Include  EA Airbag  and  Load Data History  to enhance the performance of this tool to its maximum potential  Click Here to Download Files   ( for users only )   Hello World! Introducing.. SMCpro VIP tool and Indicator for MetaTrader 4, designed to revolutionize your trading experience with the ICT Smart Money Concept. This system is meticulously crafted to empower trad
Reversal Pattern Pro
Boonyapagorn Rodvattanajinda
Reversal Patterns Pro Reversal Patterns Pro is a Price Action (PA) analytical tool that scans the reversal patterns.  - Finds and marks the most dependable Japanese candlestick patterns in real-time. - Supports all time frames (Best for Scalping) - Doesn't repaint making it an exceptional indicator for Expert Advisors. Input parameters : - Support & Resistance Mode ( true or false ) for enabling advanced filtering - Donchian Period - RSI Period - RSI Oversold Level - RSI Overbought Level - 
VR Cub
Vladimir Pastushak
VR Cub es un indicador para obtener puntos de entrada de alta calidad. El indicador fue desarrollado para facilitar los cálculos matemáticos y simplificar la búsqueda de puntos de entrada a una posición. La estrategia comercial para la cual se diseñó el indicador ha demostrado su eficacia durante muchos años. La simplicidad de la estrategia comercial es su gran ventaja, que permite que incluso los operadores novatos negocien con éxito con ella. VR Cub calcula los puntos de apertura de posiciones
Los compradores de este producto también adquieren
TrendMaestro
Stefano Frisetti
5 (2)
note: this indicator is for METATRADER4, if you want the version for METATRADER5 this is the link: TRENDMAESTRO recognizes a new TREND in the bud, he never makes mistakes. The certainty of identifying a new TREND is priceless. DESCRIPTION TRENDMAESTRO identifies a new TREND in the bud, this indicator examines the volatility, volumes and momentum to identify the moment in which there is an explosion of one or more of these data and therefore the moment in which prices have strong probability of f
Presentamos el Indicador Milagroso de Forex: Desata el Poder del Trading Preciso ¿Estás cansado de buscar el mejor indicador de Forex que realmente ofrezca resultados excepcionales en todos los marcos temporales? ¡No busques más! Ha llegado el Indicador Milagroso de Forex para revolucionar tu experiencia de trading y llevar tus ganancias a nuevas alturas. Construido sobre una base de tecnología de vanguardia y años de desarrollo meticuloso, el Indicador Milagroso de Forex se erige como el pinácu
How to use Pair Trading Station Pair Trading Station is recommended for H1 time frame and you can use it for any currency pairs. To generate buy and sell signal, follow few steps below to apply Pair Trading Station to your MetaTrader terminal. When you load Pair Trading Station on your chart, Pair Trading station will assess available historical data in your MetaTrader platforms for each currency pair. On your chart, the amount of historical data available will be displayed for each currency pai
Indicator : RealValueIndicator Description : RealValueIndicator is a powerful tool designed specifically for trading on the EURUSD pair. This indicator analyzes all EUR and USD pairs, calculates their real currency strength values, and displays them as a single realistic value to give you a head start on price. This indicator will tell you moves before they happen if you use it right. RealValueIndicator allows you to get a quick and accurate overview of the EURUSD currency pair tops and bottoms,
Gann Signal
Kirill Borovskii
Gann Signal is a very simple indicator at first glance, but hidden inside is many years of experience in studying W.D.Ganna methods. The indicator gives accurate BUY/SELL signals, without redrawing. The indicator is very easy to use. All you need to do is attach it to your chart and follow its recommendations. The indicator constantly analyzes the market for entry opportunities. When such an opportunity appears, the indicator gives a signal in the form of an arrow. I repeat, all signals are NOT
Candle Power Pro
Thushara Dissanayake
4.33 (6)
Libere el poder de la información de volumen real con el indicador   Candle Power Pro   . Esta herramienta dinámica captura los datos del volumen real de cada vela y los presenta como un porcentaje del volumen total. Al hacerlo, le permite discernir la lucha en curso entre compradores y vendedores en el mercado. Candle Power Pro muestra la batalla entre compradores y vendedores como un porcentaje del volumen total, brindándole información valiosa sobre la dinámica del mercado. Puede confirmar fá
Market Breaker Updated version 3
Allistair Kabelo Mandow
1 (1)
Features for software Main functions: Accurate entry signals WITHOUT REPAINTING! Once a signal appears, it remains valid! This is a significant distinction from repainting indicators that might provide a signal and then alter it, potentially leading to deposit losses. Now, you can enter the market with higher probability and precision. There's also a function to colour candles after an arrow appears until the target (take profit) is reached or a reversal signal appears . Display of STOP LOSS
Weis Wave with Alert
Trade The Volume Waves Single Member P.C.
4.79 (19)
Rental/Lifetime Package Options and Privileges' * For optimum results the yearly or lifetime package is suggested due to live training and Discord  channel trading with the  creator! Rent Monthly Six Months   Yearly/Lifetime Weis Wave with Speed with Alert+Speed Index x x x Manual  x x x Quick Set up Video x x x Blog x x x Lifetime Updates x x x Setup and Training Material x x Free Rectangle Break Alert Tool      x Discord Access Channel "The SI traders" x 2-hour live methodology traini
System Trend Pro - This is the best trend trading indicator!!! The indicator no repaint!!!   The indicator has   MTF   mode, which adds confidence to trading on the trend (   no repaint   ). How to trade? Everything is very simple, we wait for the first signal (big arrow), then wait for the second signal (small arrow) and enter the market in the direction of the arrow. (See screens 1 and 2.) Exit on the opposite signal or take 20-30 pips, close half of it, and keep the rest until the oppo
A. ¿Qué es A2SR ?   * Es un indicador técnico líder (sin repintado, sin retraso). -- Guía : -- en https://www.mql5.com/en/blogs/post/734748/page4#comment_16532516 -- y https://www.mql5.com/en/users/yohana/blog A2SR tiene una técnica especial para determinar los niveles de Soporte (demanda) y Resistencia (oferta). A diferencia de la forma ordinaria que vimos en la red, A2SR tiene un concepto original para determinar los niveles reales de SR. La técnica original no se tomó de Internet y tampoco
Full Forex Market View Dashboard
Opengates Success International
5 (2)
VISTA COMPLETA DEL MERCADO FOREX Indicador del tablero Este es un indicador personalizado creado para brindar a los comerciantes una visión completa de lo que está sucediendo en el mercado. Utiliza datos en tiempo real para acceder al mercado y mostrar toda la información necesaria para realizar transacciones exitosas. INSTALACIÓN: Antes de adjuntar este indicador a su gráfico de ventana, vaya al panel Market Watch de su MT4 y OCULTE todos los pares de divisas que no necesita ni opere y
Full STO
Roman Smoroda
Indicador STO completo (incluye todas las versiones de tres indicadores STO: Premium, Gold, Silver) - STABLE TRADE OPTION está diseñado para el comercio automático de opciones binarias.  ¡¡¡¡¡LEA CUIDADOSAMENTE!!!!! IMPORTANTE En un terminal cree dos plantillas con diferentes vencimientos, una plantilla para las 18:01, 18:02 con vencimientos de 1 a 15 minutos y una plantilla para las 22:00 con vencimientos de 10 a 20 minutos. Winrate: 71% en los últimos 5 años Gestión del dinero: 0,3% d
Connect Indicator
Sukunthakan Ngernbamrung
Connect Indicator is a tool used for connecting indicators between the MQL market and MT4. The connected indicators are made by our group and can be used for other applications, such as sending messages to the Line application or Telegram application. If you have any questions, please don't hesitate to ask us to receive support. Function and indicator buffer Buffer one is the high price of the previous candle. Buffer two is the high price of the previous candle. Usage To connect indicators to fu
Idea: RSI ( Relative Strength Index) and CCI ( Commodity Channel Index ) are powerfull to solved the market.  This indicator has Smoothed Algorithmic signal of RSI and CCI. So that, it separates the market into buy and sell zones, these areas are marked with arrows, red for downtrend, green for uptrend. This algorithm has the effect of predicting the next trend based on the historical trend, so users need to be cautious when the trend has gone many candles. Please visit screenshots
DESCRIPTION The CHAOS INDICATOR has been developed to be used for the TRADING STRATEGY OF CHAOS, as described in the book. The book is in italian language only and can be obtained only on my website indicated below. DATAS COLLECTED AND SHOWN ON GRAPHS The CHAOS INDICATOR apply easily to any graph and any asset, and it is a TRADING FACILITATOR, as it identify immediately the following items on any graph: - The GP (= RIGHT PRICE) i.e. the price to which the asset should be attracted within 24
Gann Swing Structure
Kirill Borovskii
5 (1)
This indicator is based on the mathematics of the great trader W.D. Ganna. With its help, you can easily find strong levels by analyzing swings to find the optimal entry point. The indicator works on all instruments and all timeframes. The indicator is fully manual and has control buttons. All you need to do is press the NEW button, a segment will appear, which you can place on any movement, swing or even 1 candle that you want to analyze. By placing the segment, press the OK button. A grid (th
Gann Zone Pro
Kirill Borovskii
This indicator identifies and displays zones, as it were areas of strength, where the price will unfold. The indicator can work on any chart, any instrument, at any timeframe. The indicator has two modes. The indicator is equipped with a control panel with buttons for convenience and split into two modes. Manual mode: To work with manual mode, you need to press the NEW button, a segment will appear. This segment is stretched over the movement and the LVL button is pressed. The level is displayed
The indicator is designed to work on any trading platform. The program is based on proprietary algorithms and W.D.Ganna's mathematics, allowing you to calculate target levels of price movement based on three points with the highest degree of certainty. It is a great tool for stock trading. The indicator has three buttons: NEW - call up a triangle for calculation. DEL - delete the selected triangle. DELS - completely remove all constructions. The probability of achieving the goals is more than 80
EZT Trend
Tibor Rituper
4 (1)
El indicador de tendencia EZT le mostrará la tendencia, el retroceso y las oportunidades de entrada. Se encuentran disponibles filtrado opcional y todo tipo de alertas. Se agregan alertas por correo electrónico y notificaciones automáticas. También estamos desarrollando un EA basado en este indicador, que estará disponible pronto. Es un indicador multifuncional que consta de dos histogramas de color y una línea. Es una representación visual de la dirección y la fuerza de una tendencia; tambié
IA Trendx3 PRO
Marco Aurelio Santos Costa
What if God Created a Trade System? No miracles... Just see how mathematics can be effective in the market. We managed to combine technical analysis / price action into indicators, creating the best setup for trading, be it in Forex, Indices, or stocks. It took us 2 years to create something that really works, and now it's time for you to discover it. TrendX3 is a revolution in trend analysis. Based on advanced algorithms and real-time data, it provides valuable insights so that you can make inf
This is a trend Predictor. Honestly I have to give some credit to some few developers I know personally because they helped pulled this off.  The trend indicator uses special optics to direct the flow of price . it detects where the trend is moving into  It uses price action and a few other embedded custom indicator. You can use it in all timeframes and will be available at a much cooler price.  Please test this Indicator before buying to make sure you like what you see. I can't guarantee th
The breakout algorithm is a technique based on price, price features, to shape a breakout strategy. The strategy in this indicator will not be redrawn (none-repaint indicator), it is suitable for short or long term traders In the screenshot is the EURUSD pair, these currency pairs, commodities or stocks, it have similar strength *Non-Repainting (not redrawn) *For Metatrader4 Only *Great For Scalping *Great For Swing Trading *Arrow Entry, Green is Long, Red is Short *Works On Any Timeframe *Work
Si a menudo pierde operaciones porque solo usa un indicador, pruebe esta herramienta comercial. Esta herramienta comercial utiliza más de un indicador. A menudo observo a traders que sólo utilizan el indicador RSI. Muy a menudo el mercado está sobrevendido pero todavía está abajo o el mercado está sobrecomprado pero todavía está arriba. Por este motivo, es necesario utilizar más de un indicador. Presentamos la nueva versión V 3.40 MTF PPAAF: Flecha de acción de precio precisa de múltiples marco
Market Breaker Pro
Allistair Kabelo Mandow
PYTHONFX INCEPTION TRADING SYSTEM THE BROKERS WORST NIGHTMARE... IMPORTANT! After the purchase please send me a private message to receive the installation manual and the setup instructions. We proudly introduce the PYTHONFX ROYAL CIRCLE Inception trading system, your key to financial freedom.   This is the brokers worst nightmare. Seriously! Modern market conditions require modern solutions & if you are still struggling to analyse the charts and struggling to find consistency in the
"Dragon's Tail" is an integrated trading system, not just an indicator. This system analyzes each candle on a minute-by-minute basis, which is particularly effective in high market volatility conditions. The "Dragon's Tail" system identifies key market moments referred to as "bull and bear battles". Based on these "battles", the system gives trade direction recommendations. In the case of an arrow appearing on the chart, this signals the possibility of opening two trades in the indicated directi
PZ Harmonacci Patterns
PZ TRADING SLU
3.43 (7)
Este es posiblemente el indicador de reconocimiento automático de formación de precios más completo que puede encontrar para la plataforma MetaTrader. Detecta 19 patrones diferentes, toma las proyecciones de Fibonacci tan en serio como usted, muestra la zona de reversión potencial (PRZ) y encuentra niveles adecuados de stop-loss y take-profit. [ Guía de instalación | Guía de actualización | Solución de problemas | FAQ | Todos los productos ] Detecta 19 formaciones de precios armónicos difer
Intro to APAMI, PROfessional edition Trace exactly how far prices trend between two price levels with fractional pip precision, while qualifying price movement between the same price levels. Completely automate when trends change direction and volatility, without any lag .  This is possible because the Accurate Price Action Measurement Indicator (APAMI) actually does what no other indicator can:  measure price distance between two points and simultaneously qualify the price action that occurs
Fibonacci Retracements Pro
Savia Forex Software Solutions
Fibonacci Retracements Pro The Fibonacci Retracements Pro is a powerful yet easy to use indicator. It automatically plots all the important Fibonacci retracement and extension levels for you. FRP is dynamic powerful and seamlessly adjusts to whatever timeframe you are analyzing. Fibonacci Retracement Pro is optimized for ALL timeframes and ALL Currency pairs, Indices, Commodities, and Cryptocurrency pairs. Trade with improved confidence and maximize your success rate. Benefits Dynamic and Power
The Stochastic Basket Currency Strenght  brings the Stochastic indicator to a new level.  Expanding the boundaries of TimeFrames and mono-currency analysis, the SBCS take the movements of each currency that composes the cross and confront them in the whole basket of 7 crosses.  The indicator works with any combination of AUD, CAD, CHF, EUR, GBP, JPY, NZD, USD pairs and with full automation takes in account every stochastic value (main line) for the selected Time Frame.  After that, the indicator
Fnix l long position
Monique Ellen Miranda Dos Santos
¿Eres un inversor en busca de oportunidades a largo plazo en el mercado financiero? Te presento el Indicador de Tendencia Personalizado a Largo Plazo. Este indicador está diseñado para traders que desean operar en plazos más largos que los gráficos diarios, semanales y mensuales. Con señales claras y precisas, contarás con la asistencia necesaria para tomar decisiones informadas. Características clave: Estrategia a Largo Plazo: Este indicador es perfecto para inversores comprometidos con el trad
Otros productos de este autor
Pipsurfer EA
Clinton Keenan Obinna Butler
5 (1)
The Pipsurfer EA is a high level trend trading grid system designed to look for higher lows in an uptrend and lower highs in a down trend. It has the capabilities to be used on multiple different forex pairs at the same time and will pick the best entries out of the trading criteria among the pairs to enter trades with.  The Pipsurfer EA Comes with many features to ensure a smooth trading experience. Prebuilt settings package for easy set up for each tier of forex pairs. Each pair falls into a d
Pipsurfer EA Strategy 4
Clinton Keenan Obinna Butler
Indicator for the 4th strategy of the Pipsurfer EA. This indicator will allow the user to visually see the points of entry for strategy 4 of Pipsurfer. In the settings you will be able to adjust the parameters to mix and match to your trading style and find the settings that you want to either trade manually or tune the EA to do. Strategy 4 uses a market structure trend continuation approach to trading and looks for confirmed highs in downtrends and confirmed lows in uptrends to find great trend
FREE
Pipsurfer Tide Meter
Clinton Keenan Obinna Butler
Pipsurfer Tide Meter is a Momentum Indicator that is designed to help trades know which way the "Tide" is turning. This indicator is a great supporting indicator to the pipsurfer main indicator that is listed in MQL5 under "Pipsurfer Indicator"  The Strategy Behind the Tide Meter is that youll see the blue bars and the red bars. Blue bars are for bullish momentum  Red bars are for bearish momentum  Use price action to find a trading zone then wait for the tide meter to change color then you en
FREE
Pipsurfer Dashboard
Clinton Keenan Obinna Butler
Pipsurfer Dashboard is a multi-currency multi-timeframe dashboard designed to alert you to where the action is happening in the forex markets. The software trades a trend based price action and market structure strategy.  Assets Supported: All Forex Metals  Indices Major Crypto Major Input Settings: Timeframe Filters - Choose which timeframe you want the Pipsurfer Dashboard to signal you on. Pair Selection - Choose To Follow All Major Pairs And Crosses or have a custom list of your choice Aler
Pipsurfer Trade Manager
Clinton Keenan Obinna Butler
The Pipsurfer Trade Manager Is A high level software that will automatically analysis each trading asset and calculate its optimal take profit and stop loss levels for Each trade it is managing. Complete with an easy to use management panel that allows you to manage your risk parameters for each individual trade that you place on each pair. You will have access to trailing stops, break even, partial take profits and account risk percentage features as well
This is the entry and settings for Pipsurfer EA Strategy 1 in an Indicator form. This was created to help users see the entries that Pipsurfer would take and for those who wish to manually trade the entries. Entry Strategies Strategy 1 - This strategy is a conservative strategy that incorporates trend market structure and momentum with each entry having to meet a large variety of market conditions. The goal of this entry is to buy at the lowest point of a trend pullback and sell at the highest
Pipsurfer EA Entry 2
Clinton Keenan Obinna Butler
This indicator is Strategy 2 of the Pipsurfer EA so traders can see where the EA would enter trades at and manually trade with the EA A Smart Money trend continuation strategy that's more moderate but this strategy includes candlestick price action and smart money institutional concepts to find trend continuation moves and hopefully to catch the BIG move that the Banks enter at. There are a full clues that large  institutions give before entering and Pipsurfer Strategy 2 is designed to look for
Filtro:
No hay comentarios
Respuesta al comentario
Versión 2.0 2023.06.22
Addition of The Pipsurfer Tide Entry Arrow and Pipsurfer Strategy Optimization Settings