• Información general
  • Comentarios
  • Discusión

AIS Lehmer Moving Average

La media de Lehmer se puede considerar como una función de ventana, cuyos coeficientes de peso dependen de los valores de las variables utilizadas en el cálculo. Este promedio no es lineal porque en su cálculo se utiliza la exponenciación.
Las características del indicador dependen de dos parámetros:
  • iPeriod: período del indicador, el valor válido es mayor o igual a 2;
  • iPower - exponente, que se utiliza al calcular los valores del indicador. El rango válido es -32768 a 32767

Con iPower = 0 obtenemos la media armónica,
con iPower = 1 - media aritmética,
y para iPower = 2, la media contraarmónica.
Con un exponente grande, la media de Lehmer resalta el límite máximo de la serie temporal. Y con exponentes negativos, se enfatizan los mínimos. Debido a esta propiedad, la media de Lehmer se puede utilizar tanto para suavizar la serie temporal como para construir canales.

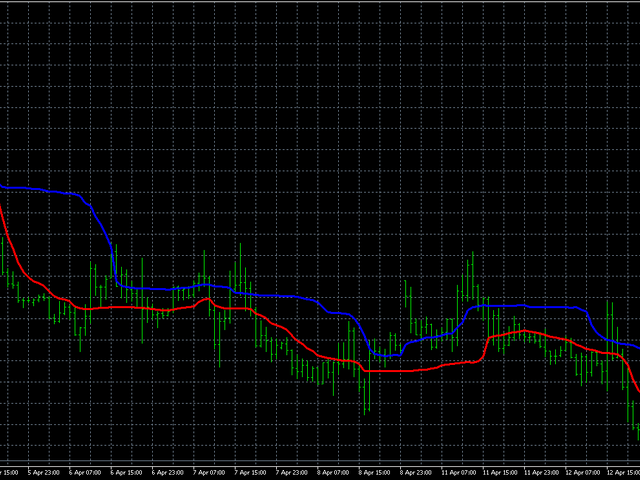
La primera imagen muestra un canal calculado utilizando precios de cierre con exponentes de +500 y -500.
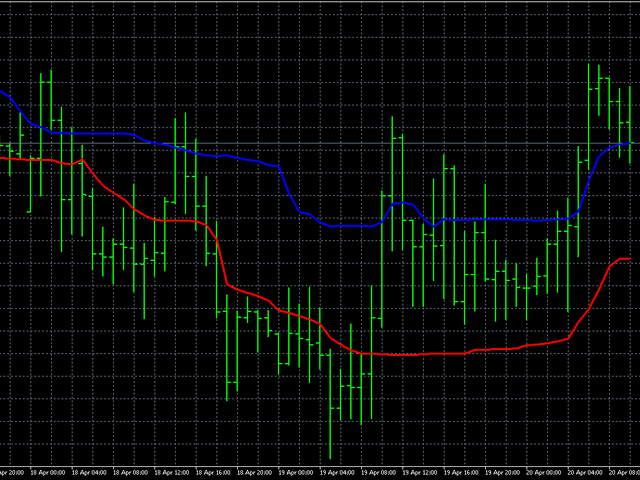
La segunda imagen muestra el mismo canal con iPower = +1000 y -1000.
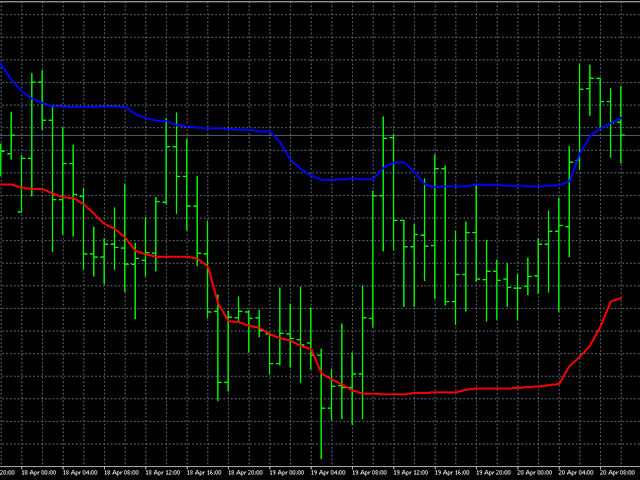
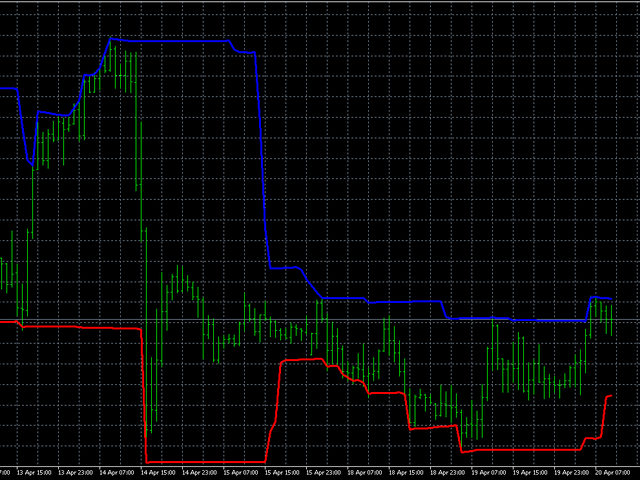
En las cifras tercera y cuarta, la media de Lehmer se aplica a los precios Alto y Bajo en +/- 1000 y +/- 5000.
Productos recomendados
PABT Pattern Indicator - it's classical system one of the signal patterns. Indicator logic - the Hi & Lo of the bar is fully within the range of the preceding bar, look to trade them as pullback in trend. In the way if indicator found PABT pattern it's drawing two lines and arrow what showing trend way.  - First line - it's entry point and drawing at: 1. On the high of signal bar or on middle of the signal bar (depending from indicator mode) for buy; 2. On the low of signal bar or on middle of t
VR Cub
Vladimir Pastushak
VR Cub es un indicador para obtener puntos de entrada de alta calidad. El indicador fue desarrollado para facilitar los cálculos matemáticos y simplificar la búsqueda de puntos de entrada a una posición. La estrategia comercial para la cual se diseñó el indicador ha demostrado su eficacia durante muchos años. La simplicidad de la estrategia comercial es su gran ventaja, que permite que incluso los operadores novatos negocien con éxito con ella. VR Cub calcula los puntos de apertura de posiciones
Infinity Trend Pro
Yaroslav Varankin
1 (1)
This is a trend indicator without redrawing Developed instead of the binary options strategy (by the color of the Martingale candlestick) Also works well in forex trading When to open trades (binary options) A signal will appear in the place with a candle signaling the current candle It is recommended to open a deal for one candle of the current timeframe M1 and M5 When a blue dot appears, open a deal up When a red dot appears, open a trade down. How to open trades on Forex. When a signal is rec
Trendiness Index
Libertas LLC
5 (3)
"The trend is your friend" is one of the best known sayings in investing, because capturing large trendy price movements can be extremely profitable. However, trading with the trend is often easier said than done, because many indicators are based on price reversals not trends. These aren't very effective at identifying trendy periods, or predicting whether trends will continue. We developed the Trendiness Index to help address this problem by indicating the strength and direction of price trend
Owl smart levels
Sergey Ermolov
4.63 (54)
Versión MT5  |   FAQ El   Indicador Owl Smart Levels   es un sistema comercial completo dentro de un indicador que incluye herramientas de análisis de mercado tan populares como   los fractales avanzados de Bill Williams , Valable ZigZag que construye   la estructura de onda correcta   del mercado y   los niveles de Fibonacci   que marcan los niveles exactos de entrada. en el mercado y lugares para tomar ganancias. Descripción detallada de la estrategia Instrucciones para trabajar con el indi
COG LR Osc AM
Andriy Matviyevs'kyy
The presented indicator allows you to determine potential entry points into the market and set protective orders at reasonable levels. This product can be useful for both beginners and experienced traders. The indicator is based on calculation methods proven by time and practicing traders. The indicator is calculated in two stages: At the first stage, linear regression (LR) of the selected price type is determined for a given number of chart periods. At the second stage, the obtained data is p
Insider Scalper Binary This tool is designed to trade binary options. for short temporary spends. to make a deal is worth the moment of receiving the signal and only 1 candle if it is m1 then only for a minute and so in accordance with the timeframe. for better results, you need to select well-volatile charts.... recommended currency pairs eur | usd, usd | jpy .... the indicator is already configured, you just have to add it to the chart and trade .... The indicator signals the next can
Line Magnit
Aleksey Trenin
The LineMagnit Indicator for MT4 is a highly precise tool that builds support and resistance levels which magnetically attract prices. This feature allows traders to easily determine the most probable entry and exit points in the market, as well as identify the market's directional forces, as levels are based on capital inflows into the instrument. Equipped with an intuitively understandable graphical interface, the LineMagnit Indicator enables users to quickly locate and analyze support and res
Este innovador indicador de medición de la fuerza de la moneda de INFINITY es un ayudante indispensable para los revendedores y comerciantes que negocian en el largo plazo. El sistema de Análisis de fortaleza / debilidad de las monedas ha sido conocido y utilizado en el mercado por los principales operadores del mundo. Cualquier comercio de arbitraje no está completo sin este análisis. Nuestro indicador determina fácilmente la fuerza de las monedas subyacentes entre sí. Muestra gráficos de líne
Trade with Gann on your side!! MASTER CIRCLE 360 CIRCLE CHART, originally created by Gann admitted that this is “The Mother of all charts”. It is one of the last studies that this great trader left for us. The numeric tab le is apparently quite simple like all the tables and is based on square numbers, the SQUARE OF 12 and is by evolution, one of the most important square numbers. Here we can find CYCLE, PRICE AND TIME thanks to angles and grades, to show past and future support and resistance.
Binary Options Support Resistance Indicator This indicator is designed for binary options trading and effectively shows retracements from support and resistance levels. Signals appear on the current candle. A red arrow pointing downwards indicates a potential selling opportunity, while a blue arrow pointing upwards suggests buying opportunities. All that needs adjustment is the color of the signal arrows. It is recommended to use it on the M1-M5 timeframes as signals are frequent on these timef
Super Gator
Agustinus Biotamalo Lumbantoruan
This indi shows the following 1. Supertrend 2. Alligator (Not a regular alligator) 3. ZigZag 4. Moving Average 5. Trend Continuation/Mini correction Signal (plotted in X) (See screenshots in green background color 6. Early Signal Detection (See screenshots in green background color) You may treat Alligator as the lagging indicator The leading indicator is the supertrend. The zig zag is based on the leading indicator where it gets plotted when the leading indicator got broken to the opposite.
The indicator detects and displays 3 Drives harmonic pattern (see the screenshot). The pattern is plotted by the extreme values of the ZigZag indicator (included in the resources, no need to install). After detecting the pattern, the indicator notifies of that by a pop-up window, a mobile notification and an email. The indicator highlights the process of the pattern formation and not just the complete pattern. In the former case, it is displayed in the contour triangles. After the pattern is com
The CCI Divergence is a reasonably useful indicator in itself, but it is even more effective when used with divergence pattern trading. The CCI Divergence indicator signal is one of the most potent signals among the indicators that exist in the market. Here is new version for Divergence Indicator using CCI method, with more improvements. Divergences indicate a potential investment point because the directional moment does not confirm the price. A bullish divergence occurs when the underlying
Fractal Zig Zag
Mikhail Nazarenko
5 (1)
A   professional version of the ZigZag indicator for visualizing the structure of price movements by fractals. Fractal ZigZag fixes the flaws of the standard version of the ZigZag indicator MT4. It uses Price action and a unique filtering algorithm to determine fractals. Suitable for all types of trading. Ideal for trading according to the WM pattern "Sniper" strategy !!! Features Marks the place of price reversal during the formation of a new fractal with specified parameters. Suitable for
Heiken Ashi Smoothed Strategy is a very simple but powerful system to get forex market trend direction. This indicator is actually 2 indicators in 1 pack, Heiken Ashi and Heiken Ashi Smoothed Moving Average both included. Because HA (Heiken Ashi) and HAS (Heiken Ashi Smoothed) are calculated in the same one system event with necessary buffers and loop only, so it is the FAST, OPTIMIZED and EFFICIENT HA having the combined indicator of MetaTrader 4. You can choose to display HA and HAS in the sam
Renko, Heiken Ashi, Ticks Bar, Range Bar.    Easy switching, easy setup, all in one window.        Place the Custom Chart indicator and view Renko, Heiken Ashi, Tick bar, Range bar charts in real time at real chart.    Position the offline chart window so that the indicator control panel is visible.    Switch the chart mode by click of a button.    Connect to the output chart any indicator, expert advisor without any restrictions.    No, it doesn't work in the tester.    Yes, you can use an
Automated Trendlines
Georgios Kalomoiropoulos
5 (16)
Las líneas de tendencia son la herramienta más esencial del análisis técnico en el comercio de divisas. Desafortunadamente, la mayoría de los comerciantes no los dibujan correctamente. El indicador de líneas de tendencia automatizadas es una herramienta profesional para comerciantes serios que lo ayuda a visualizar el movimiento de tendencia de los mercados. Hay dos tipos de Trendlines Bullish Trendlines y Bearish Trendlines. En la tendencia alcista, la línea de tendencia de Forex se dib
Power Renko is an indicator which plots Renko bricks underneath the chart using a histogram. You can select the brick size and the timeframe of the Renko bricks as well as whether or not to use the close price or the high/low price of the candles. Renko bricks are based on price alone, not time, therefor the Renko bricks will not be aligned with the chart's time. They are extremely useful for trend trading and many different strategies can be formed from them. Buffers are provided allowing you t
Chart Patterns Detect 15 patterns (Ascending Triangle, Descending Triangle, Rising Wedge, Falling Wedge, Bullish Flag, Bearish Flag, Bullish Rectangle, Bearish Rectangle Symmetrical triangle, Head and Shoulders, Inverted Head and Shoulders, Triple top, Triple Bottom, Double Top, Double Bottom) Use historical data to calculate the probability of each pattern to succeed (possibility to filter notification according to the chance of success) gives graphic indication about the invalidation level and
The Th3Eng PipFinite indicator is based on a very excellent analysis of the right trend direction with perfect custom algorithms. It show the true direction and the best point to start trading. With StopLoss point and Three Take Profit points. Also it show the right pivot of the price and small points to order to replace the dynamic support and resistance channel, Which surrounds the price. And Finally it draws a very helpful Box on the left side on the chart includes (take profits and Stop loss
Indicator without redrawing Divergent MAX The DivirgentMAX indicator is a modification based on the MACD. The tool detects divergence based on OsMA and sends signals to buy or sell (buy|sell), taking into account the type of discrepancies detected. Important!!!! In the DivirgentMAX indicator, the optimal entry points are drawn using arrows in the indicator's basement. Divergence is also displayed graphically. In this modification of the MACD, the lag problem characteristic of its predecessor
Introduction It is common practice for professional trades to hide their stop loss / take profit from their brokers. Either from keeping their strategy to the themselves or from the fear that their broker works against them. Using this indicator, the stop loss / take profit points will be drawn on the product chart using the bid price. So, you can see exactly when the price is hit and close it manually.  Usage Once attached to the chart, the indicator scans the open orders to attach lines fo
Добрый День уважаемые трейдеры!  Вашему вниманию индикатор созданный и работающий на базе трендовика ADX,  для торговли на смене направления движения который учитывает коррекцию и даёт возможность на ней заработать.  Применяю этот индикатор для скальпинга. Рекомендую таймфреймы от 15 ти минутного(М15) до часового (Н1) периодов.  Красный кружок сигнал на продажу- Sell) Зелёный кружок  сигнал на покупку Buy) Чем меньше ваш таймфрейм тем меньше пунктов вы зарабатываете.   Важно выставлять стопы! !В
Distinctive
Tatiana Savkevych
Distinctive is a forex trending arrow indicator for identifying potential entry points. I like it, first of all, because it has a simple mechanism of work, adaptation to all time periods and trading tactics. Created on the basis of a regression channel with filters. Plotting the Lawrence indicator signals on a price function chart using a mathematical approach. How it works - when the price breaks out in the overbought / oversold zone (channel levels), a buy or sell signal is generated. Every
Wave Wolf MT4
Andrei Salanevich
El indicador Forex Wave Wold MT4 está diseñado para buscar ondas de Wolfe y mostrarlas en la ventana actual del terminal comercial. Excelente indicador para los comerciantes que utilizan en el comercio de la onda de Wolfe. Su uso en estrategias comerciales aumentará significativamente su eficiencia y rentabilidad. INFORMACIÓN DEL INDICADOR A diferencia de otros indicadores de ondas Wolfe, el indicador Forex Wave Wold MT4 tiene una serie de características que aumentan significativamente su ef
Alpha Trend
Evgeny Belyaev
3.33 (3)
Alpha Trend is a trend indicator for the MetaTrader 4 platform; it has been developed by a group of professional traders. The Alpha Trend indicator finds the most probable tendency reversal points, which allows making trades at the very beginning of a trend. This indicator features notifications, which are generated whenever a new signal appears (alert, email, push-notification). This allows you to open a position in a timely manner. Alpha Trend does not redraw, which makes it possible to evalua
Market Structure Patterns MT4
Samuel Manoel De Souza
5 (16)
Market Structure Patterns   is an indicator based on   smart money concepts   that displays almost all of the   SMC/ICT   elements needed to take your trading decisions to the next level. Take advantage of the   alerts ,   push notifications   and   email messages   to keep informed from when an element is formed on the chart, the price crosses a level and/or enters in a box/zone. Developers can access the values of the elements of the indicator using the   global variables  what allows the aut
The indicator displays the data of the Stochastic oscillator from a higher timeframe on the chart. The main and signal lines are displayed in a separate window. The stepped response is not smoothed. The indicator is useful for practicing "manual" forex trading strategies, which use the data from several screens with different timeframes of a single symbol. The indicator uses the settings that are identical to the standard ones, and a drop-down list for selecting the timeframe. Indicator Parame
Trend PA
Mikhail Nazarenko
5 (3)
The Trend PA indicator uses   Price Action   and its own filtering algorithm to determine the trend. This approach helps to accurately determine entry points and the current trend on any timeframe. The indicator uses its own algorithm for analyzing price changes and Price Action. Which gives you the advantage of recognizing, without delay, a new nascent trend with fewer false positives. Trend filtering conditions can be selected in the settings individually for your trading style. The indicator
Los compradores de este producto también adquieren
Atomic Analyst
Issam Kassas
5 (2)
En primer lugar, vale la pena enfatizar que este Indicador de Trading no repinta, no redibuja y no se retrasa, lo que lo hace ideal tanto para el trading manual como para el automatizado. El Analista Atómico es un Indicador de Acción del Precio PA que utiliza la fuerza y el impulso del precio para encontrar una mejor ventaja en el mercado. Equipado con filtros avanzados que ayudan a eliminar ruidos y señales falsas, y aumentan el potencial de trading. Utilizando múltiples capas de indicadores
TPSproTREND PrO
Roman Podpora
5 (15)
TPSpro TRENDPRO  - is a trend indicator that automatically analyzes the market and provides information about the trend and each of its changes, as well as giving signals for entering trades without redrawing! The indicator uses each candle, analyzing them separately. referring to different impulses - up or down impulse. Exact entry points into transactions for currencies, crypto, metals, stocks, indices!  -  Version MT5               DETAILED DESCRIPTION        /       TRADING SETUPS           
ACTUALMENTE 26% DE DESCUENTO ¡La mejor solución para cualquier operador novato o experto! Este indicador es una herramienta única, de alta calidad y asequible porque hemos incorporado una serie de características propias y una nueva fórmula. ¡Con sólo UN gráfico puede leer la Fuerza de la Divisa para 28 pares de Divisas! Imagínese cómo mejorará su operativa porque podrá señalar el punto exacto de activación de una nueva tendencia o de una oportunidad de scalping. Manual del usuario: haga
¡Actualmente 20% OFF ! ¡La mejor solución para cualquier novato o trader experto! Este software funciona con 28 pares de divisas. Se basa en 2 de nuestros principales indicadores (Advanced Currency Strength 28 y Advanced Currency Impulse). Proporciona una gran visión general de todo el mercado de divisas. Muestra los valores de Advanced Currency Strength, la velocidad de movimiento de las divisas y las señales para 28 pares de divisas en todos los (9) marcos temporales. Imagine cómo mejorar
Scalper Inside PRO
Alexey Minkov
4.75 (55)
SALE NOW! Limited Time Offer! An exclusive indicator that utilizes an innovative algorithm to swiftly and accurately determine the market trend. The indicator automatically calculates opening, closing, and profit levels, providing detailed trading statistics. With these features, you can choose the most appropriate trading instrument for the current market conditions. Additionally, you can easily integrate your own arrow indicators into Scalper Inside Pro to quickly evaluate their statistics and
Introduciendo       Indicador Quantum Trend Sniper   , el innovador indicador MQL5 que está transformando la forma en que identificas y negocias los cambios de tendencia. Desarrollado por un equipo de comerciantes experimentados con experiencia comercial de más de 13 años,       Indicador de francotirador de tendencia cuántica       está diseñado para impulsar su viaje comercial a nuevas alturas con su forma innovadora de identificar cambios de tendencia con una precisión extremadamente alta.
TPSpro RFI Levels
Roman Podpora
5 (13)
A key element in trading is zones or levels from which decisions to buy or sell a trading instrument are made. Despite attempts by major players to conceal their presence in the market, they inevitably leave traces. Our task was to learn how to identify these traces and interpret them correctly. Reversal First Impulse levels (RFI)   -  Version MT5                INSTRUCTIONS                 RUS                 ENG                                       R ecommended to use with an indicator   -  
Quantum Breakout Indicator PRO
Bogdan Ion Puscasu
4.96 (26)
Introduciendo       Quantum Breakout PRO   , el innovador indicador MQL5 que está transformando la forma en que comercia con Breakout Zones. Desarrollado por un equipo de operadores experimentados con experiencia comercial de más de 13 años,   Quantum Breakout PRO   está diseñado para impulsar su viaje comercial a nuevas alturas con su innovadora y dinámica estrategia de zona de ruptura. El indicador de ruptura cuántica le dará flechas de señal en las zonas de ruptura con 5 zonas objetivo de
FX Volume
Daniel Stein
4.6 (35)
Obtenga su actualización diaria del mercado con detalles y capturas de pantalla a través de nuestro Morning Briefing aquí en mql5 y en Telegram ! FX Volume es el PRIMER y ÚNICO indicador de volumen que proporciona una visión REAL del sentimiento del mercado desde el punto de vista de un bróker. Proporciona una visión impresionante de cómo los participantes institucionales del mercado, como los brokers, están posicionados en el mercado Forex, mucho más rápido que los informes COT. Ver esta info
FX Power MT4 NG
Daniel Stein
5 (8)
Obtenga su actualización diaria del mercado con detalles y capturas de pantalla a través de nuestro Morning Briefing aquí en mql5 y en Telegram ! FX Power MT4 NG es la nueva generación de nuestro popular medidor de fuerza de divisas, FX Power. ¿Y qué ofrece este medidor de fuerza de nueva generación? Todo lo que le encantaba del FX Power original PLUS Análisis de fuerza de ORO/XAU Resultados de cálculo aún más precisos Períodos de análisis configurables individualmente Límite de cálculo persona
Presentamos el Indicador Milagroso de Forex: Desata el Poder del Trading Preciso ¿Estás cansado de buscar el mejor indicador de Forex que realmente ofrezca resultados excepcionales en todos los marcos temporales? ¡No busques más! Ha llegado el Indicador Milagroso de Forex para revolucionar tu experiencia de trading y llevar tus ganancias a nuevas alturas. Construido sobre una base de tecnología de vanguardia y años de desarrollo meticuloso, el Indicador Milagroso de Forex se erige como el pinácu
Advanced Supply Demand
Bernhard Schweigert
4.92 (310)
¡Actualmente con 33% de descuento! ¡La mejor solución para cualquier tráder principiante o experto! Este indicador es una herramienta comercial única, de alta calidad y asequible, porque incorpora una serie de características patentadas y una nueva fórmula. Con esta actualización, podrá mostrar zonas de doble marco temporal. No solo podrá mostrar un marco temporal más alto, sino también mostrar ambos, el marco temporal del gráfico MÁS el marco temporal más alto: MOSTRANDO ZONAS ANIDADAS. A todos
TrendMaestro
Stefano Frisetti
5 (2)
note: this indicator is for METATRADER4, if you want the version for METATRADER5 this is the link: TRENDMAESTRO recognizes a new TREND in the bud, he never makes mistakes. The certainty of identifying a new TREND is priceless. DESCRIPTION TRENDMAESTRO identifies a new TREND in the bud, this indicator examines the volatility, volumes and momentum to identify the moment in which there is an explosion of one or more of these data and therefore the moment in which prices have strong probability of f
Price Action Entry Alerts
Stephen Sanjeeve Sahayam
5 (3)
Este indicador analiza cada barra en busca de presión de compra o venta e identifica 4 tipos de patrones de velas con el volumen más alto. Estas velas luego se filtran utilizando varios filtros lineales para mostrar señales de compra o venta. Las señales funcionan mejor, junto con una dirección de marco de tiempo más alta y cuando se negocian durante horas de alto volumen. Todos los filtros son personalizables y funcionan de forma independiente. Puede ver señales de una sola dirección con el cli
Entry Points Pro
Yury Orlov
4.7 (225)
Este es un genial indicador para MT4 que ofrece señales precisas para entrar en una transacción sin redibujar. Se puede aplicar a cualquier activo financiero: fórex, criptomonedas, metales, acciones, índices. Nos dará valoraciones bastante precisas y nos dirá cuándo es mejor abrir y cerra una transacción. Eche un vistazo  al vídeo  (6:22), ¡contiene un ejemplo de procesamiento de una sola señal que ha amortizado el indicador! La mayoría de los tráders mejoran sus resultados comerciales durante l
How to use Pair Trading Station Pair Trading Station is recommended for H1 time frame and you can use it for any currency pairs. To generate buy and sell signal, follow few steps below to apply Pair Trading Station to your MetaTrader terminal. When you load Pair Trading Station on your chart, Pair Trading station will assess available historical data in your MetaTrader platforms for each currency pair. On your chart, the amount of historical data available will be displayed for each currency pai
Antes que nada, vale la pena enfatizar que este Sistema de Trading es un Indicador No Repintado, No Redibujado y sin Retardos, lo que lo hace ideal para el trading profesional. El "Sistema de Trading de Soporte y Resistencia Inteligente" es un indicador avanzado diseñado para traders nuevos y experimentados. Empodera a los traders con precisión y confianza en el mercado de divisas. Este sistema integral combina más de 7 estrategias, 10 indicadores y varios enfoques de trading, incluyendo estr
PTS Precision Index Oscillator V2
PrecisionTradingSystems
5 (1)
El Oscilador de Índice de Precisión (Pi-Osc) de Roger Medcalf de Precision Trading Systems La versión 2 ha sido cuidadosamente recodificada para cargar rápidamente en su gráfico y se han incorporado algunas otras mejoras técnicas para mejorar la experiencia. El Pi-Osc fue creado para proporcionar señales precisas de temporización de operaciones diseñadas para encontrar puntos de agotamiento extremos, los puntos a los que los mercados se ven obligados a llegar solo para eliminar las órdenes
GOLD Impulse with Alert
Bernhard Schweigert
4.56 (9)
Este indicador es una super combinación de nuestros 2 productos Advanced Currency IMPULSE with ALERT  +   Currency Strength Exotics . ¡Funciona para todos los marcos de tiempo y muestra gráficamente el impulso de fuerza o debilidad para las 8 divisas principales más un Símbolo! Este Indicador está especializado en mostrar la aceleración de la fuerza de la divisa para cualquier símbolo como Oro, Pares Exóticos, Materias Primas, Índices o Futuros. Es el primero de su clase, cualquier símbol
PTS - Buscador de Compras por Divergencia de Precision Trading Systems El Buscador de Divergencias de Precisión fue diseñado para encontrar los mínimos del mercado con una precisión milimétrica y lo hace con frecuencia. En el análisis técnico, la habilidad de identificar mínimos generalmente es mucho más fácil que identificar máximos, y este elemento está diseñado precisamente para esa tarea. Después de identificar una divergencia alcista, es prudente esperar a que la tendencia se vuelva al
El Indicador de Venta PTS Divergence Finder de Roger Medcalf - Precision Trading Systems. Este indicador solo proporciona indicaciones bajistas - de venta. En primer lugar, muchas veces me han preguntado por qué no proporcioné un indicador de divergencia de venta mientras proporcionaba felizmente un buscador de divergencias de señal de compra durante muchos años. Di la respuesta de que las divergencias de venta son menos confiables que las divergencias de compra, lo cual sigue siendo cierto. Se
TPA True Price Action indicator reveals the true price action of the market makers through 100% non-repainting signals (except early signals mode) strictly at the close of a candle! TPA shows entries and re-entries, every time the bulls are definitely stronger than the bears and vice versa. Not to confuse with red/green candles. The shift of power gets confirmed at the earliest stage and is ONE exit strategy of several. There are available now two free parts of the TPA User Guide for our custo
Cycle Sniper
Elmira Memish
4.4 (35)
NEW YEAR SALE PRICE FOR LIMITED TIME!!! Please contact us after your purchase and we will send you the complimentary indicators to complete the system Cycle Sniper is not a holy grail but when you use it in a system which is explained in the videos, you will feel the difference. If you are not willing to focus on the charts designed with Cycle Sniper and other free tools we provide, we recommend not buying this indicator. We recommend watching the videos about the indiactor and system before pu
Up down v6T
Guner Koca
5 (1)
Thise indicator is up down v6  comes with tradingwiev version. purchased people, after installed on terminal ,contact me on mql5  to get BONUS  TradingView version. up-down indicator is no repaint and works all pairs and lower than weekly time frames charts. it is suitable also 1 m charts for all pairs. and hold long way to signal. dont gives too many signals. when red histogram cross trigger line that is up signal.and price probably will down when blue histogram cross trigger line that is dow
Indicator : RealValueIndicator Description : RealValueIndicator is a powerful tool designed specifically for trading on the EURUSD pair. This indicator analyzes all EUR and USD pairs, calculates their real currency strength values, and displays them as a single realistic value to give you a head start on price. This indicator will tell you moves before they happen if you use it right. RealValueIndicator allows you to get a quick and accurate overview of the EURUSD currency pair tops and bottoms,
Blahtech Market Profile
Blahtech Limited
4.61 (18)
Was: $249  Now: $99   Market Profile defines a number of day types that can help the trader to determine market behaviour. A key feature is the Value Area, representing the range of price action where 70% of trading took place. Understanding the Value Area can give traders valuable insight into market direction and establish the higher odds trade. It is an excellent addition to any system you may be using. Blahtech Limited presents their Market Profile indicator for the MetaTrader community. Ins
Reversal Sniper
Elmira Memish
5 (3)
Reversal Sniper is designed to find the extreme reversals of the price. Indicator collects data of Cycle Sniper Indicator. NOTE: REVERSAL SNIPER Indicator is made for Cycle Sniper Users as an additional tool.  However, it can be used by the traders who look for finding out strong reversal levels. Indicator works on all timeframes and all instruments. Reversal  Sniper  Checks: Harmonic Patterns RSI Zig Zag and Harmonic Swings Cycle Sniper Indicator's Buy / Sell Signals The complex algo i
XQ Indicator MetaTrader 4
Marzena Maria Szmit
3 (2)
Step into the realm of Forex trading with confidence and precision using XQ, a cutting-edge Forex indicator designed to elevate your trading game to unprecedented heights. Whether you're a seasoned trader or just stepping into the world of currency exchange,   XQ Forex Indicator   empowers you with the insights and signals needed to make informed trading decisions. The signal conditions are a combination of three indicators, and XQ Forex Indicator only display  medium and long-term trends . The
XPointer
Andrey Kozak
5 (3)
XPointer is a completely ready trading system. It shows the trader when to open and close a trade. It works on all currency pairs and all time frames. Very easy to use and does not require additional indicators for its operation. Even a beginner trader can start working with XPointer. But it will also be useful for professional traders to confirm the opening of orders. Features of the XPointer indicator It does not redraw its values. It works on all currency pairs and all time frames. It has a
Quantum Heiken Ashi PRO MT4
Bogdan Ion Puscasu
4.43 (7)
Introduciendo el       Gráficos   Quantum Heiken Ashi PRO Diseñadas para brindar información clara sobre las tendencias del mercado, las velas Heiken Ashi son reconocidas por su capacidad para filtrar el ruido y eliminar las señales falsas. Diga adiós a las confusas fluctuaciones de precios y dé la bienvenida a una representación gráfica más fluida y confiable. Lo que hace que Quantum Heiken Ashi PRO sea realmente único es su fórmula innovadora, que transforma los datos de velas tradicionales en
Otros productos de este autor
This script allows selecting the TakeProfit and StopLoss levels. It analyzes the history data, and then calculates the probability of reaching a given price level. How the script works Suppose you have a trading strategy and you want to select the TakeProfit and StopLoss levels. Run the script and set the parameter: Number of Bars - the average position holding time in bars. Once the script operation is complete, the AIS-PPL.csv file will be created in the Files folder in the terminal data cat
FREE
AIS Money Management MT5
Aleksej Poljakov
5 (1)
El script se basa en la simulación de transacciones comerciales utilizando un generador de números aleatorios. Esto le permite obtener resultados completamente diferentes, incluso con los mismos parámetros de entrada. Cuando ejecuta el script, se abre un cuadro de diálogo en el que puede establecer los valores deseados para las variables externas. En el bloque,   TradingOptions   define los parámetros básicos que se necesitan para simular el comercio. StartBalance : establece el tamaño inicial
FREE
MinDeposit MT5
Aleksej Poljakov
3 (1)
The script analyzes the history of quotes and gives recommendations on the minimum deposit. The calculations take into account the variability of prices and the standard deviation. Margin requirements for the instrument are also taken into account. The result of the script is the minimum recommended deposit for trading the given currency pair.
FREE
The script allows selecting the required 'Filter level' value of the AIS-MTF MT5 indicator. Run the script on the required chart and selected timeframe. Once its operation is complete, the HPS.csv file will be created in the Files folder. Open the file. You will see three columns. The 'Filter lvl' column represents the value of the 'Filter level' for the AIS-MTF indicator. Am. dev. - degree and direction of the indicator's deviation from the price level (sorted in ascending order). Negative valu
FREE
El script se basa en la simulación de transacciones comerciales utilizando un generador de números aleatorios. Esto le permite obtener resultados completamente diferentes, incluso con los mismos parámetros de entrada. Cuando ejecuta el script, se abre un cuadro de diálogo en el que puede establecer los valores deseados para las variables externas. En el bloque, TradingOptions define los parámetros básicos que se necesitan para simular el comercio. StartBalance : establece el tamaño inicial de l
FREE
La elección de los niveles de StopLoss y TakeProfit puede tener un impacto muy fuerte en el rendimiento general de las operaciones. Además de los parámetros obvios de una transacción comercial (el tamaño de una posible ganancia o pérdida probable), los niveles de StopLoss y TakeProfit también afectan la duración esperada de la transacción y la rentabilidad de la negociación en general. Si ya ha determinado la duración óptima de la transacción utilizando el script " AIS-ODT ", entonces puede come
FREE
Este script está diseñado para que el comerciante pueda determinar la duración promedio de las transacciones comerciales, en la cual la relación de posibles ganancias y pérdidas será óptima. Primero, veamos el enfoque general para determinar la duración óptima de las transacciones comerciales. Introducimos las siguientes variables: R   - el resultado de la transacción; T   - el tiempo durante el cual la transacción estuvo abierta; W : el tiempo entre el cierre de la transacción anterior y la ape
FREE
MinDeposit
Aleksej Poljakov
5 (1)
The script analyzes the history of quotes and gives recommendations on the minimum deposit. The calculations take into account the variability of prices and the standard deviation. Margin requirements for the instrument are also taken into account. The result of the script is the minimum recommended deposit for trading the given currency pair.
FREE
La elección de los niveles de StopLoss y TakeProfit puede tener un impacto muy fuerte en el rendimiento general de las operaciones. Además de los parámetros obvios de una transacción comercial (el tamaño de una posible ganancia o pérdida probable), los niveles de StopLoss y TakeProfit también afectan la duración esperada de la transacción y la rentabilidad de la negociación en general. Si ya ha determinado la duración óptima de la transacción utilizando el script " AIS-ODT ", entonces puede come
FREE
Este script está diseñado para que el comerciante pueda determinar la duración promedio de las transacciones comerciales, en la cual la relación de posibles ganancias y pérdidas será óptima. Primero, veamos el enfoque general para determinar la duración óptima de las transacciones comerciales. Introducimos las siguientes variables: R - el resultado de la transacción; T - el tiempo durante el cual la transacción estuvo abierta; W : el tiempo entre el cierre de la transacción anterior y la apertur
FREE
The script allows selecting the required 'Filter level' value of the AIS-MTF indicator. Run the script on the required chart and selected timeframe. Once its operation is complete, the HPS.csv file will be created in the Files folder. Open the file. You will see three columns. The 'Filter lvl' column represents the value of the 'Filter level' for the AIS-MTF indicator. Am. dev. - degree and direction of the indicator's deviation from the price level (sorted in ascending order). Negative values i
FREE
This script allows selecting the TakeProfit and StopLoss levels. It analyzes the history data, and then calculates the probability of reaching a given price level. How the script works Suppose you have a trading strategy and you want to select the TakeProfit and StopLoss levels. Run the script and set the parameter: Number of Bars - the average position holding time in bars. Once the script operation is complete, the AIS-PPL.csv file will be created in the Files folder in the terminal data cat
FREE
El indicador de promedios correctos de AIS le permite establecer el comienzo de un movimiento de tendencia en el mercado. Otra cualidad importante del indicador es una clara señal del final de la tendencia. El indicador no se redibuja ni se recalcula. Valores mostrados h_AE - límite superior del canal AE l_AE - límite inferior del canal AE h_EC - Valor predicho alto para la barra actual l_EC - Valor predicho bajo para la barra actual Señales al trabajar con el indicador. La señal prin
El indicador de promedio móvil ponderado AIS calcula un promedio móvil ponderado y le permite determinar el comienzo de un movimiento de tendencia del mercado. Los coeficientes de peso se calculan teniendo en cuenta las características específicas de cada barra. Esto le permite filtrar los movimientos aleatorios del mercado. La señal principal que confirma el comienzo de una tendencia es un cambio en la dirección de las líneas del indicador y el precio que cruza las líneas del indicador.
El indicador de factibilidad de grado avanzado de AIS está diseñado para predecir los niveles que el precio puede alcanzar en el futuro. Su trabajo es analizar las últimas tres barras y construir un pronóstico basado en eso. El indicador se puede utilizar en cualquier período de tiempo y cualquier par de divisas. Con la ayuda de la configuración, puede lograr la calidad deseada del pronóstico. Profundidad de pronóstico: establece la profundidad de pronóstico deseada en barras. Se recomienda s
The indicator is designed to measure the price volatility. This allows determining the moments for opening or closing trade positions more accurately. High intensity of the market indicates the instability of its movement, but allows for better results. And, conversely, low intensity of the market indicates the stability of its movement. Parameters Bars to process - the number of bars to measure the price movements. A low value of this parameter allows determining the moments of rapid price mo
This indicator uses the Fibonacci p-numbers to smooth a price series. This allows combining the advantages of the simple and exponential moving averages. The smoothing coefficients depend on the level of the p-number, which is set in the indicator parameters. The higher the level, the greater the influence of the simple moving average and the less significant the exponential moving average. Parameters Fibonacci Numbers Order - order of the Fibonacci p-number, specified by trader. Valid values
The indicator is based on the analysis of interaction of two filters. The first filter is the popular Moving Average. It helps to identify linear price movements and to smooth minor price fluctuations. The second filter is the Sliding Median. It is a non-linear filter. It allows to filter out noise and single spikes in the price movement. A predictive filter implemented in this indicator is based on the difference between these filters. The indicator is trained during operation and is therefore
This indicator studies the price action as a combination of micro-trends. All micro-trends are analyzed and averaged. Price movement is filtered based on this averaging. IP_High and IP_Low (blue and red dashed lines) show the instantaneous price movement. They display the forecast only for the current price values, taking into account only the number of bars defined by the 'Filter level' parameter. SP_High and SP_Low (blue and red solid lines) smooth the price movements with respect to history.
Este indicador implementa un proceso de suavizado lineal simple. Una de las desventajas del suavizado exponencial es el rápido decaimiento de la señal. Esto hace que sea imposible realizar un seguimiento completo de las tendencias a largo plazo en el rango de precios. El suavizado lineal le permite ajustar con mayor precisión y precisión el filtrado de la señal. El indicador se configura seleccionando parámetros: LP: este parámetro le permite seleccionar el período de suavizado. Cuanto ma
Este indicador es un filtro híbrido secuencial basado en una combinación de propiedades medias y medias móviles. El uso de la mediana permite filtrar valores atípicos anormales e impulsos aleatorios en los valores de las series de precios. Al mismo tiempo, el filtro de mediana no actúa sobre la tendencia en el movimiento de precios, dejándolo sin cambios. Como el filtro de la mediana no es lineal, se utiliza el promedio utilizando un promedio móvil simple para suavizar sus valores. Este enfoq
Este indicador es una combinación de dos filtros modificados de Lanczos. El primer filtro sirve para extrapolar el precio. Basado en valores pasados, predice un posible movimiento de precios dentro de la barra actual. Es decir, muestra cuál sería el precio si las tendencias pasadas permanecieran sin cambios. El segundo filtro para suavizar y promediar los precios dentro de la ventana, determinado por el nivel del filtro. Gracias a la selección de ponderaciones, este filtro responde más activamen
Echemos un vistazo a la naturaleza de los cambios de precios en el mercado de divisas, sin prestar atención a las razones por las que se producen estos cambios. Este enfoque nos permitirá identificar los principales factores que afectan el movimiento de precios. Por ejemplo, tomemos los precios de apertura de las barras en el par de divisas EUR-USD y el período H1. Para estos precios, construimos el diagrama de Lameray (Figura 1). En este diagrama, se puede ver que el movimiento del precio se pr
Este indicador es más informativo. Su trabajo se basa en la suposición de que el movimiento de los precios en el mercado puede representarse como el ruido de un color en particular, que depende de los parámetros de la distribución de los valores de los precios. Gracias a esto, es posible analizar el cambio de precio desde diferentes ángulos y, considerando el movimiento del precio como ruido de un color en particular, se puede obtener información sobre el estado actual de las cosas en el mercad
A pesar de algunos inconvenientes del indicador " AIS Color Noise Filter ", la idea de usarlo para suavizar las series de precios y los precios de previsión parece bastante atractiva. Esto se debe a varias razones: En primer lugar, tener en cuenta varios componentes de ruido permite elaborar un pronóstico sobre factores independientes entre sí, lo que puede mejorar la calidad del pronóstico; en segundo lugar, las características de ruido de las series de precios se comportan de manera bastante
Muy a menudo, en el estudio de series financieras se aplica su suavizado. Mediante el suavizado, puede eliminar componentes de alta frecuencia; se cree que están causados ​​por factores aleatorios y, por lo tanto, no son significativos. El suavizado siempre incluye alguna forma de promediar los datos, en la que los cambios aleatorios en las series de tiempo se absorben mutuamente. Muy a menudo, para este propósito, se utilizan métodos de media móvil simple o ponderada, así como el suavizado exp
Para aislar componentes a largo plazo y no aleatorios, es necesario saber no solo cuánto ha cambiado el precio, sino también cómo se produjeron estos cambios. En otras palabras, estamos interesados ​​no solo en los valores de los niveles de precios, sino también en el orden en que estos niveles se reemplazan entre sí. A través de este enfoque, se pueden encontrar factores a largo plazo y estables que influyen (o pueden influir) en el cambio de precio en un momento dado. Y el conocimiento de est
Uno de los poderosos métodos de análisis es el modelado de series financieras utilizando procesos de Levy. La principal ventaja de estos procesos es que pueden usarse para modelar una gran cantidad de fenómenos, desde los más simples hasta los más complejos. Basta con decir que la idea del movimiento de los precios fractales en el mercado es solo un caso especial de los procesos de Levy. Por otro lado, con la selección adecuada de los parámetros, cualquier proceso de Levy puede representarse co
Muy a menudo, el comerciante se enfrenta a la tarea de determinar en qué medida el precio puede cambiar en un futuro próximo. Para este propósito, puede usar el tipo de distribución Johnson SB. La principal ventaja de esta distribución es que puede usarse incluso con una pequeña cantidad de datos acumulados. El enfoque empírico utilizado para determinar los parámetros de esta distribución le permite determinar con precisión los niveles máximos y mínimos del canal de precios. Estos valores se pu
Este indicador le permite determinar la probabilidad de que el precio alcance uno u otro nivel. Su algoritmo es bastante simple y se basa en el uso de datos estadísticos sobre los niveles de precios de un par de divisas en particular. Gracias a los datos históricos recopilados, es posible determinar en qué medida cambiará el precio durante la barra actual. A pesar de su simplicidad, este indicador puede proporcionar asistencia invaluable en el comercio. Entonces, con su ayuda, es posible determ
Filtro:
No hay comentarios
Respuesta al comentario