• Información general
  • Comentarios
  • Discusión

AIS Kolmogorov Zhurbenko Filter

El filtro de Kolmogorov-Zhurbenko se puede considerar como una función de ventana especial diseñada para eliminar la fuga espectral. Este filtro es óptimo para suavizar series temporales estocásticas (incluidas las financieras).
El indicador basado en este filtro contiene los siguientes parámetros:
  • iLength: el período de la ventana rectangular original utilizada para construir el filtro. El valor válido es 2 - 255.
  • iDegree - orden de filtrado. Si iDegree=0, entonces se obtendrá un promedio móvil simple. Si iDegree=1, obtienes una media móvil triangular. Los órdenes más altos permiten un mejor suavizado y supresión de ruido. El valor permitido es 2 - 255. Además, este parámetro afecta el período final del indicador = iLength + iDegree * (iLength - 1).
  • iMultiplier: un multiplicador que muestra el número de desviaciones estándar contadas desde el valor del filtro.

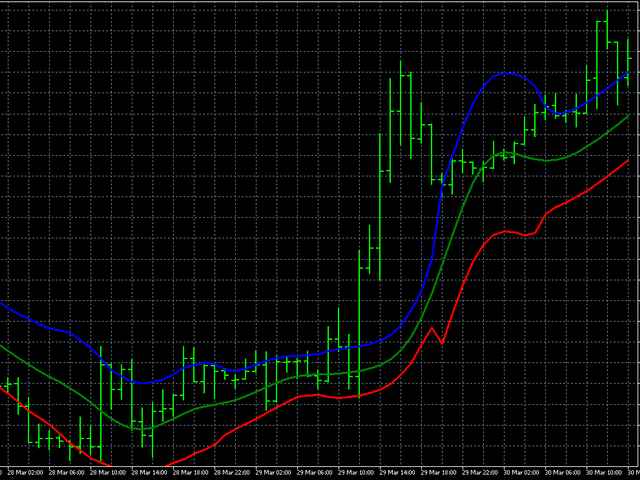
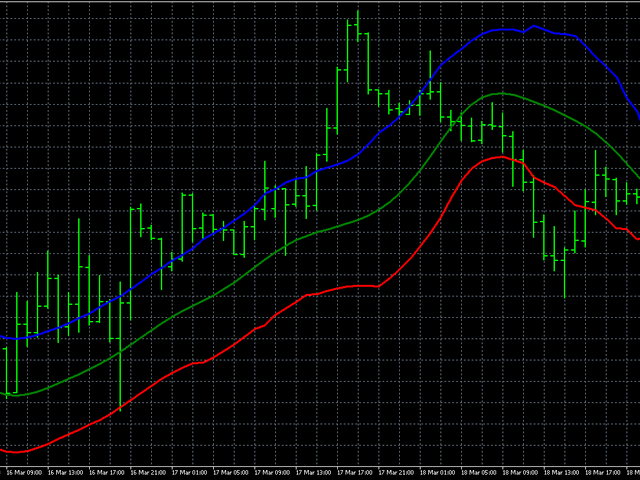
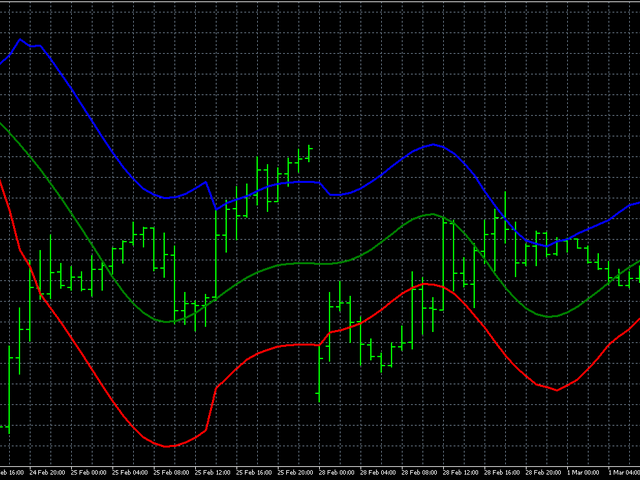
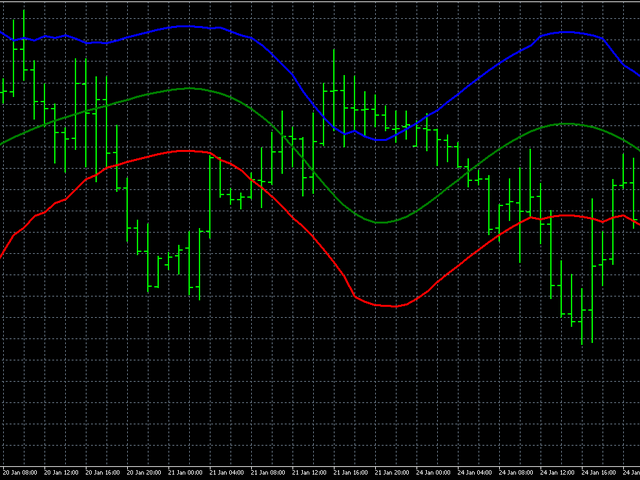
La apariencia del indicador se muestra en las imágenes.
Productos recomendados
Th3 BarPlay Signals Mt4
Nnamdi Kennedy Ifeorah
Esta es una estrategia basada en Price Action conocida como 3Bar_Play y se basa en la formación del patrón de velas 3Bar. Se agregan indicadores adicionales para el filtro y las confirmaciones antes de que aparezcan las flechas de señal de compra/venta. Se puede negociar en un mercado de tendencia alcista, bajista o lateral. Los indicadores agregados incluyen: Estocástico - Momentum Pescador - Tendencia ATR - Volatilidad que también define claramente la colocación de Stop-Loss en la base de la
Trend Suffer
Philip Effiong Philip
Alerts you on new trends, with ENTRY and EXIT points. INSTRUCTIONS  Select asset of choice, activate the indicator on the chart and just follow the signals from the arrows. ITS FREE, GIVE ME A GOOD RATING! Platform : Metatrader4 Asset : All Currencies, Gold, BTCUSD, NASDAQ PS : F or newbie and pro traders. Used by more 3,000 traders around the world. Send  a mail for further help and information...........
Note : The slow loading of the indicator issue has been addressed . This new version loads fast and does not slow the platform. Version 1.3 : We have updated the indicator to include an historical bar scanning option . So instead of scanning all bars in the history (which can make the indicator slow sometimes ) , you can select the maximum number of bars it can scan which can increase the performance and make the indicator faster. This indicator scans the 1-3 Trendline pattern . The indic
Drawing Pack
John Louis Fernando Diamante
4 (1)
This indicator provides several drawing tools to assist in various methods of chart analysis. The drawings will keep their proportions (according to their handle trendline) across different chart scales, update in real time, and multiple drawings are supported. # Drawing Option Description  1 Grid box draggable boxed grid, user defines rows x colums, diagonal ray option  2 Grid partial or fullscreen grid, sized by handle line  3 Grid flex a diagonal grid, sized and sloped by handle line
The trader uses the Trend for Neuro indicator to determine the market situation. This is a trending algorithm that is convenient to download, install and use. The algorithm with acceptable accuracy generates input signals and output levels. Strategy for trend trading, filtering and all the necessary functions built into one tool! By launching the indicator, the user will see only two types of arrows that can change color to blue during an uptrend, to red during a downtrend there is no uncertaint
Smart trends view
Maria Cristina Sabatini
Clear trend filter   This is a filter-trend indicator.  From the settings you can select to use more filter or less. The very interesting part of the indicator comes out using with all the filter. In this way you can follow the trend easily even when the market is without a strong trend, but is instead more flat. I personally use it on 1 minutue timeframe with  MORE FILTER (you can select it from the input setting) in order to have an overlook of trend in the market.   Added: - Sound Notificatio
Dynamic SR Trend Channel Dynamic SR Trend Channel is a simple indicator for trend detection as well as resistance/support levels on the current timeframe. It shows you areas where to expect possible change in trend direction and trend continuation. It works with any trading system (both price action and other trading system that use indicators) and is also very good for renko charting system as well. In an uptrend, the red line (main line) serves as the support and the blue line serves as the
Fluctuation Bands
Francisco De A Vilar Enriquez
Shows the price fluctuation bands associated with a moving average. It is extremely accurate, and it's a wonderful visual guide. The indicator consists of 4 bands . The two bands closest to the price form the fluctuation channel , they mark the maximum calculated deviation of the price from the moving average. The outer bands mark the maximum overdeviation of the price with respect to the fluctuation channel, they are overbought or oversold areas. Features.  -The change of periods of the MA is d
Reincarnations
Maryna Shulzhenko
The Reincarnations trend indicator is used to determine the strength and direction of a trend and to find price reversal points. This tool scans the market looking for the correct entry. You can see and evaluate it yourself, perhaps it will suit you for a number of tasks related to forecasting price movements. It uses only price data and analytics to calculate entry points. Does not use auxiliary indicators. It has two parameters for customization. Indicator setting. Interval - price analysis
ROC acceleration-deceleration is the manual system for medium-term scalping. Indicator based on custom ROC system which defines bullish/bearish market and especially  acceleration-deceleration of tendention in the market's main direction. Buy arrow is plotted during bearish market when current trend decelerates and sell  arrow is plotted during bullish market when current trend decelerates. Main Indicator's Features Signals are not repaint,non-late or disappear(exept cases when system recalculat
RSI Jurik
Augustine Kamatu
Introducing RSI Jurik—an innovative indicator designed to revolutionize your forex trading strategy by combining custom moving averages based on the Relative Strength Index (RSI) with the MetaTrader 4 indicator, RSI. Jurik moving averages are renowned for their accuracy and reliability in analyzing price movements in the forex market. They provide traders with smoother representations of price action, reducing noise and offering clearer signals for identifying trends and potential reversals.
FREE
PTW NON REPAINT TRADING SYSTEM + HISTOGRAM Non-Repainting ,   Non-Redrawing   and   Non-Lagging  Trading System. Does the following: - Gives Accurate Entry and Exit Points - Scalping, Day and Swing Trading  - 95% Accuracy  - Targets, where to take profits. - Shows Trends, Support and resistance levels - Works on All Brokers - Works on All Currencies, CFDs and Stocks - It does not place trades for you, it only shows you what trades to place. - It works on All Timeframes - It is for Trend or ra
KT DMA is a modified and advanced version of the classic Displaced Moving Averages with buy/sell crossover alerts and a Multi-Timeframe scanner that shows DMA's direction across each real-time time frame. A Displaced Moving Average is a simple moving average that moves ahead or backward in a time frame (either short-term or long-term). It also allows you to predict price movement more accurately. Features Depicts the trend direction using the alignment of three moving averages. Buy/Sell signa
This system never paints.   This system created by using Envolpes bands and reverse bar count.   This indicator is only working in M5 period.   This system is for long term and profitable.   Signals are shown as arrows. as an optional limit orders.   You can set a voice alarm or email notification.   You can fins our other products from link : https://www.mql5.com/en/users/drbastem/seller   Also, you can ask all your questins from email : haskayafx@gmail.com or mobile : +90 530 867 5076 or @Meh
This indicator shows in a subwindow the trend in M1, M5, H1, D1 timeframes based on MA, MACD, Stochastic This way you could see in once in different timeframes what happening.  This is my first free indicator. Please follow I will put here some more. Thank you for you attention.  . . . . . lfknglkslksnlgslgnsflgjrpoesv ,msv lkrjpfjésmdg sd.npo4wsmdglknsp4jwpkeégmfs.lkmp Thank you
FREE
The Waddah Attar Explosion (WAE) indicator is a potent tool in Forex trading, offering buy, sell, exit buy, and exit sell signals. It assesses trends as trend power and momentum as explosion power. Trend Direction: - Green bars indicate a bullish trend. - Red bars indicate a bearish trend. Signal Line: - A line serves as a threshold for momentum. Buy Trade Setup: **Entry:** Go long when a green bar crosses above the threshold. Place a stop loss below the entry candle. **Exit:** Close the
TMoney OrderblockDay
Moises Orlando Urbina Sojo
El indicador se activa al inicio de cada día de operaciones y detecta potenciales ORDERBLOCK tanto alcistas como bajistas. Estos niveles son de alta probabilidad operacional, pudiendo utilizar un ratio mínimo de 3 a 1 para maximizar las ganancias. Se recomienda utilizar TimeFrame M5 a M30 para una adecuada visualización y considere órdenes pendientes en los niveles OB del gráfico y colocar el SL hasta un máximo de 20 pips del precio de entrada. Someta el indicador a Backtesting para familiari
The indicator shows the Buy/Sell direction. The calculations use the opening prices and their rate of change for the billing period - "Calculation period" MTF indicator - "Calculation timeframe", no repaint - NRP. Two display types: "Chart default" или "Chart color" For "Chart color" color customization available : "Bar color" Two types stop levels: "Simple stop level" or "Dynamic stop level " Color settings: "Stop level color" Alerts available: "Chart message", "Push message", "Email message" F
RoyalPrince Fibo
Richard Louis Pastor
4.93 (29)
Royal Prince Fibonacci , has the most advance Trend detection algorithm built into its Alert system combined with the RoyalPrince Non-repaint Arrows with it's own alert system you will never miss the opportunity of the trade.  2nd picture is how to use Guide on how i use it to Scalp or take long trades. works on all Charts and all Timeframe on mt4. ︎Best Timeframe M15 for scalping  H1 for Day Trading Options: • Fibonacci days High and Lows  • Fibonacci Targets • Fibonacci Alert System • Tren
Con esta herramienta comercial, puede escanear 15 mercados simultáneamente. Presentamos el nuevo indicador comercial 2024: ️ Tablero Estocástico de marco de tiempo múltiple y moneda múltiple. Hay al menos dos razones por las que creé esta herramienta comercial: Primero, estoy aburrido de observar sólo un mercado. En segundo lugar, no quiero perder el momento de entrada en otro mercado. Por eso quiero conocer al mismo tiempo otras condiciones del mercado. Por este motivo, necesito u
A useful scanner/dashboard that shows the RSI values for multiple symbols and time-frames. It can be easily hidden/displayed with a simple click on the scanner man top left of the dashboard. You can input upper and lower RSI values and the colours can be set to show when above/below these values. The default values are 70 and 30. There are also input colours for when the RSI is above or below 50 (but not exceeding the upper/lower levels Symbols and time-frames are input separated by comma
Gold PL MTF - this is a fine stock technical indicator. The indicator algorithm analyzes the movement of the asset price and automatically reflects the important Pivot Levels of the specified timeframe (TF) using the Fibonacci method (golden section). The indicator perfectly describes the price trajectory of the selected timeframe (day, week, month, year), determines the beginning of a trend and the beginning of a correction, which may develop into an opposite trend. The indicator also shows t
Implement
Vitalii Zakharuk
5 (1)
Implement analyzes market dynamics for pivot points. If you want to learn how to spot the correct reversals for consistently likely profitable trading, buy this indicator. Shows favorable moments of entering the market in stripes. Ready-made trading system. The principle of operation of the indicator is to automatically determine the current state of the market when placed on a chart, analyze historical data based on historical data and display instructions for further actions on the trader's
Introducción al indicador MT4: Indicador de nivel de K-line, ayuda a los traders a identificar oportunidades de trading al 100% Resumen: El indicador de nivel de K-line es una herramienta de análisis técnico poderosa que ayuda a los traders a identificar oportunidades de trading de alta probabilidad. Al analizar los máximos, mínimos, aperturas y cierres de las K-lines, este indicador revela niveles ocultos de soporte y resistencia que actúan como imanes para la acción del precio. Funciones: Iden
Ezy Option Signal
Nirundorn Promphao
The principle of this indicator is very simple: detecting the trend with Moving Average, then monitoring the return point of graph by using the crossing of Stochastic Oscillator and finally predicting BUY and SELL signal with arrows, alerts and notifications. The parameters are fixed and automatically calculated on each time frame. Example: If you install indicator on EURUSD, timeframe M5: the indicator will detect the main trend with the Moving Average on this timeframe (for example the Moving
What does this do? It shows you on the chart which stop belongs to which entry.  Have you ever had multiple positions or trades open on a single pair and were confused which stop loss goes with what entry? Even worse, the stop loss orders for buy and sells are the same color on the chart. Well, your problem has been solved! This indicator will show you which stop belongs to which entry.  It will place a vertical line and an arrow on the chart for each open trade. A yellow line connects the entry
Rira VWAP Bands
Vitor Palmeira Abbehusen
VWAP Bands gives you the regular Volume-Weighted Average Price and also the deviation bands. Use this indicator to see the possible amount of market movement, find support and resistance lines, find good spots for entry and exit,  and the most important feature is to find possible pivot points. This indicator has been mathematically improved by Rira team. The calculation begins at the start of each trading day
This product shows you a different view of the market by examining the performance of volume and continuous patterns in the market, then by calculating the behavior of traders and market patterns, calculates the probability of the next movement of the market by calculations. Function. How to receive the signal: If the candlestick is currently a bullish candlestick, according to a market scan, if the next bullish candlestick is below 5%, you can open a free trade by hitting the wisdom areas.
Arrow indicator, to determine adjustments and local trends The arrow appears on the current bar and after closing the bar will not disappear. Allows you to enter the transaction at the very beginning of the movement Thanks to the flexible settings you can use on any currency pairs, metals and cryptocurrency Can be used when working with binary options Distinctive features Does not redraw. Additional parameters for fine tuning. Works on all timeframes and symbols. Suitable for trading c
RSI Divergence Scanner
Reza Aghajanpour
4.5 (14)
** All Symbols x All Timeframes scan just by pressing scanner button ** ***Contact me after purchase to send you instructions and add you in "RSI scanner group" for sharing or seeing experiences with other users. Introduction RSI divergence is a main technique used to determine trend reversing when it’s time to sell or buy because prices are likely to drop or pick in the charts. The RSI Divergence indicator can help you locate the top and bottom of the market. This indicator finds Regular div
Los compradores de este producto también adquieren
ACTUALMENTE 26% DE DESCUENTO ¡La mejor solución para cualquier operador novato o experto! Este indicador es una herramienta única, de alta calidad y asequible porque hemos incorporado una serie de características propias y una nueva fórmula. ¡Con sólo UN gráfico puede leer la Fuerza de la Divisa para 28 pares de Divisas! Imagínese cómo mejorará su operativa porque podrá señalar el punto exacto de activación de una nueva tendencia o de una oportunidad de scalping. Manual del usuario: haga
TPSpro RFI Levels
Roman Podpora
4.8 (15)
Reversal First Impulse levels (RFI)    INSTRUCTIONS        RUS       -       ENG              R ecommended to use with an indicator   -   TREND PRO -  Version MT5 A key element in trading is zones or levels from which decisions to buy or sell a trading instrument are made. Despite attempts by major players to conceal their presence in the market, they inevitably leave traces. Our task was to learn how to identify these traces and interpret them correctly. Main functions: Displaying active zones
Scalper Inside PRO
Alexey Minkov
4.75 (57)
An exclusive indicator that utilizes an innovative algorithm to swiftly and accurately determine the market trend. The indicator automatically calculates opening, closing, and profit levels, providing detailed trading statistics. With these features, you can choose the most appropriate trading instrument for the current market conditions. Additionally, you can easily integrate your own arrow indicators into Scalper Inside Pro to quickly evaluate their statistics and profitability. Scalper Inside
Atomic Analyst
Issam Kassas
5 (3)
En primer lugar, vale la pena enfatizar que este Indicador de Trading no repinta, no redibuja y no se retrasa, lo que lo hace ideal tanto para el trading manual como para el automatizado. Manual del usuario: configuraciones, entradas y estrategia. El Analista Atómico es un Indicador de Acción del Precio PA que utiliza la fuerza y el impulso del precio para encontrar una mejor ventaja en el mercado. Equipado con filtros avanzados que ayudan a eliminar ruidos y señales falsas, y aumentan el poten
Advanced Supply Demand
Bernhard Schweigert
4.92 (311)
¡Actualmente con 33% de descuento! ¡La mejor solución para cualquier tráder principiante o experto! Este indicador es una herramienta comercial única, de alta calidad y asequible, porque incorpora una serie de características patentadas y una nueva fórmula. Con esta actualización, podrá mostrar zonas de doble marco temporal. No solo podrá mostrar un marco temporal más alto, sino también mostrar ambos, el marco temporal del gráfico MÁS el marco temporal más alto: MOSTRANDO ZONAS ANIDADAS. A todos
TPSproTREND PrO
Roman Podpora
4.78 (18)
TPSpro TRENDPRO  - is a trend indicator that automatically analyzes the market and provides information about the trend and each of its changes, as well as giving signals for entering trades without redrawing! The indicator uses each candle, analyzing them separately. referring to different impulses - up or down impulse. Exact entry points into transactions for currencies, crypto, metals, stocks, indices!  -  Version MT5               DETAILED DESCRIPTION                R ecommended to use with
TrendMaestro
Stefano Frisetti
5 (2)
note: this indicator is for METATRADER4, if you want the version for METATRADER5 this is the link:  https://www.mql5.com/it/market/product/108106 TRENDMAESTRO ver 2.4 TRENDMAESTRO recognizes a new TREND in the bud, he never makes mistakes. The certainty of identifying a new TREND is priceless. DESCRIPTION TRENDMAESTRO identifies a new TREND in the bud, this indicator examines the volatility, volumes and momentum to identify the moment in which there is an explosion of one or more of these data a
Por supuesto, aquí tienes la traducción al español: Presentamos el Indicador de Astronomía para MT4: Tu Compañero Celestial Definitivo en el Trading ¿Estás listo para elevar tu experiencia de trading a alturas celestiales? No busques más allá de nuestro revolucionario Indicador de Astronomía para MT4. Esta innovadora herramienta trasciende los indicadores de trading tradicionales, aprovechando el poder de algoritmos complejos para proporcionarte una visión astronómica sin igual y cálculos de pre
Gann Swing Structure
Kirill Borovskii
5 (1)
This indicator is based on the mathematics of the great trader W.D. Ganna. With its help, you can easily find strong levels by analyzing swings to find the optimal entry point. The indicator works on all instruments and all timeframes. The indicator is fully manual and has control buttons. All you need to do is press the NEW button, a segment will appear, which you can place on any movement, swing or even 1 candle that you want to analyze. By placing the segment, press the OK button. A grid (th
FX Power MT4 NG
Daniel Stein
5 (10)
Obtenga su actualización diaria del mercado con detalles y capturas de pantalla a través de nuestro Morning Briefing aquí en mql5 y en Telegram ! FX Power MT4 NG es la nueva generación de nuestro popular medidor de fuerza de divisas, FX Power. ¿Y qué ofrece este medidor de fuerza de nueva generación? Todo lo que le encantaba del FX Power original PLUS Análisis de fuerza de ORO/XAU Resultados de cálculo aún más precisos Períodos de análisis configurables individualmente Límite de cálculo persona
¡Actualmente 20% OFF ! ¡La mejor solución para cualquier novato o trader experto! Este software funciona con 28 pares de divisas. Se basa en 2 de nuestros principales indicadores (Advanced Currency Strength 28 y Advanced Currency Impulse). Proporciona una gran visión general de todo el mercado de divisas. Muestra los valores de Advanced Currency Strength, la velocidad de movimiento de las divisas y las señales para 28 pares de divisas en todos los (9) marcos temporales. Imagine cómo mejorar
Dragon Multi Indicator MT4
Mansour Babasafary
5 (4)
3 Indicators in 1 indicator Strategy based on price action Made specifically for the best forex currency pairs Can be used in the best time frame of the market at a very reasonable price This indicator is basically 3 different indicatos . But we have combined these 3 indicators in 1 indicator so that you can use 3 indicators at the lowest price. All three strategies are based on price action. But based on different trends. Long term, medium term and short term Attributes : No repaintin
Introduciendo       Indicador Quantum Trend Sniper   , el innovador indicador MQL5 que está transformando la forma en que identificas y negocias los cambios de tendencia. Desarrollado por un equipo de comerciantes experimentados con experiencia comercial de más de 13 años,       Indicador de francotirador de tendencia cuántica       está diseñado para impulsar su viaje comercial a nuevas alturas con su forma innovadora de identificar cambios de tendencia con una precisión extremadamente alta.
FX Volume
Daniel Stein
4.6 (35)
Obtenga su actualización diaria del mercado con detalles y capturas de pantalla a través de nuestro Morning Briefing aquí en mql5 y en Telegram ! FX Volume es el PRIMER y ÚNICO indicador de volumen que proporciona una visión REAL del sentimiento del mercado desde el punto de vista de un bróker. Proporciona una visión impresionante de cómo los participantes institucionales del mercado, como los brokers, están posicionados en el mercado Forex, mucho más rápido que los informes COT. Ver esta info
Volatility Trend System - un sistema de comercio que da señales para las entradas. El sistema de volatilidad da señales lineales y puntuales en la dirección de la tendencia, así como señales para salir de ella, sin redibujar ni demoras. El indicador de tendencia monitorea la dirección de la tendencia a mediano plazo, muestra la dirección y su cambio. El indicador de señal se basa en cambios en la volatilidad y muestra entradas en el mercado. El indicador está equipado con varios tipos de ale
Cycle Sniper
Elmira Memish
4.39 (36)
NEW YEAR SALE PRICE FOR LIMITED TIME!!! Please contact us after your purchase and we will send you the complimentary indicators to complete the system Cycle Sniper is not a holy grail but when you use it in a system which is explained in the videos, you will feel the difference. If you are not willing to focus on the charts designed with Cycle Sniper and other free tools we provide, we recommend not buying this indicator. We recommend watching the videos about the indiactor and system before pu
Nasdaq100 Power Indicator
Teboho Edgar Rakotsoane
5 (4)
The NASDAQ 100 Power Indicator serves with TREND and trend reversals indication using automated arrows that indicates buy or sell at that price and has built-in signal provider across all time frames with alerts and provides also the automated support and resistance that can draw technical analysis patterns like double bottom, double top, head and shoulders etc. using closing and open prices, in assistance for if a trader did not see the pattern sooner for their technical analysis. The indicator
XQ Indicator MetaTrader 4
Marzena Maria Szmit
3 (2)
Step into the realm of Forex trading with confidence and precision using XQ, a cutting-edge Forex indicator designed to elevate your trading game to unprecedented heights. Whether you're a seasoned trader or just stepping into the world of currency exchange,   XQ Forex Indicator   empowers you with the insights and signals needed to make informed trading decisions. The signal conditions are a combination of three indicators, and XQ Forex Indicator only display  medium and long-term trends . The
ECM Channel MT4
Paulo Rocha
5 (1)
ECM Elite Channel is a volatility-based indicator, developed with a specific time algorithm, which consists of finding possible corrections in the market. This indicator shows two outer lines, an inner line (retracement line) and an arrow sign, where the channel theory is to help identify overbought and oversold conditions in the market. The market price will generally fall between the boundaries of the channel. If prices touch or move outside the channel, it's a trading opportunity. The
Currency Strength Exotics
Bernhard Schweigert
4.88 (33)
¡ACTUALMENTE 20% DE DESCUENTO ! ¡La mejor solución para cualquier operador novato o experto! Este indicador está especializado en mostrar la fuerza de la divisa para cualquier símbolo como Pares Exóticos, Materias Primas, Índices o Futuros. Es el primero de su clase, cualquier símbolo se puede añadir a la 9 ª línea para mostrar la verdadera fuerza de la moneda de Oro, Plata, Petróleo, DAX, US30, MXN, TRY, CNH etc. Se trata de una herramienta de trading única, de alta calidad y asequible por
Quantum Breakout Indicator PRO
Bogdan Ion Puscasu
4.96 (26)
Introduciendo       Quantum Breakout PRO   , el innovador indicador MQL5 que está transformando la forma en que comercia con Breakout Zones. Desarrollado por un equipo de operadores experimentados con experiencia comercial de más de 13 años,   Quantum Breakout PRO   está diseñado para impulsar su viaje comercial a nuevas alturas con su innovadora y dinámica estrategia de zona de ruptura. El indicador de ruptura cuántica le dará flechas de señal en las zonas de ruptura con 5 zonas objetivo de
Backtesting Simulator MT4
Diego Arribas Lopez
3.5 (2)
[ MT5 Version ] Backtesting Simulator Are you tired of spending months on demo or live accounts to test your trading strategies? The Backtesting Simulator is the ultimate tool designed to elevate your backtesting experience to new heights. Utilizing Metatrader historical symbol information, it offers an unparalleled simulation of real market conditions. Take control of your testing speed, test ideas quickly or at a slower pace, and witness remarkable improvements in your testing performance. For
Este indicador examina la estructura de precios de fractales de diferentes períodos para determinar los posibles puntos de reversión en el mercado, brindando tiempo a los operadores posicionales que ya tienen un modelo de valoración fundamental o técnico. A diferencia de su hermano menor, Reversal Fractals , este indicador no perderá las reversiones debido al período seleccionado, y encontrará fractales de reversión en forma de zig-zag, ignorando esas reversiones que no tienen el impulso sufici
Presentamos ON Trade Waves Patterns Harmonic Elliot Wolfe, un indicador avanzado diseñado para detectar diversas formas de patrones en el mercado mediante métodos tanto manuales como automáticos. A continuación, te explicamos cómo funciona: Patrones Armónicos: Este indicador puede identificar patrones armónicos que aparecen en tu gráfico. Estos patrones son esenciales para los traders que practican la teoría del trading armónico, tal como se popularizó en el libro de Scott Carney "Harmonic Tradi
Shepherd Harmonic Pattern
Abdullah Alrai
4.68 (59)
Este indicador detectará patrones armónicos que se dibujen en el gráfico mediante métodos manuales y automáticos. Puede consultar el manual del usuario en el siguiente enlace: Agregue su opinión y contáctenos para obtenerlo Existe una versión gratuita para probar este producto en mt4. Puede utilizarlo para detectar patrones de Gartley y Nenstar: https://www.mql5.com/en/market/product/30181 Puede comprar la versión completa de MT4 en: https://www.mql5.com/en/market/product/15212 Notas El indicad
All in One Trade
Alexey Minkov
4.48 (27)
The All-in-One Trade Indicator (AOTI) determines daily targets for EURUSD, EURJPY, GBPUSD, USDCHF, EURGBP, EURCAD, EURAUD, AUDJPY, GBPAUD, GBPCAD, GBPCHF, GBPJPY, AUDUSD, and USDJPY. All other modules work with any trading instruments. The indicator includes various features, such as Double Channel trend direction, Price channel, MA Bands, Fibo levels, Climax Bar detection, and others. The AOTI indicator is based on several trading strategies, and created to simplify market analysis. All-in-One
WARNING!! THIS SWORD IS TOO SHARP!    ONLY 10 COPIES LEFT FOR THE NEXT PRICE TO BE 8,000$ FOR UNLIMITED PLAN. Dear traders I am very glad once again to introduce to you my other tool called "Forex Sword Indicator". In short this tool is meant to give you an edge over the market that you have been waiting for  so long. Now, here it is. It is a very very simple tool but yet a dangerous sword. I call it a  Holy grail indicator!. I will not talk a lot about this tool. Just let the tool speak by itse
The indicator of a Professional Trader is an arrow indicator for predicting the direction of price movement. I have been working on this indicator since 2014. You can use this indicator as your main indicator, use its entry signals, and use it as your only indicator to find entry points. About the product: Recommended TF [H4-D1-W1]   . The indicator predicts the direction of the next candle. Fits a variety of tools; Flexibility in settings for different instruments and intervals through the
Full STO
Roman Smoroda
Indicador STO completo (incluye todas las versiones de tres indicadores STO: Premium, Gold, Silver) - STABLE TRADE OPTION está diseñado para el comercio automático de opciones binarias.  ¡¡¡¡¡LEA CUIDADOSAMENTE!!!!! IMPORTANTE En un terminal cree dos plantillas con diferentes vencimientos, una plantilla para las 18:01, 18:02 con vencimientos de 1 a 15 minutos y una plantilla para las 22:00 con vencimientos de 10 a 20 minutos. Winrate: 71% en los últimos 5 años Gestión del dinero: 0,3% d
PZ Swing Trading
PZ TRADING SLU
5 (4)
Swing Trading es el primer indicador diseñado para detectar oscilaciones en la dirección de la tendencia y posibles oscilaciones de reversión. Utiliza el enfoque de intercambio de línea de base, ampliamente descrito en la literatura comercial. El indicador estudia varios vectores de precios y tiempos para rastrear la dirección de la tendencia agregada y detecta situaciones en las que el mercado está sobrevendido o sobrecomprado y listo para corregir. [ Guía de instalación | Guía de actualización
Otros productos de este autor
MinDeposit MT5
Aleksej Poljakov
3 (1)
The script analyzes the history of quotes and gives recommendations on the minimum deposit. The calculations take into account the variability of prices and the standard deviation. Margin requirements for the instrument are also taken into account. The result of the script is the minimum recommended deposit for trading the given currency pair.
FREE
El script se basa en la simulación de transacciones comerciales utilizando un generador de números aleatorios. Esto le permite obtener resultados completamente diferentes, incluso con los mismos parámetros de entrada. Cuando ejecuta el script, se abre un cuadro de diálogo en el que puede establecer los valores deseados para las variables externas. En el bloque, TradingOptions define los parámetros básicos que se necesitan para simular el comercio. StartBalance : establece el tamaño inicial de l
FREE
This script allows selecting the TakeProfit and StopLoss levels. It analyzes the history data, and then calculates the probability of reaching a given price level. How the script works Suppose you have a trading strategy and you want to select the TakeProfit and StopLoss levels. Run the script and set the parameter: Number of Bars - the average position holding time in bars. Once the script operation is complete, the AIS-PPL.csv file will be created in the Files folder in the terminal data cat
FREE
AIS Money Management MT5
Aleksej Poljakov
5 (1)
El script se basa en la simulación de transacciones comerciales utilizando un generador de números aleatorios. Esto le permite obtener resultados completamente diferentes, incluso con los mismos parámetros de entrada. Cuando ejecuta el script, se abre un cuadro de diálogo en el que puede establecer los valores deseados para las variables externas. En el bloque,   TradingOptions   define los parámetros básicos que se necesitan para simular el comercio. StartBalance : establece el tamaño inicial
FREE
Este script está diseñado para que el comerciante pueda determinar la duración promedio de las transacciones comerciales, en la cual la relación de posibles ganancias y pérdidas será óptima. Primero, veamos el enfoque general para determinar la duración óptima de las transacciones comerciales. Introducimos las siguientes variables: R   - el resultado de la transacción; T   - el tiempo durante el cual la transacción estuvo abierta; W : el tiempo entre el cierre de la transacción anterior y la ape
FREE
MinDeposit
Aleksej Poljakov
5 (1)
The script analyzes the history of quotes and gives recommendations on the minimum deposit. The calculations take into account the variability of prices and the standard deviation. Margin requirements for the instrument are also taken into account. The result of the script is the minimum recommended deposit for trading the given currency pair.
FREE
This script allows selecting the TakeProfit and StopLoss levels. It analyzes the history data, and then calculates the probability of reaching a given price level. How the script works Suppose you have a trading strategy and you want to select the TakeProfit and StopLoss levels. Run the script and set the parameter: Number of Bars - the average position holding time in bars. Once the script operation is complete, the AIS-PPL.csv file will be created in the Files folder in the terminal data cat
FREE
Este script está diseñado para que el comerciante pueda determinar la duración promedio de las transacciones comerciales, en la cual la relación de posibles ganancias y pérdidas será óptima. Primero, veamos el enfoque general para determinar la duración óptima de las transacciones comerciales. Introducimos las siguientes variables: R - el resultado de la transacción; T - el tiempo durante el cual la transacción estuvo abierta; W : el tiempo entre el cierre de la transacción anterior y la apertur
FREE
La elección de los niveles de StopLoss y TakeProfit puede tener un impacto muy fuerte en el rendimiento general de las operaciones. Además de los parámetros obvios de una transacción comercial (el tamaño de una posible ganancia o pérdida probable), los niveles de StopLoss y TakeProfit también afectan la duración esperada de la transacción y la rentabilidad de la negociación en general. Si ya ha determinado la duración óptima de la transacción utilizando el script " AIS-ODT ", entonces puede come
FREE
The script allows selecting the required 'Filter level' value of the AIS-MTF indicator. Run the script on the required chart and selected timeframe. Once its operation is complete, the HPS.csv file will be created in the Files folder. Open the file. You will see three columns. The 'Filter lvl' column represents the value of the 'Filter level' for the AIS-MTF indicator. Am. dev. - degree and direction of the indicator's deviation from the price level (sorted in ascending order). Negative values i
FREE
The script allows selecting the required 'Filter level' value of the AIS-MTF MT5 indicator. Run the script on the required chart and selected timeframe. Once its operation is complete, the HPS.csv file will be created in the Files folder. Open the file. You will see three columns. The 'Filter lvl' column represents the value of the 'Filter level' for the AIS-MTF indicator. Am. dev. - degree and direction of the indicator's deviation from the price level (sorted in ascending order). Negative valu
FREE
El indicador de promedios correctos de AIS le permite establecer el comienzo de un movimiento de tendencia en el mercado. Otra cualidad importante del indicador es una clara señal del final de la tendencia. El indicador no se redibuja ni se recalcula. Valores mostrados h_AE - límite superior del canal AE l_AE - límite inferior del canal AE h_EC - Valor predicho alto para la barra actual l_EC - Valor predicho bajo para la barra actual Señales al trabajar con el indicador. La señal prin
El indicador de promedio móvil ponderado AIS calcula un promedio móvil ponderado y le permite determinar el comienzo de un movimiento de tendencia del mercado. Los coeficientes de peso se calculan teniendo en cuenta las características específicas de cada barra. Esto le permite filtrar los movimientos aleatorios del mercado. La señal principal que confirma el comienzo de una tendencia es un cambio en la dirección de las líneas del indicador y el precio que cruza las líneas del indicador.
El indicador de factibilidad de grado avanzado de AIS está diseñado para predecir los niveles que el precio puede alcanzar en el futuro. Su trabajo es analizar las últimas tres barras y construir un pronóstico basado en eso. El indicador se puede utilizar en cualquier período de tiempo y cualquier par de divisas. Con la ayuda de la configuración, puede lograr la calidad deseada del pronóstico. Profundidad de pronóstico: establece la profundidad de pronóstico deseada en barras. Se recomienda s
The indicator is designed to measure the price volatility. This allows determining the moments for opening or closing trade positions more accurately. High intensity of the market indicates the instability of its movement, but allows for better results. And, conversely, low intensity of the market indicates the stability of its movement. Parameters Bars to process - the number of bars to measure the price movements. A low value of this parameter allows determining the moments of rapid price mo
This indicator uses the Fibonacci p-numbers to smooth a price series. This allows combining the advantages of the simple and exponential moving averages. The smoothing coefficients depend on the level of the p-number, which is set in the indicator parameters. The higher the level, the greater the influence of the simple moving average and the less significant the exponential moving average. Parameters Fibonacci Numbers Order - order of the Fibonacci p-number, specified by trader. Valid values
The indicator is based on the analysis of interaction of two filters. The first filter is the popular Moving Average. It helps to identify linear price movements and to smooth minor price fluctuations. The second filter is the Sliding Median. It is a non-linear filter. It allows to filter out noise and single spikes in the price movement. A predictive filter implemented in this indicator is based on the difference between these filters. The indicator is trained during operation and is therefore
This indicator studies the price action as a combination of micro-trends. All micro-trends are analyzed and averaged. Price movement is filtered based on this averaging. IP_High and IP_Low (blue and red dashed lines) show the instantaneous price movement. They display the forecast only for the current price values, taking into account only the number of bars defined by the 'Filter level' parameter. SP_High and SP_Low (blue and red solid lines) smooth the price movements with respect to history.
Este indicador implementa un proceso de suavizado lineal simple. Una de las desventajas del suavizado exponencial es el rápido decaimiento de la señal. Esto hace que sea imposible realizar un seguimiento completo de las tendencias a largo plazo en el rango de precios. El suavizado lineal le permite ajustar con mayor precisión y precisión el filtrado de la señal. El indicador se configura seleccionando parámetros: LP: este parámetro le permite seleccionar el período de suavizado. Cuanto ma
Este indicador es un filtro híbrido secuencial basado en una combinación de propiedades medias y medias móviles. El uso de la mediana permite filtrar valores atípicos anormales e impulsos aleatorios en los valores de las series de precios. Al mismo tiempo, el filtro de mediana no actúa sobre la tendencia en el movimiento de precios, dejándolo sin cambios. Como el filtro de la mediana no es lineal, se utiliza el promedio utilizando un promedio móvil simple para suavizar sus valores. Este enfoq
Este indicador es una combinación de dos filtros modificados de Lanczos. El primer filtro sirve para extrapolar el precio. Basado en valores pasados, predice un posible movimiento de precios dentro de la barra actual. Es decir, muestra cuál sería el precio si las tendencias pasadas permanecieran sin cambios. El segundo filtro para suavizar y promediar los precios dentro de la ventana, determinado por el nivel del filtro. Gracias a la selección de ponderaciones, este filtro responde más activamen
Echemos un vistazo a la naturaleza de los cambios de precios en el mercado de divisas, sin prestar atención a las razones por las que se producen estos cambios. Este enfoque nos permitirá identificar los principales factores que afectan el movimiento de precios. Por ejemplo, tomemos los precios de apertura de las barras en el par de divisas EUR-USD y el período H1. Para estos precios, construimos el diagrama de Lameray (Figura 1). En este diagrama, se puede ver que el movimiento del precio se pr
Este indicador es más informativo. Su trabajo se basa en la suposición de que el movimiento de los precios en el mercado puede representarse como el ruido de un color en particular, que depende de los parámetros de la distribución de los valores de los precios. Gracias a esto, es posible analizar el cambio de precio desde diferentes ángulos y, considerando el movimiento del precio como ruido de un color en particular, se puede obtener información sobre el estado actual de las cosas en el mercad
A pesar de algunos inconvenientes del indicador " AIS Color Noise Filter ", la idea de usarlo para suavizar las series de precios y los precios de previsión parece bastante atractiva. Esto se debe a varias razones: En primer lugar, tener en cuenta varios componentes de ruido permite elaborar un pronóstico sobre factores independientes entre sí, lo que puede mejorar la calidad del pronóstico; en segundo lugar, las características de ruido de las series de precios se comportan de manera bastante
Muy a menudo, en el estudio de series financieras se aplica su suavizado. Mediante el suavizado, puede eliminar componentes de alta frecuencia; se cree que están causados ​​por factores aleatorios y, por lo tanto, no son significativos. El suavizado siempre incluye alguna forma de promediar los datos, en la que los cambios aleatorios en las series de tiempo se absorben mutuamente. Muy a menudo, para este propósito, se utilizan métodos de media móvil simple o ponderada, así como el suavizado exp
Para aislar componentes a largo plazo y no aleatorios, es necesario saber no solo cuánto ha cambiado el precio, sino también cómo se produjeron estos cambios. En otras palabras, estamos interesados ​​no solo en los valores de los niveles de precios, sino también en el orden en que estos niveles se reemplazan entre sí. A través de este enfoque, se pueden encontrar factores a largo plazo y estables que influyen (o pueden influir) en el cambio de precio en un momento dado. Y el conocimiento de est
Uno de los poderosos métodos de análisis es el modelado de series financieras utilizando procesos de Levy. La principal ventaja de estos procesos es que pueden usarse para modelar una gran cantidad de fenómenos, desde los más simples hasta los más complejos. Basta con decir que la idea del movimiento de los precios fractales en el mercado es solo un caso especial de los procesos de Levy. Por otro lado, con la selección adecuada de los parámetros, cualquier proceso de Levy puede representarse co
Muy a menudo, el comerciante se enfrenta a la tarea de determinar en qué medida el precio puede cambiar en un futuro próximo. Para este propósito, puede usar el tipo de distribución Johnson SB. La principal ventaja de esta distribución es que puede usarse incluso con una pequeña cantidad de datos acumulados. El enfoque empírico utilizado para determinar los parámetros de esta distribución le permite determinar con precisión los niveles máximos y mínimos del canal de precios. Estos valores se pu
Este indicador le permite determinar la probabilidad de que el precio alcance uno u otro nivel. Su algoritmo es bastante simple y se basa en el uso de datos estadísticos sobre los niveles de precios de un par de divisas en particular. Gracias a los datos históricos recopilados, es posible determinar en qué medida cambiará el precio durante la barra actual. A pesar de su simplicidad, este indicador puede proporcionar asistencia invaluable en el comercio. Entonces, con su ayuda, es posible determ
Filtro:
No hay comentarios
Respuesta al comentario