MA Dashboard
- Indicadores
- Taras Slobodyanik
- Versión: 3.60
- Actualizado: 22 mayo 2024
- Activaciones: 10
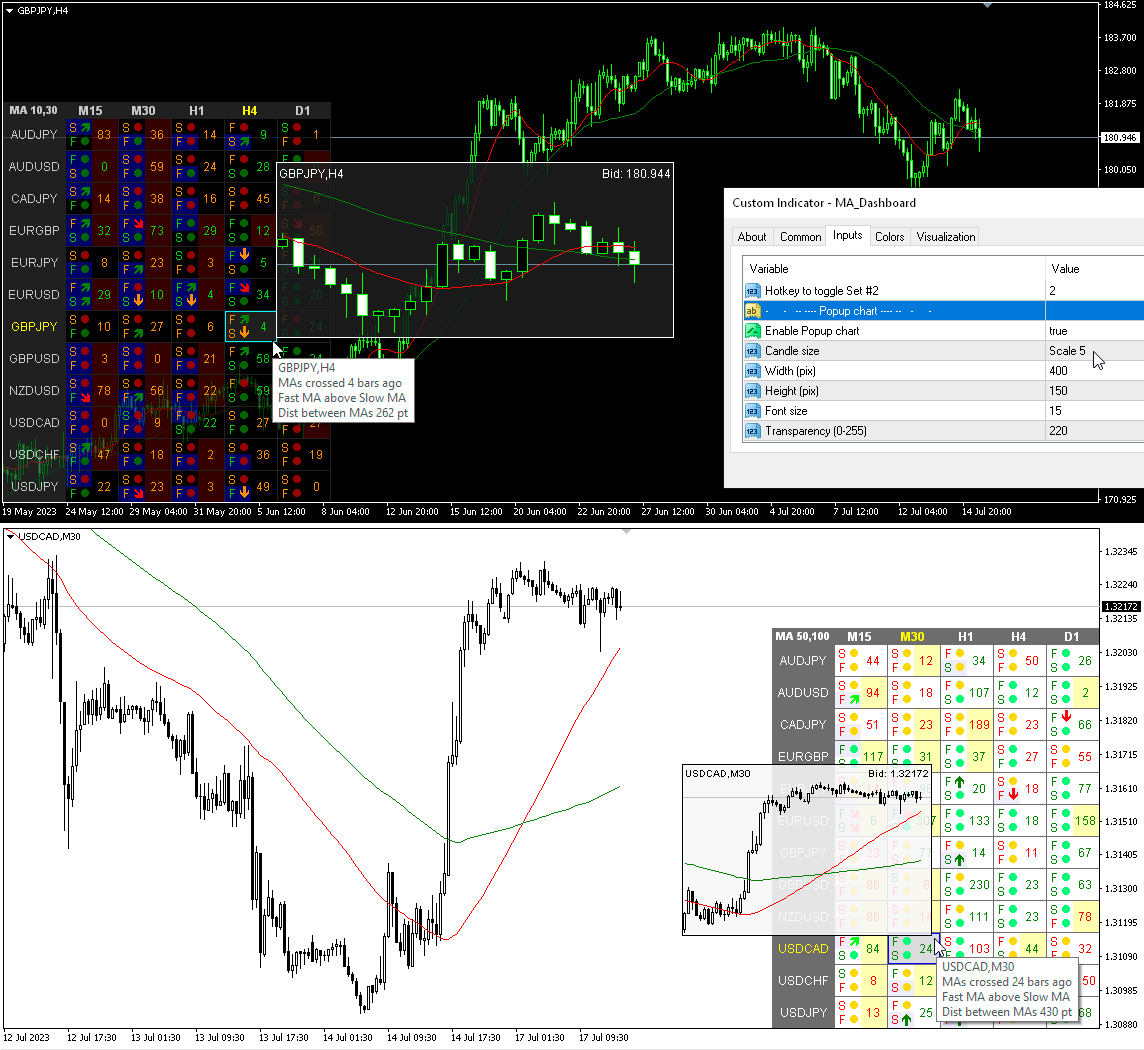
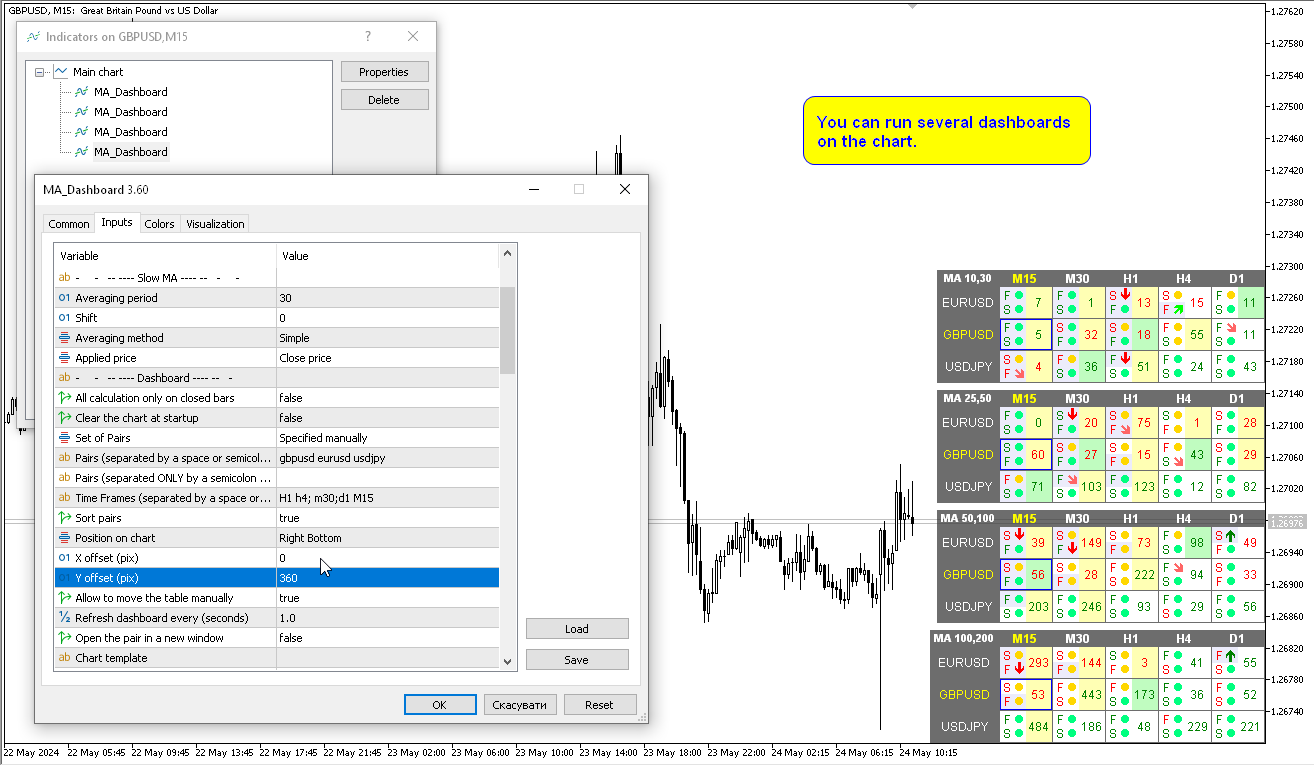
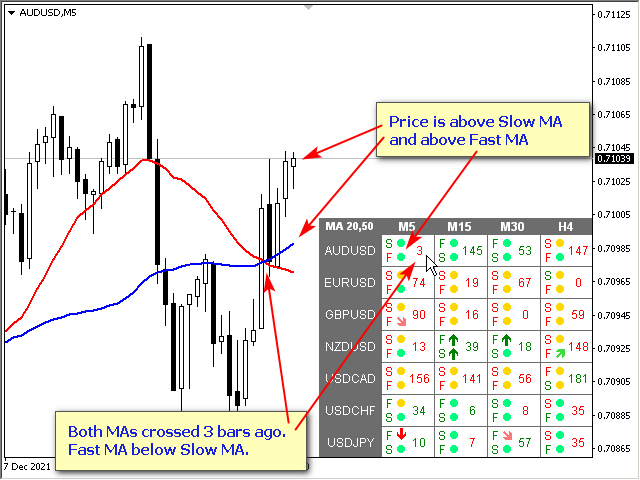
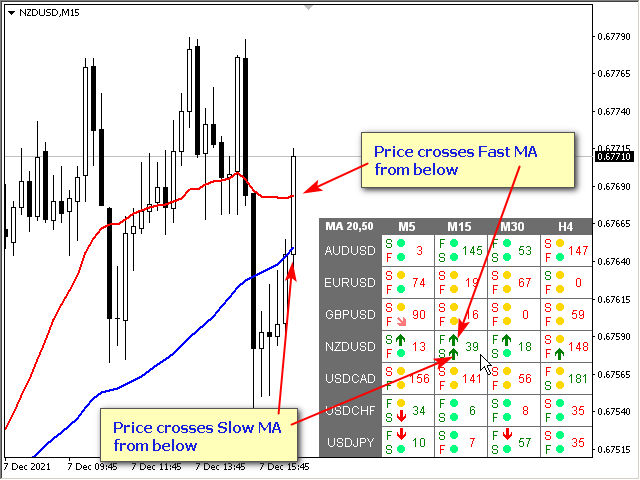
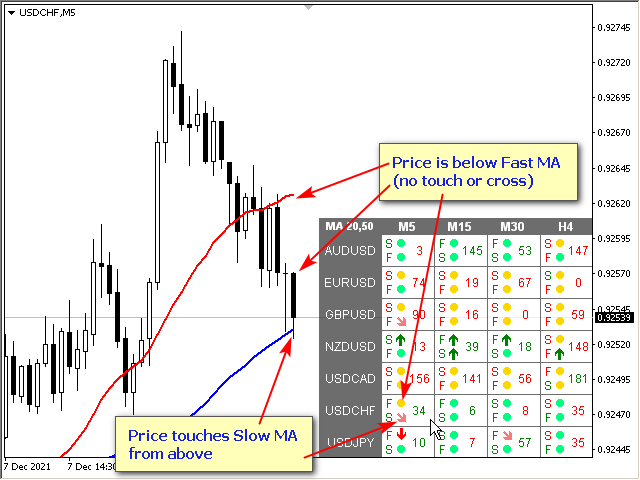
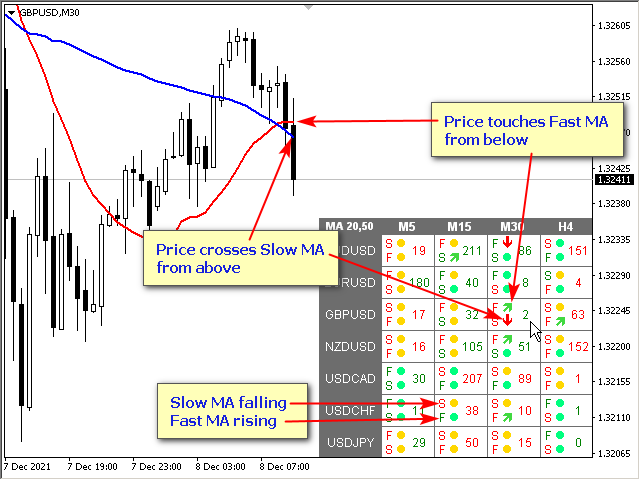
Modificación multidivisa y multitemporal del indicador Media Móvil (MA). En el tablero puede ver el estado actual del indicador: rupturas y toques (por precio) de Fast MA y Slow MA, así como la intersección de las líneas MA entre sí (cruce de media móvil). En los parámetros puede especificar las monedas y plazos que desee. Además, el indicador puede enviar notificaciones sobre el precio que toca las líneas y sobre su cruce. Al hacer clic en una celda con un punto, se abrirá este símbolo y punto. Este es el escáner MTF. Puede ejecutar varios paneles en el gráfico.
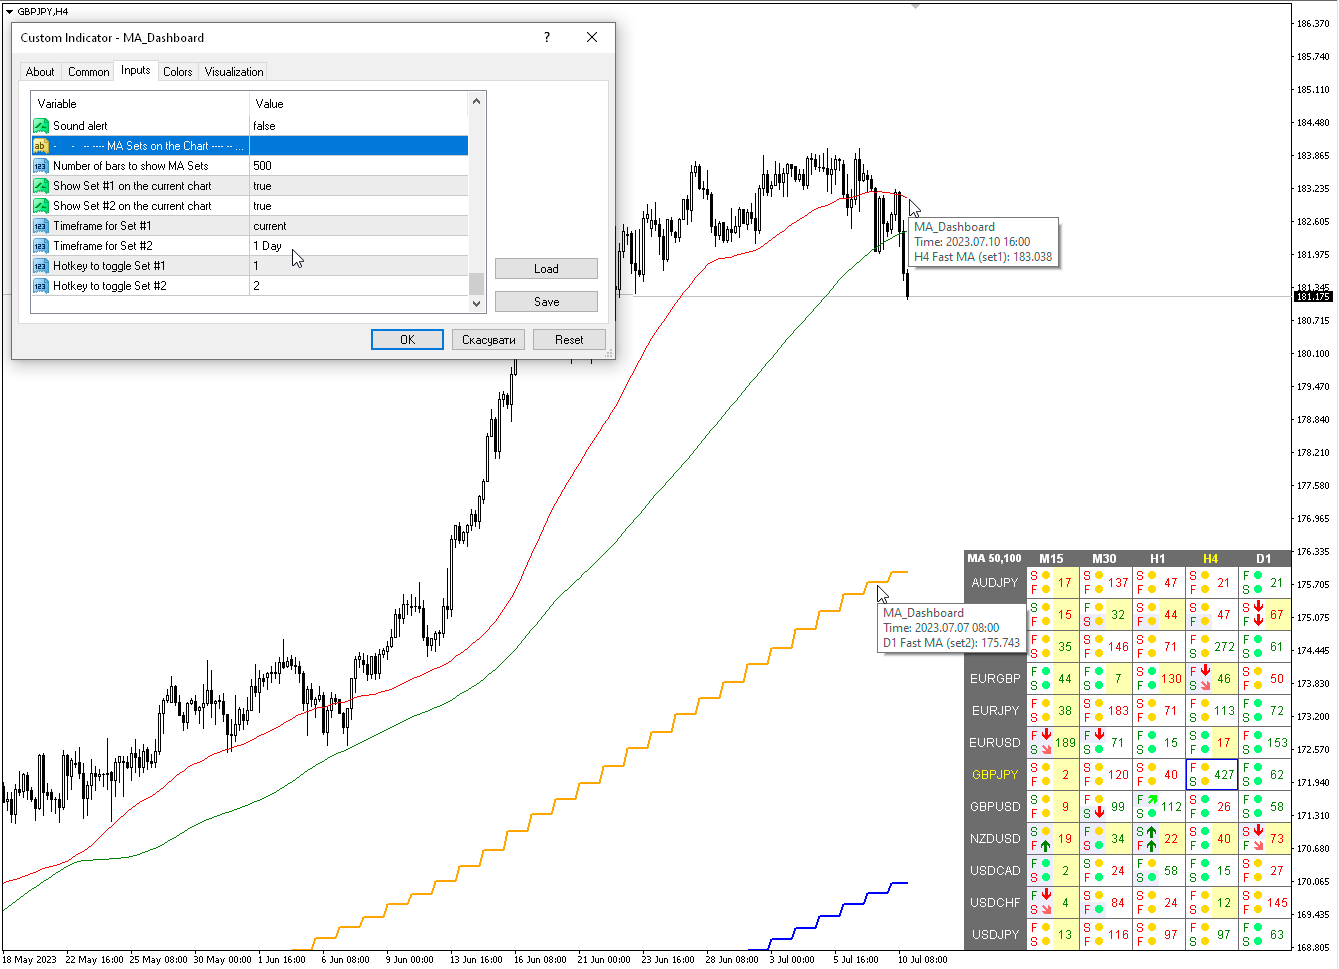
El indicador muestra líneas Fast MA y Slow MA en el gráfico actual. Puede seleccionar el período de tiempo MA para el gráfico y ver MA desde otros períodos de tiempo (MTF MA). Las teclas de acceso rápido para los dos conjuntos de MA son "1" y "2" de forma predeterminada.
La clave para ocultar el panel del gráfico es "D" de forma predeterminada.
Parámetros
Fast MA — MA rápida
Averaging period — Periodo de promediación.
Shift — Cambio.
Averaging method — Método de promediación.
Applied price — Precio aplicado.
Slow MA — MA lenta
Averaging period — Periodo de promediación.
Shift — Cambio.
Averaging method — Método de promediación.
Applied price — Precio aplicado.
Panel
All calculation only on closed bar — Todos los cálculos sólo en barra cerrada.
Clear the chart at startup —borre el gráfico al inicio.
Set of Pairs — Conjunto de pares
— Market Watch — pares de "Market Watch".— Specified manually — pares especificados manualmente, en los parámetros "Pares".— Current pair — muestra solo el par actual.
Pairs (separated by a space or semicolon) — lista de símbolos separados por espacios o punto y coma. Los nombres de las monedas deben escribirse exactamente igual que los del bróker, manteniendo las mayúsculas y minúsculas y el prefijo/sufijo.
Time Frames (separated by a space or semicolon) — lista de períodos de tiempo separados por espacios o punto y coma (marcos de tiempo múltiples).
Sort pairs — ordenar la lista de pares.
Position on chart — esquina para mostrar el panel en el gráfico.
X offset (pix) — desplaza el panel a lo largo del eje X;
Y offset (pix) — desplaza el panel a lo largo del eje Y;
Refresh dashboard every (seconds) — período de actualización para todos los pares y períodos de tiempo.
Open the pair in a new window — abra un símbolo en una nueva ventana del gráfico haciendo clic.
Chart template — el nombre de la plantilla del gráfico, si el gráfico se abre en una ventana nueva.
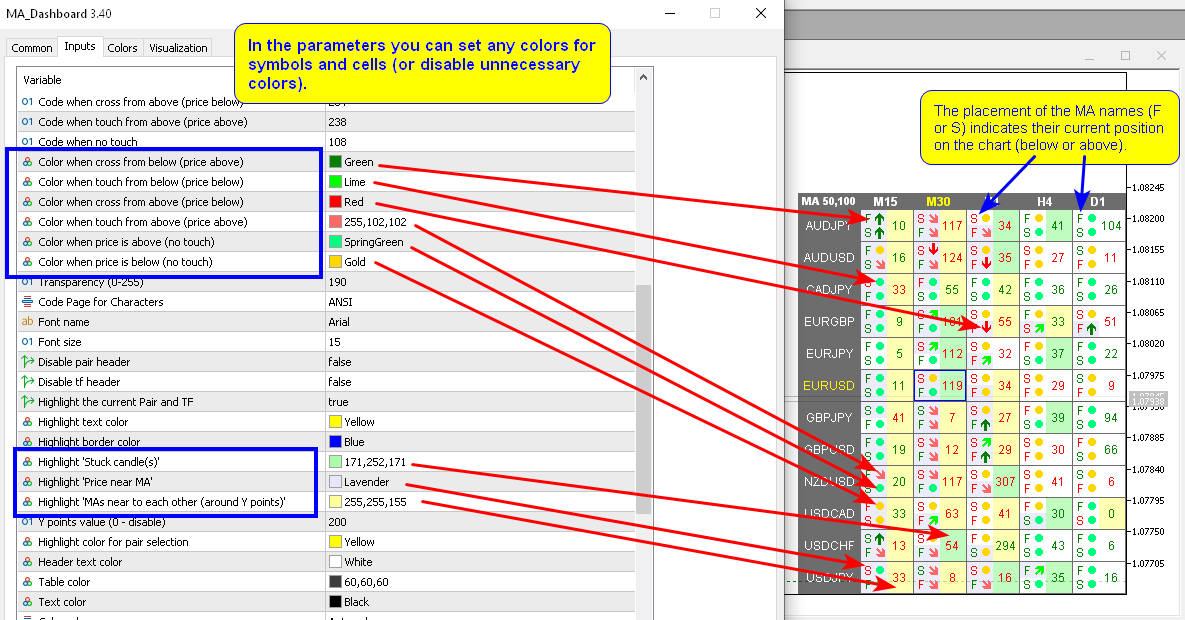
Code when cross from below (price above) — Código cuando se cruza desde abajo (precio arriba);
Code when touch from below (price below) — Código cuando se toca desde abajo (precio a continuación);
Code when cross from above (price below) — Código cuando se cruza desde arriba (precio abajo);
Code when touch from above (price above) — Código cuando se toca desde arriba (precio arriba);
Code when no touch — Código cuando no hay contacto;
Transparency (0-255) — Transparencia (0-255);
Font name — Nombre de la fuente;
Font size — Tamaño de fuente.
Alertas
Timeframes for alerts (separated by a space or semicolon) — Plazos de alertas (separados por un espacio o punto y coma).
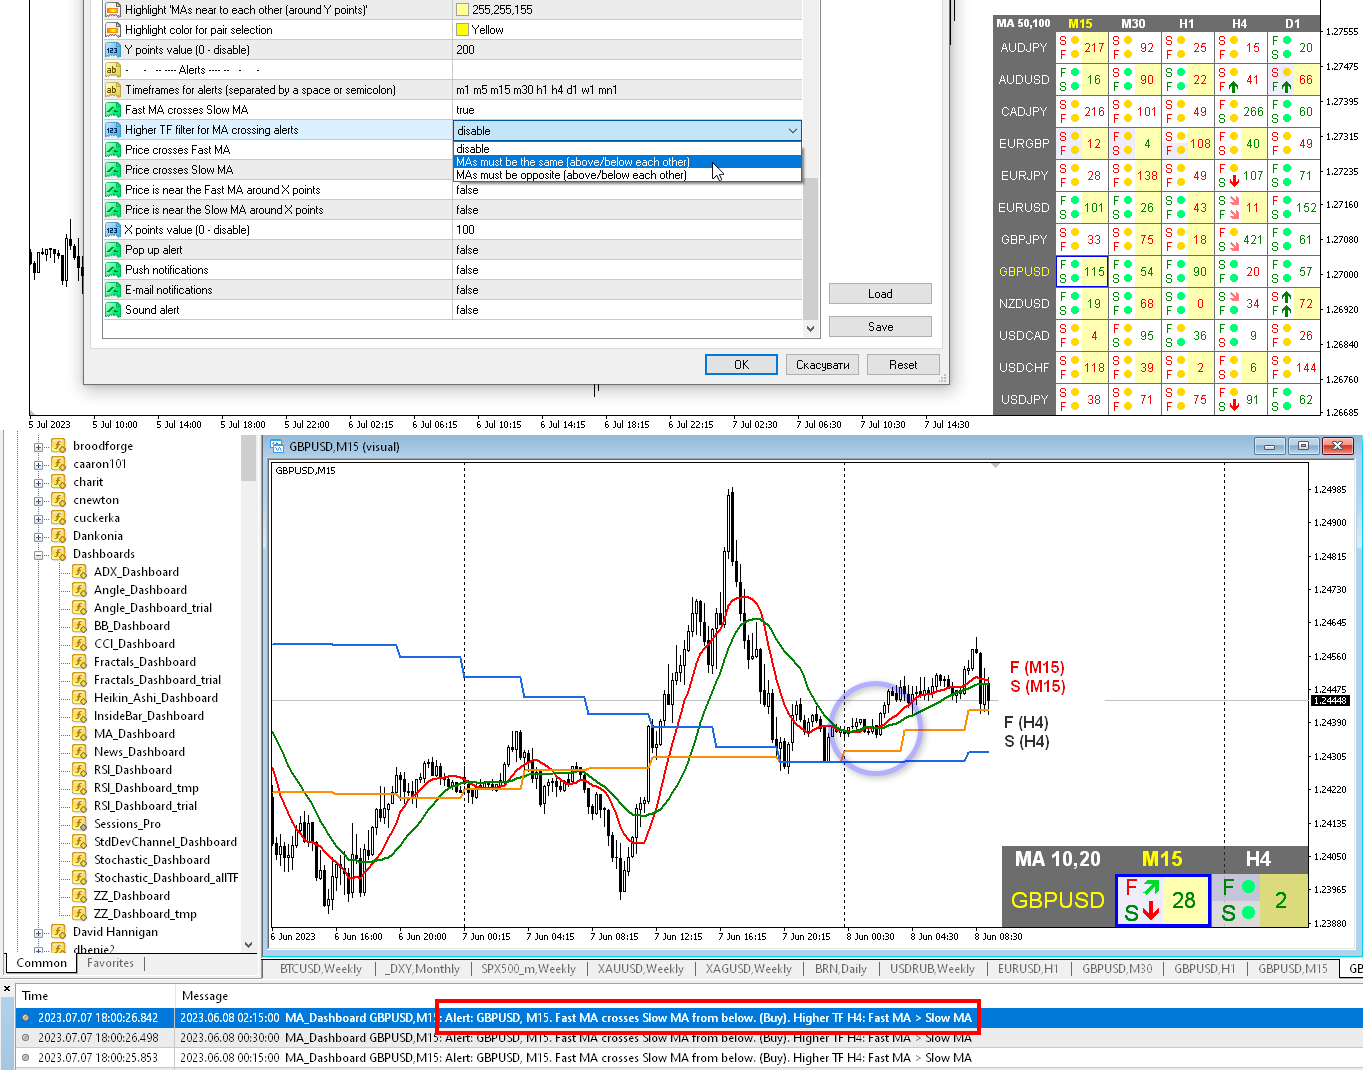
Fast MA crosses Slow MA — MA rápido cruza MA lento;
Higher TF filter for MA crossing alerts — Filtro TF más alto para alertas de cruce de MA — cuando el filtro está habilitado, cuando los MA se cruzan, el indicador verificará los valores de MA del siguiente período de tiempo superior (en el tablero). Si las MA del período de tiempo superior cumplen las condiciones especificadas, se enviará la alerta de cruce de MA; de lo contrario, no habrá alerta.
- disable — desactivar
- MAs must be the same (above/below each other) — Los MA deben ser iguales (uno encima/debajo del otro)
- MAs must be opposite (above/below each other) — Los MA deben ser opuestos (uno encima/debajo del otro)
Price crosses Fast MA — El precio cruza Fast MA;
Price crosses Slow MA — El precio cruza la MA lenta;
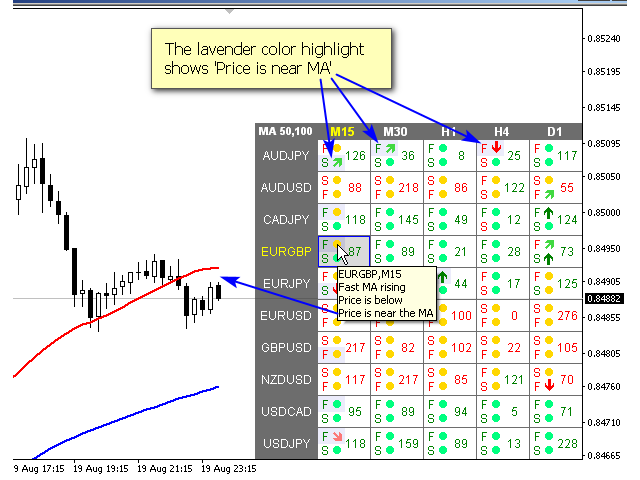
Price is near the Fast MA around X points — El precio está cerca del Fast MA alrededor de X puntos
Price is near the Slow MA around X points — El precio está cerca del MA lento alrededor de X puntos
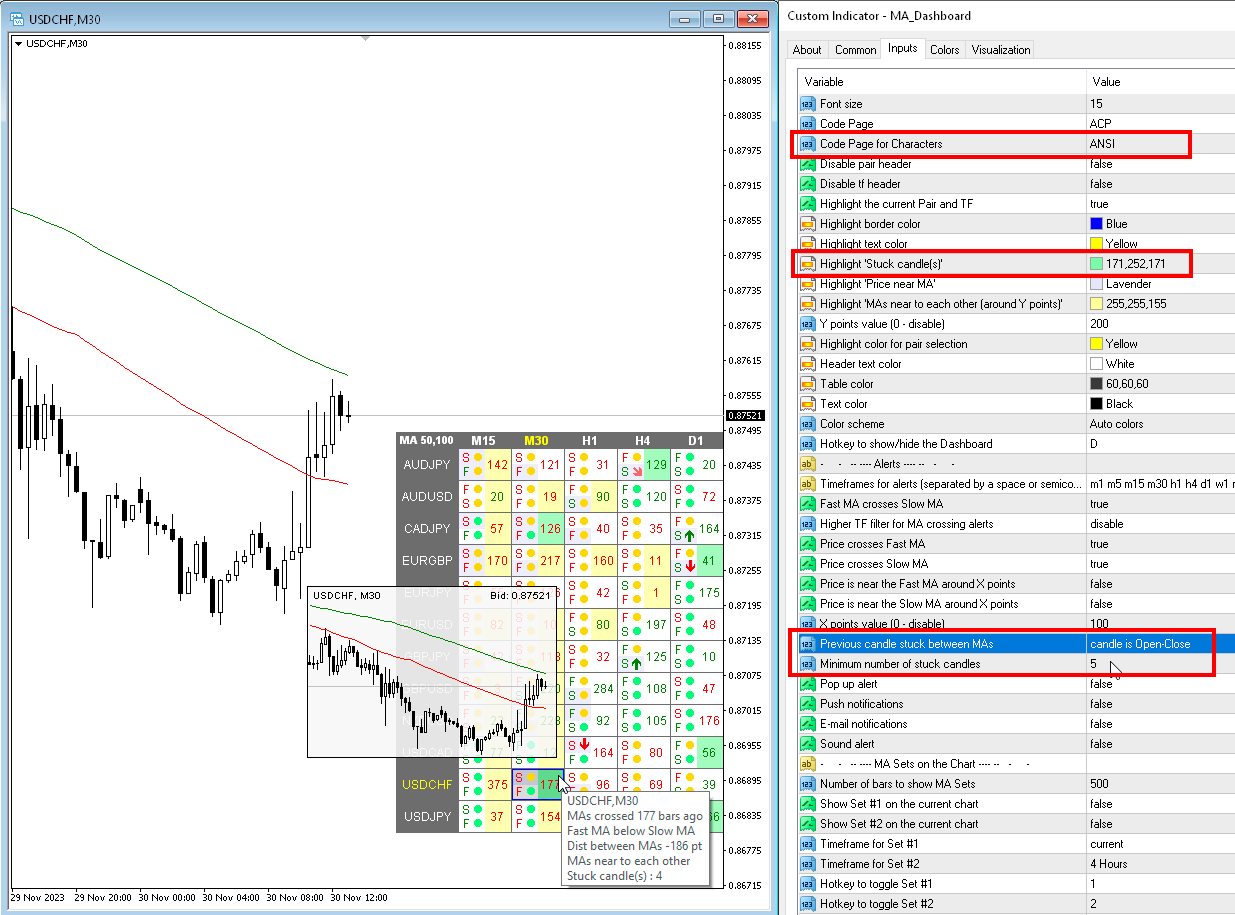
Previous candle stuck between MAs — si las velas anteriores están entre dos MA, puede recibir una alerta sobre esto o verla en la tabla.
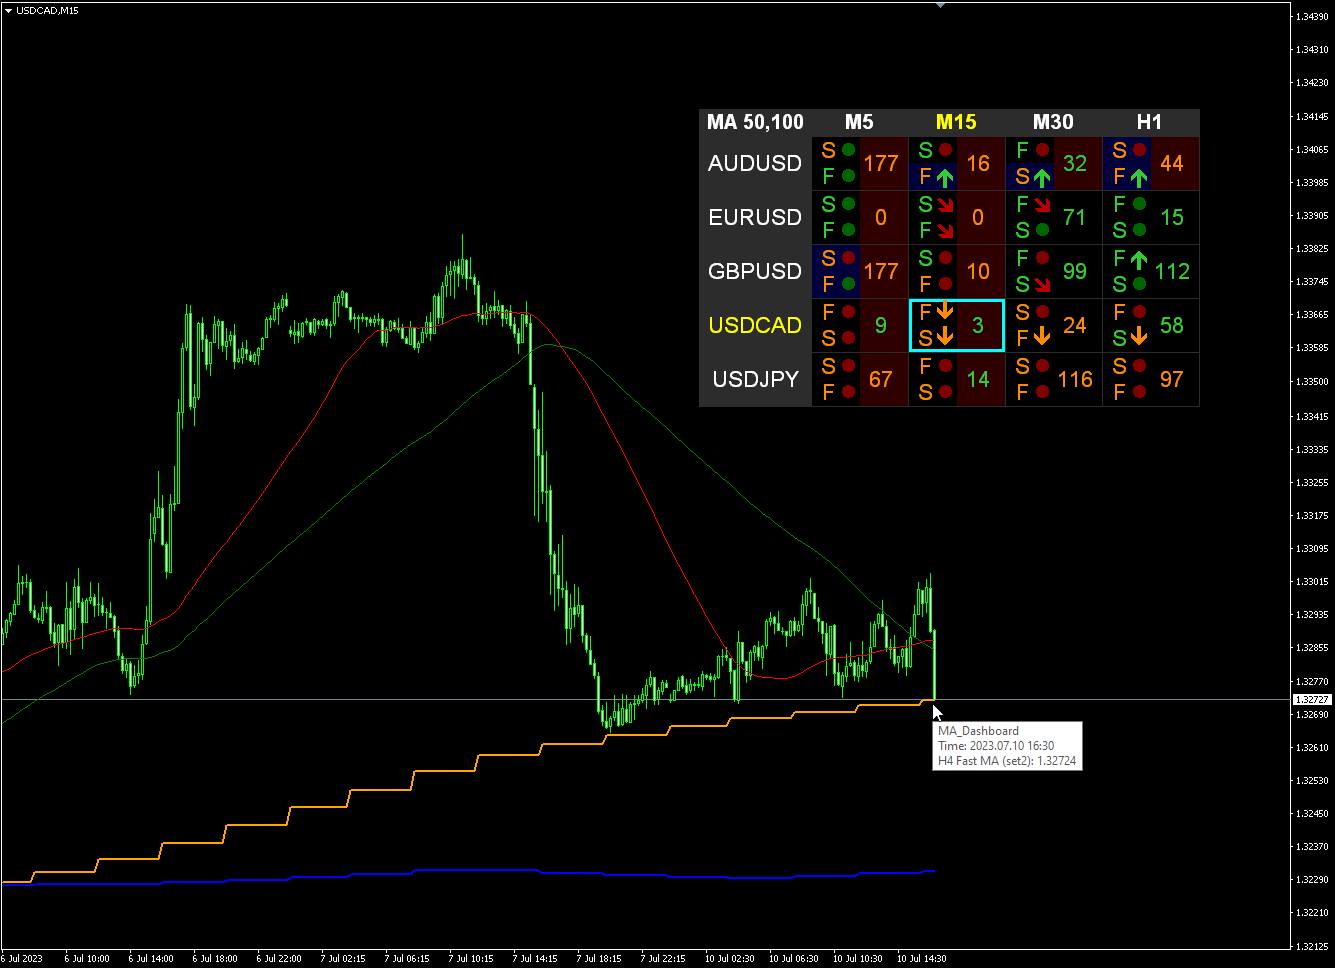
MA Sets on the Chart — Conjuntos MA en el gráfico
Number of bars to show MA Sets — Número de barras para mostrar conjuntos MA
Show Set #1 on the current chart — Mostrar el conjunto n.º 1 en el gráfico actual
Show Set #2 on the current chart — Mostrar el conjunto n.º 2 en el gráfico actual
Timeframe for Set #1 — Plazo para el set n.º 1
Timeframe for Set #2 — Plazo para el set n.º 2
Hotkey to toggle Set #1 — Tecla de acceso rápido para alternar el Conjunto #1
Hotkey to toggle Set #2 — Tecla de acceso rápido para alternar el Conjunto #2
Popup chart — gráfico emergente
Enable Popup chart — Habilitar gráfico emergente
Candle size — Tamaño de la vela
Width (pix) — Ancho (píxeles)
Height (pix) — Altura (foto)
Font size — Tamaño de fuente
Transparency (0-255) — Transparencia (0-255)

Best dashboard for following the MAs , the best 30usd i have spend here! love it.