• Información general
  • Comentarios (1)
  • Discusión
  • Novedades

DYJ TradingView

5
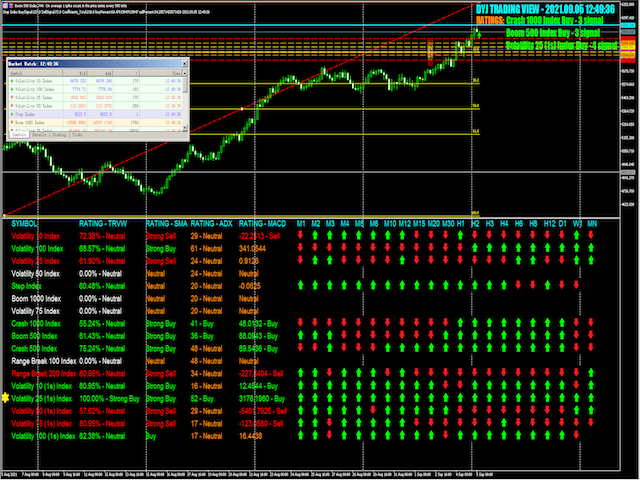
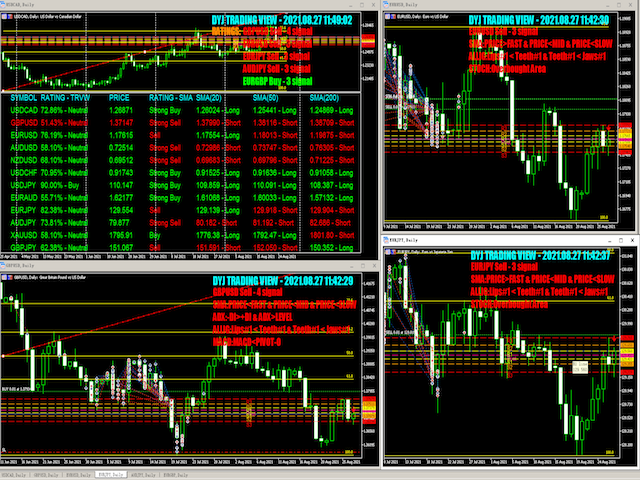
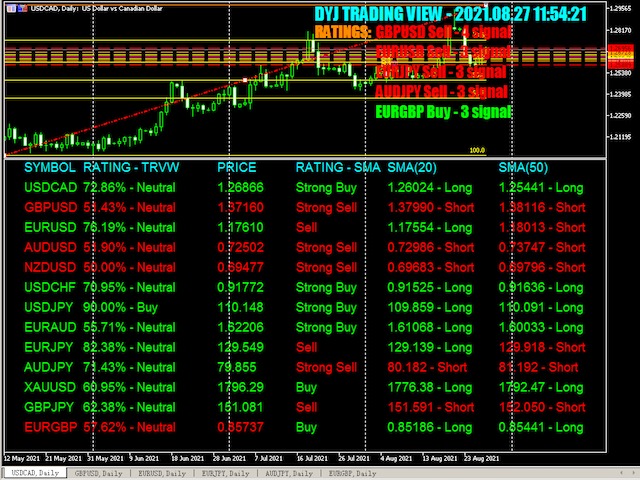
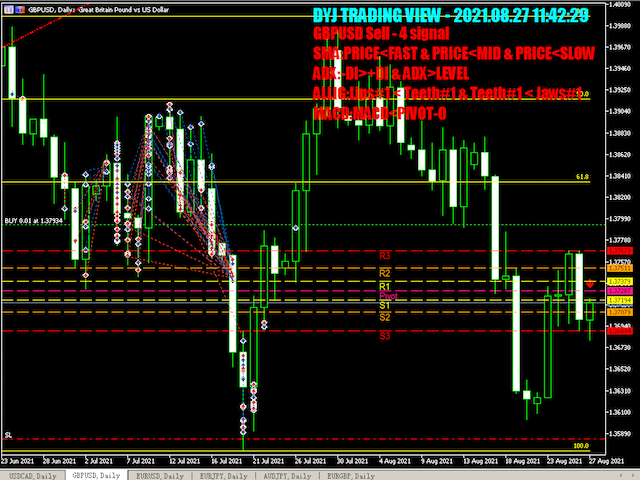
DYJ TRADINGVIEW es un sistema de calificación de indicadores múltiples, que utiliza las señales de calificación y las herramientas de análisis para encontrar oportunidades de entrada en los mercados globales.

DYJ TRADINGVIEW tiene 10 indicadores incorporados para el análisis de mercado.

Muchos comerciantes utilizan el análisis basado en indicadores para ayudarlos a tomar decisiones sobre qué operaciones realizar y dónde ingresar y salir de ellas.

Utilizamos varios tipos diferentes que pueden complementarse bien.

Úsenos para seguir su mercado. Puede encontrar transacciones más precisas.

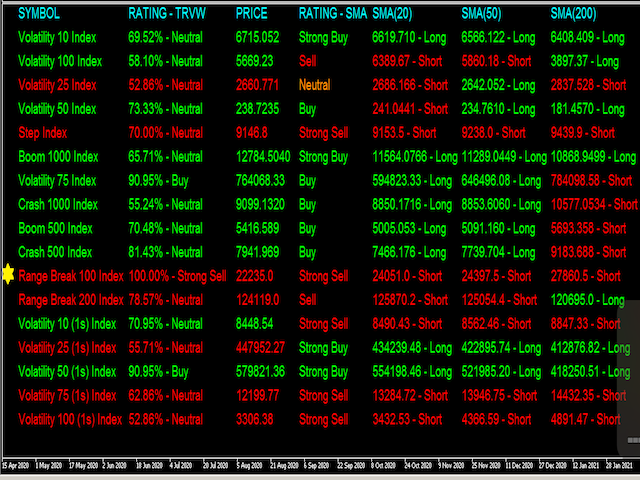
Los indicadores de tendencia que participan en la calificación incluyen DYJ POWERSIGNAL, ADX, SMA, Bollinger Bands.

Los osciladores que participan en la calificación incluyen MACD, RSI, Stochastic, Alligator.

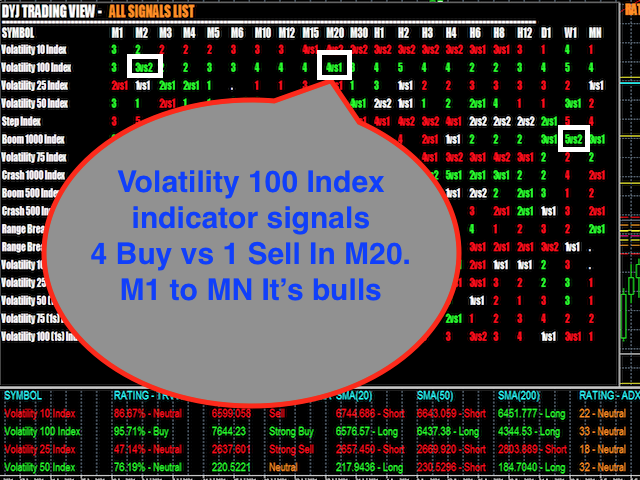
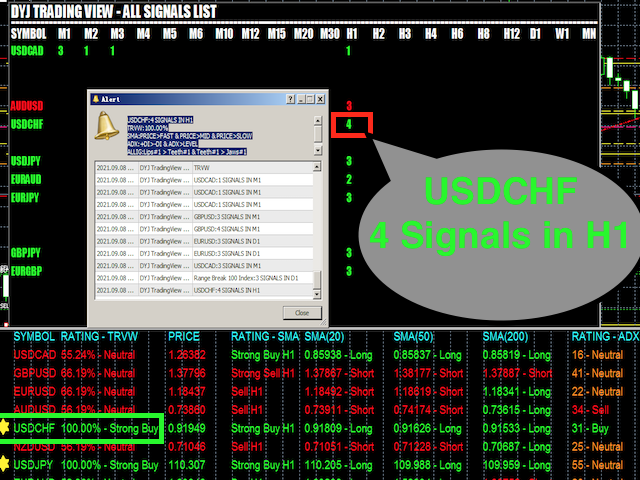
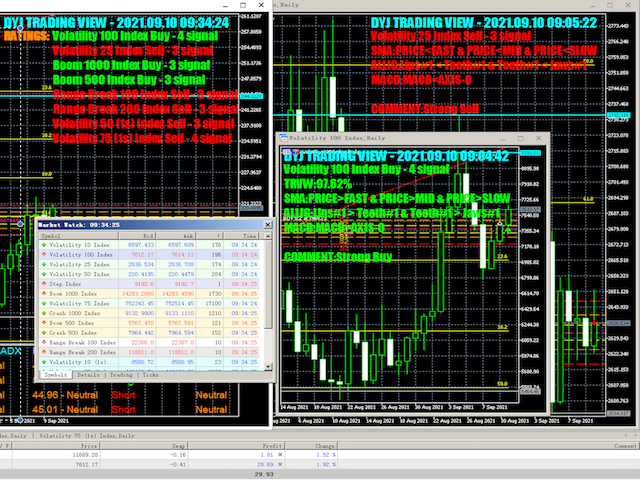
Cuando hay 3 indicadores que muestran la misma dirección para comprar o vender señales cuando el número de señales es mayor o igual a 3, comenzamos a ingresar a la transacción de mercado.

Input

[GENERAL]

  • ViewName           =  "DYJ TRADING VIEW"  --> Company Name.
  • InpIsDisplayPrice  = true  -->  Display Price.
  • InpPriceShiftBars  = 1  -->  Price Shift Bars
  • InpMaxTrendeds   =  3 --> Signals is greater than InpMaxTrendeds, rating symbol .

[TRADINGVIEW]   

  • InpPowerSignalMinPercent   =  90 --> TradeingView Minimum Percent
  • InpPowerSignalStrongPercent   =  100 --> TradeingView Strong Percent
  • InpPowerSignalMaxPercent   =  100 --> TradeingView Maximum Percent
  • InpHiddenPeriodTrend       =  false   --> Hide M1 to MN

[CANDLE]

  • InpUseCandle =  true -->  Use Candle.
  • InpEntryUpper           =  33 --> Spread Multiple,It's Buy Entryies    
  • InpEntryLower           =  33 --> Spread Multiple,It's Sell  Entryies  

[MA]

  • InpUseMA=true;
  • InpIsDisplayFastMA=true  -->  DisplayFastMA
  • InpIsDisplayMidMA=true  --> Display MidMA
  • InpIsDisplaySlowMA=true  --> Display SlowMA
  • InpMAFastPeriod=20        --> Fast Period
  • InpMAMidPeriod=50       -->  Mid Period
  • InpMASlowPeriod=200     -->  Slow Period

[ADX] 

  • InpUseAdx=true --> Use ADX
  • InpIsDisplayPlusdi=false;  -->  Display ADX Plusdi
  • InpIsDisplayMinusdi=false --> Display ADX Minusdi
  • InpAdxPeriod               = 14 -- ADX:  Averaging period 
  • InpTrendLevel              = 30 -- ADX:  Trend Level 

[RSI]

  • InpUseRsi  =true --> Use RSI
  • InpRSIPeriod               =  14  -->  RSI Period
  • InpRsiOversold            =  30       --> R si Oversold
  • InpRsiOverbought        =  70 -->  Rsi Overbought

[BOLLINGER] 

  • InpUseBollinger   =  true  -->  Use Bollinger
  • InpIsDisplayUpper=true
  • InpIsDisplaylower=true
  • Inp_Bands_bands_period                 = 20 -- Bollinger bands period
  • Inp_Bands_deviation                    = 2 -- Bollinger bands deviations
  • InpBandDistance                        = 50 -- BandDistance,in points   

[MACD]

  • InpUseMACD   =  true -->  Use MACD
  • InpIsDisplayMacdSignal=false -->  Display MacdSignal
  • InpMacdFast                = 12 -->  MacdFast
  • InpMacdSlow                = 26 -->  MacdSlow
  • InpMacdSignal              = 9 -->  MacdSignal
  • InpMacdPriceField          = PRICE_CLOSE -->  macd calculation method 
  • InpMACDOpenLevel           = 3 -->  MACD Open Level
  • InpMACDCloseLevel          = 2 -->  MACD Close Level

[MACD MA TREND]

  • InpMacdMA                  = 26  -->  MA Period
  • InpMacdMAMethod            = MODE_EMA -->  type of smoothing macdma
  • InpMacdMAPriceField        = PRICE_CLOSE -->  macd calculation method 

[STOCHASTIC]

  • InpUseStochastic        =  true  --> Use Stochastic
  • InpSTOKperiod              = 5 --> K-period 
  • InpSTODperiod              = 3 --> D-period 
  • InpSTOSlowing              = 3 -->  slowing-period    
  • InpSTOMaMethod             = MODE_EMA -->  type of smoothing stochastic
  • InpSTOPriceField           = STO_LOWHIGH -->  stochastic calculation method 
  • InpOversoldArea            = 20 --> stoch oversold zone
  • InpOverboughtArea          = 80 -->  stoch overbought zone 

[ALLIGATOR]

  • Inp_jaw_period    = 13 -->  period for the calculation of jaws 
  • Inp_jaw_shift     = 8 --> horizontal shift of jaws 
  • Inp_teeth_period  = 8 -->  period for the calculation of teeth 
  • Inp_teeth_shift   = 5 -->  horizontal shift of teeth 
  • Inp_lips_period   = 5 -->  period for the calculation of lips 
  • Inp_lips_shift    = 3 -->  horizontal shift of lips 
  • Inp_ma_method     = MODE_EMA -->  type of smoothing 
  • Inp_applied_price = PRICE_MEDIAN  -->  type of price 

[PIVOT]

  • InpUsePivot = true;  
  • InpCalculationMode =  FIBONACCI_RETRACEMENT    -->   FIBONACCI RETRACEMENT 

[FIBONACCI]

  • InpUseFibonacci = true; 
  • InpFibDate1=1 -->  1 st point's date, % 
  • InpFibPrice1=1 -->  1 st point's price, % 
  • InpFibDate2=100 -->  2 nd point's date, % 
  • InpFibPrice2=100 -->  2 nd point's price, % 

[Panel]

  • InpLanguage              = English --> English or Chinese


Comentarios 1
Marion Lancaster Dicaprio
239
Marion Lancaster Dicaprio 2021.09.07 07:21 
 

I highly recommended Dyj global for their products and customer's services. I sincerely think they are the best in the industry they will go above an beyond to make sure you get the best trading results. I have been using this service for approximately one year.

Productos recomendados
Atomic Analyst MT5
Issam Kassas
3.64 (11)
En primer lugar, vale la pena enfatizar que este Indicador de Trading no repinta, no redibuja y no se retrasa, lo que lo hace ideal tanto para el trading manual como para el automatizado. El Analista Atómico es un Indicador de Acción del Precio PA que utiliza la fuerza y el impulso del precio para encontrar una mejor ventaja en el mercado. Equipado con filtros avanzados que ayudan a eliminar ruidos y señales falsas, y aumentan el potencial de trading. Utilizando múltiples capas de indicadores
Elevate Your Trading Experience with Wamek Trend Consult!   Unlock the power of precise market entry with our advanced trading tool designed to identify early and continuation trends. Wamek Trend Consult empowers traders to enter the market at the perfect moment, utilizing potent filters that reduce fake signals, enhancing trade accuracy, and ultimately increasing profitability.   Key Features: 1. Accurate Trend Identification: The Trend Consult indicator employs advanced algorithms and unparall
Magic Finger can help you identify trends and trading opportunities clearly. The finger points to the open position signal, and the discoloration line is confirmed by the trend. If you are a day trader, you can choose to trade during a period of active trading, referring to the discoloration line as the basis for the next order, finger signal as a filter. If you are a trend trader, you can choose a period above H1, wait for the appearance of the finger signal in the key price area, and enter
Owl Smart Levels MT5
Sergey Ermolov
4.47 (36)
Versión MT4  |  FAQ El Indicador Owl Smart Levels es un sistema comercial completo dentro de un indicador que incluye herramientas de análisis de mercado tan populares como los fractales avanzados de Bill Williams , Valable ZigZag que construye la estructura de onda correcta del mercado y los niveles de Fibonacci que marcan los niveles exactos de entrada. en el mercado y lugares para tomar ganancias. Descripción detallada de la estrategia Instrucciones para trabajar con el indicador Asesor de c
Noize Absorption Index - is the manual trading system that measures the difference of pressure between bears forces and bulls forces. Green line - is a noize free index that showing curent situation. Zero value of index shows totally choppy/flat market.Values above zero level shows how powerfull bullish wave is and values below zero measures bearish forces.Up arrow appears on bearish market when it's ready to reverse, dn arrow appears on weak bullish market, as a result of reverse expectation.
Este indicador le mostrará los valores TP y SL (en esa moneda) que ya configuró para cada pedido en los gráficos (cerrados a la línea de transacción/pedido) que lo ayudarán mucho a estimar sus ganancias y pérdidas para cada pedido. Y también te muestra los valores de PIP. el formato que se muestra es "Valores de moneda de nuestros valores de ganancias o pérdidas / PIP". El valor TP se mostrará en color verde y el valor SL se mostrará en color rojo. Para cualquier pregunta o más información, n
How to use Pair Trading Station Pair Trading Station is recommended for H1 time frame and you can use it for any currency pairs. To generate buy and sell signal, follow few steps below to apply Pair Trading Station to your MetaTrader terminal. When you load Pair Trading Station on your chart, Pair Trading station will assess available historical data in your MetaTrader platforms for each currency pair. On your chart, the amount of historical data available will be displayed for each currency pai
Banana Binary MT5 Signal
Nirundorn Promphao
1 (1)
Promotion $66 lifetime for you. The principle of this indicator is very simple: detecting the trend with Moving Average, then monitoring the return point of graph by using the crossing of Stochastic Oscillator and finally predicting BUY and SELL signal with arrows, alerts and notifications. The parameters are fixed and automatically calculated on each time frame. Example: If you install indicator on EURUSD, timeframe M5: the indicator will detect the main trend with the Moving Average on this
Double HMA MTF for MT5
Pavel Zamoshnikov
5 (2)
This is an advanced multi-timeframe version of the popular Hull Moving Average (HMA) Features Two lines of the Hull indicator of different timeframes on the same chart. The HMA line of the higher timeframe defines the trend, and the HMA line of the current timeframe defines the short-term price movements. A graphical panel with HMA indicator data from all timeframes at the same time . If the HMA switched its direction on any timeframe, the panel displays a question or exclamation mark with a tex
Upgraded - Stars added to indentify Areas you can scale in to compound on your entry  when buying or selling version 2.4 Upgraded Notifications and alerts added version 2.3 *The indicator is suitable for all pairs fromm  Deriv pairs (Vix,jump,boom & crash indices) , Currencies, cryptos , stocks(USA100, USA30 ), and metals like gold etc. How does it work? Increasing the period make it more stable hence will only focus on important entry points However  lowering the period will mean the indica
This is diamond! Diamond Pattern is based on Read The Market(RTM) concepts. The purpose of this model is to face the big players of the market (financial institutions and banks), As you know in financial markets, big traders try to fool small traders, but RTM prevent traders from getting trapped. This style is formed in terms of price candles and presented according to market supply and demand areas and no price oscillator is used in it. RTM concepts are very suitable for all kinds of inves
¡El nivel Premium es un indicador único con más del 80% de precisión de predicciones correctas! ¡Este indicador ha sido probado por los mejores especialistas en comercio durante más de dos meses! ¡El indicador del autor no lo encontrarás en ningún otro lugar! ¡A partir de las capturas de pantalla, puede ver por sí mismo la precisión de esta herramienta! 1 es ideal para operar con opciones binarias con un tiempo de vencimiento de 1 vela. 2 funciona en todos los pares de divisas, accion
Tool for Identifying Potential Reversal Points and Trend Direction This tool is excellent for identifying potential reversal points and trend direction in the market. It works well with confirming indicators such as MACD, Stochastic, RSI - standard indicators available on all MT5 platforms. Together with them, it forms a reliable strategy. In the settings, you can adjust the channel distance and period. It is recommended to enter a trade when the signal line crosses the upper channel bounda
Your Trend Friend
Luigi Nunes Labigalini
The trend is your friend! Look at the color of the indicator and trade on that direction. It does not  repaint. After each candle is closed, that's the color of the trend. You can focus on shorter faster trends or major trends, just test what's most suitable for the symbol and timeframe you trade. Simply change the "Length" parameter and the indicator will automatically adapt. You can also change the color, thickness and style of the lines. Download and give it a try! There are big movements
QM Pattern Scanner MT5
Reza Aghajanpour
5 (3)
QM (Quasimodo) Pattern is based on Read The Market(RTM) concepts. The purpose of this model is to face the big players of the market (financial institutions and banks), As you know in financial markets, big traders try to fool small traders, but RTM prevent traders from getting trapped. This style is formed in terms of price candles and presented according to market supply and demand areas and no price oscillator is used in it. RTM concepts are very suitable for all kinds of investments, includi
VR Cub MT 5
Vladimir Pastushak
VR Cub es un indicador para obtener puntos de entrada de alta calidad. El indicador fue desarrollado para facilitar los cálculos matemáticos y simplificar la búsqueda de puntos de entrada a una posición. La estrategia comercial para la cual se diseñó el indicador ha demostrado su eficacia durante muchos años. La simplicidad de la estrategia comercial es su gran ventaja, que permite que incluso los operadores novatos negocien con éxito con ella. VR Cub calcula los puntos de apertura de posiciones
PipFinite Exit EDGE MT5
Karlo Wilson Vendiola
4.89 (35)
Did You Have A Profitable Trade But Suddenly Reversed? In a solid strategy, exiting a trade is equally important as entering. Exit EDGE helps maximize your current trade profit and avoid turning winning trades to losers. Never Miss An Exit Signal Again Monitor all pairs and timeframes in just 1 chart www.mql5.com/en/blogs/post/726558 How To Trade You can close your open trades as soon as you receive a signal Close your Buy orders if you receive an Exit Buy Signal. Close your Sell orde
Ante todo, vale la pena enfatizar que esta Herramienta de Trading es un Indicador No Repintado, No Redibujado y No Retrasado, lo que la hace ideal para el trading profesional. El Indicador de Conceptos de Acción del Precio Inteligente es una herramienta muy potente tanto para traders nuevos como experimentados. Combina más de 20 indicadores útiles en uno solo, combinando ideas avanzadas de trading como el Análisis del Trader del Círculo Interior y Estrategias de Trading de Conceptos de Dinero
The standard Bollinger Bands indicator has been improved by integrating additional indications from the Standard Deviation indicator (StdDev), which gives an additional filter for confirming trading signals. In addition, the color of the indicator's lines shows the beginning of a trend, its development and exhaustion. This indicator has a signal block that notifies the trader of the beginning of the trend on any time frame to which it is attached. Settings Type of messages - select the type of
Easy to use buy and sell signals with arrows. Non Repainting indicator. Non Lagging indicator. Down Arrows indicate sell and up arrows indicate buys. Works on any market and on any time frames. Arrow colors can be changed to match chart colors. Audible alerts. Periods can be changed to phase out false signals. Please remember to follow the trend like with any indicator.
Wave Trend MT5
Diego Arribas Lopez
Versión MT4   Wave Trend   MT5 Wave Trend es un oscilador que ayuda a identificar de manera extremadamente precisa las reversiones del mercado. El oscilador está por encima del nivel de sobrecompra y un cruce hacia abajo de la MA rápida a la lenta generalmente indica una buena señal de VENTA. Si los osciladores están por debajo del nivel de sobreventa y la media móvil rápida cruza la media móvil más lenta, por lo general indica una buena señal de COMPRA. El indicador Wave Trend también se puede
- This is the exact conversion from TradingView: "Support/Resistance" By "BarsStallone". - This indicator lets you read the buffers for R/S values. - This is a non-repaint and light processing load indicator. - This is not a multi time frame indicator If you want the multi time frame version you should create a personal order and I deliver two files that you need them both to have the multi time frame indicator running on your system. - The MT4 version of the indicator is not light load from pr
Trend Side - un indicador técnico para determinar la tendencia. Es un conjunto de varias estrategias comerciales completas. El indicador utiliza un sistema avanzado de filtrado de tendencias, tiene un panel estadístico, calcula los niveles de entrada y salida, y calcula el nivel de Trailing Stop dinámico. Apto para cualquier tipo de símbolos, nunca redibuja sus señales y resultados. Una herramienta integral para el comercio de tendencias profesional. El conjunto del indicador Trend Side tambi
An indicator of pattern #31 ("Long Island") from Encyclopedia of Chart Patterns by Thomas N. Bulkowski. The second gap is in the opposite direction. Parameters: Alerts - show alert when an arrow appears   Push - send a push notification when an arrow appears (requires configuration in the terminal) GapSize - minimum gap size in points ArrowType - a symbol from 1 to 17 ArrowVShift - vertical shift of arrows in points   ShowLevels - show levels ColUp - color of an upward line ColDn - color of a
Alpha Trend MT5
Evgeny Belyaev
5 (1)
Alpha Trend MT5 is a trend indicator for the MetaTrader 5 platform; it has been developed by a group of professional traders. The Alpha Trend MT5 indicator finds the most probable tendency reversal points, which allows making trades at the very beginning of a trend. This indicator features notifications, which are generated whenever a new signal appears (alert, email, push-notification). This allows you to open a position in a timely manner. Alpha Trend does not redraw, which makes it possible t
To get access to MT4 version please click here . - This is the exact conversion from TradingView: "Stochastic Momentum Index" By "UCSgears". - This is a popular version of stochastic oscillator on tradingview. - This is a light-load processing and non-repaint indicator. - Buffers are available for the lines on chart. - You can message in private chat for further changes you need. Thanks for downloading
Renko Gold
Ignacio Agustin Mene Franco
Renko Gold !  indica clara mente los pisos y techos donde va de 4 lineas ,  la linea de abajo que marca el piso en color verde confirmando con la linea mas fina aclara la entrada en compra ,  lo mismo es para la venta , la linea de arriba marca el techo y la mas fina de color  rojo marca la venta ,  este indicador sirve para todas las temporalidades !  Para los mercados de Forex y Indices sinteticos ! Tambien sirve para los mercados de crypto !  Buen Profit! World Inversor. 
Volality Index scalper indicator  Meant for Volality pairs such as Volality 10, 25, 50, 75 and 100 The indicator works on all timeframes from the 1 minute to the monthly timeframe the indicator is non repaint the indicator has 3 entry settings 1 color change on zero cross 2 color change on slope change 3 color change on signal line cross Orange line is your sell signal Blue line is your buy signal.
Automated Trendlines MT5
Georgios Kalomoiropoulos
Las líneas de tendencia son la herramienta más esencial del análisis técnico en el comercio de divisas. Desafortunadamente, la mayoría de los comerciantes no los dibujan correctamente. El indicador de líneas de tendencia automatizadas es una herramienta profesional para comerciantes serios que lo ayuda a visualizar el movimiento de tendencia de los mercados. Hay dos tipos de Trendlines Bullish Trendlines y Bearish Trendlines. En la tendencia alcista, la línea de tendencia de Forex se dib
The best time to trade Using this Indicator is when the time reach exactly hour,half,45 minutes,15 minutes and sometimes 5 minutes.. This indicators is helpful to those who trade boom and crash indecies.How to read this indicator first you'll see Blue allow and Red allow all these allows used to indicate or to detect the spike which will happen so the allow happens soon before the spike happen.This indicator works properly only in boom and crash trading thing which you have to consider when
Los compradores de este producto también adquieren
Primero que todo, vale la pena enfatizar que este Sistema de Trading es un Indicador No Repintado, No Redibujado y No Retrasado, lo que lo hace ideal tanto para el trading manual como para el automatizado. El "Sistema de Trading Inteligente MT5" es una solución completa de trading diseñada para traders nuevos y experimentados. Combina más de 10 indicadores premium y presenta más de 7 estrategias de trading robustas, lo que lo convierte en una opción versátil para diversas condiciones del merca
Quantum Trend Sniper
Bogdan Ion Puscasu
5 (37)
Introduciendo       Indicador Quantum Trend Sniper   , el innovador indicador MQL5 que está transformando la forma en que identificas y negocias los cambios de tendencia. Desarrollado por un equipo de comerciantes experimentados con experiencia comercial de más de 13 años,       Indicador de francotirador de tendencia cuántica       está diseñado para impulsar su viaje comercial a nuevas alturas con su forma innovadora de identificar cambios de tendencia con una precisión extremadamente alta.
FX Volume MT5
Daniel Stein
4.94 (17)
Obtenga su actualización diaria del mercado con detalles y capturas de pantalla a través de nuestro Morning Briefing aquí en mql5 y en Telegram ! FX Volume es el PRIMER y ÚNICO indicador de volumen que proporciona una visión REAL del sentimiento del mercado desde el punto de vista de un bróker. Proporciona una visión impresionante de cómo los participantes institucionales del mercado, como los brokers, están posicionados en el mercado Forex, mucho más rápido que los informes COT. Ver esta info
FX Power MT5 NG
Daniel Stein
5 (4)
Obtenga su actualización diaria del mercado con detalles y capturas de pantalla a través de nuestro Morning Briefing aquí en mql5 y en Telegram ! FX Power MT5 NG es la nueva generación de nuestro popular medidor de fuerza de divisas, FX Power. ¿Y qué ofrece este medidor de fuerza de nueva generación? Todo lo que le encantaba del FX Power original PLUS Análisis de fuerza de ORO/XAU Resultados de cálculo aún más precisos Períodos de análisis configurables individualmente Límite de cálculo persona
Advanced Supply Demand MT5
Bernhard Schweigert
4.53 (15)
¡Actualmente con 33% de descuento! ¡La mejor solución para cualquier tráder principiante o experto! Este indicador es una herramienta comercial única, de alta calidad y asequible, porque incorpora una serie de características patentadas y una nueva fórmula. Con esta actualización, podrá mostrar zonas de doble marco temporal. No solo podrá mostrar un marco temporal más alto, sino también mostrar ambos, el marco temporal del gráfico MÁS el marco temporal más alto: MOSTRANDO ZONAS ANIDADAS. A todos
RelicusRoad Pro MT5
Relicus LLC
4.81 (21)
Ahora $ 147 (aumentando a $ 499 después de algunas actualizaciones) - Cuentas ilimitadas (PC o Mac) Manual de usuario de RelicusRoad + Videos de capacitación + Acceso al grupo privado de Discord + Estado VIP UNA NUEVA MANERA DE VER EL MERCADO RelicusRoad es el indicador comercial más poderoso del mundo para divisas, futuros, criptomonedas, acciones e índices, y brinda a los comerciantes toda la información y las herramientas que necesitan para mantenerse rentables. Brindamos análisis téc
XQ Indicator MetaTrader 5
Marzena Maria Szmit
5 (1)
Step into the realm of Forex trading with confidence and precision using XQ, a cutting-edge Forex indicator designed to elevate your trading game to unprecedented heights. Whether you're a seasoned trader or just stepping into the world of currency exchange, XQ Forex Indicator empowers you with the insights and signals needed to make informed trading decisions. The signal conditions are a combination of three indicators, and XQ Forex Indicator only display  medium and long-term trends . The ind
The Volume by Price Indicator for MetaTrader 5 features Volume Profile and Market Profile TPO (Time Price Opportunity). Get valuable insights out of currencies, equities and commodities data. Gain an edge trading financial markets. Volume and TPO histogram bar and line charts. Volume Footprint charts. TPO letter and block marker charts including split structures. Versatile segmentation and compositing methods. Static, dynamic and flexible ranges with relative and/or absolute visualizations. Lay
Este es un genial indicador para MT5 que ofrece señales precisas para entrar en una transacción sin redibujar. Se puede aplicar a cualquier activo financiero: fórex, criptomonedas, metales, acciones, índices. Nos dará valoraciones bastante precisas y nos dirá cuándo es mejor abrir y cerra una transacción. Eche un vistazo  al vídeo  (6:22), ¡contiene un ejemplo de procesamiento de una sola señal que ha amortizado el indicador! La mayoría de los tráders mejoran sus resultados comerciales durante l
Blahtech Supply Demand MT5
Blahtech Limited
4.57 (14)
Was: $299  Now: $99   Supply Demand uses previous price action to identify potential imbalances between buyers and sellers. The key is to identify the better odds zones, not just the untouched ones. Blahtech Supply Demand indicator delivers functionality previously unavailable on any trading platform. This 4-in-1 indicator not only highlights the higher probability zones using a multi-criteria strength engine, but also combines it with multi-timeframe trend analysis, previously confirmed swings
El Indicador de Cuadrados de Gann es una herramienta poderosa de análisis de mercado basada en el artículo "Fórmula Matemática para Predicciones de Mercado" escrito por W.D. Gann, que se basa en conceptos matemáticos para el análisis. Incorpora elementos de las técnicas de Gann relacionadas con los cuadrados de 144, 90 y 52, así como el cuadrado de 9. Además, incluye el método del  sobre cómo combinar el cuadrado de 9 con canales y patrones de estrellas. Manual del Usuario y Modo de Uso: Antes d
Introduciendo       Quantum Breakout PRO   , el innovador indicador MQL5 que está transformando la forma en que comercia con Breakout Zones. Desarrollado por un equipo de comerciantes experimentados con experiencia comercial de más de 13 años,       Desglose cuántico PRO       está diseñado para impulsar su viaje comercial a nuevas alturas con su innovadora y dinámica estrategia de zona de ruptura. El indicador de ruptura cuántica le dará flechas de señal en las zonas de ruptura con 5 zonas
Gartley Hunter Multi
Siarhei Vashchylka
5 (5)
Gartley Hunter Multi - An indicator for searching for harmonic patterns simultaneously on dozens of trading instruments and on all classic timeframes: (m1, m5, m15, m30, H1, H4, D1, Wk, Mn). Manual (Be sure to read before purchasing) | Version for MT4 Advantages 1. Patterns: Gartley, Butterfly, Shark, Crab. Bat, Alternate Bat, Deep Crab, Cypher 2. Simultaneous search for patterns on dozens of trading instruments and on all classic timeframes 3. Search for patterns of all possible sizes. Fr
Was: $249  Now: $99   Market Profile defines a number of day types that can help the trader to determine market behaviour. A key feature is the Value Area, representing the range of price action where 70% of trading took place. Understanding the Value Area can give traders valuable insight into market direction and establish the higher odds trade. It is an excellent addition to any system you may be using. Inspired by Jim Dalton’s book “Mind Over Markets”, this indicator is designed to suit the
TPSpro TRENDPRO  - is a trend indicator that automatically analyzes the market and provides information about the trend and each of its changes, as well as giving signals for entering trades without redrawing! The indicator uses each candle, analyzing them separately. referring to different impulses - up or down impulse. Exact entry points into transactions for currencies, crypto, metals, stocks, indices!  -  Version MT4                  DETAILED DESCRIPTION        /       TRADING SETUPS       
Black Dragon indicator mt5
Ramil Minniakhmetov
4.82 (56)
El indicador de detección de tendencias complementará cualquier estrategia y también se puede utilizar como una herramienta independiente. Ventajas Fácil de usar, no sobrecarga el gráfico con información innecesaria; Puede usarse como filtro para cualquier estrategia; Tiene niveles integrados de soporte y resistencia dinámicos, que se pueden usar tanto para obtener ganancias como para establecer límites de pérdidas; El indicador no cambia de color después de que se cierra la vela;  Funciona
Golden Spikes Detector
Batsirayi L Marango
5 (1)
Golden Spikes Detector Este indicador se basa en una estrategia avanzada principalmente para negociar picos en índices de auge y caída. Se implementaron algoritmos complejos para detectar únicamente entradas de alta probabilidad. Alerta sobre posibles entradas de Compra y Venta. Para negociar picos en el corredor Deriv o Binary, solo acepte las alertas Buy Boom y Sell Cash. Se optimizó para cargarse en un período de tiempo de 5 minutos, aunque se realiza un análisis de múltiples períodos de tiem
Golden Gate Algo MT5
James David Lane
4 (6)
¡40% DE DESCUENTO PARA NAVIDAD! ¡AUMENTO DE PRECIO A $250 EL 1 DE ENERO! Presentamos GoldenGate Entries: ¡Una Solución de Trading de Vanguardia! Descubre un enfoque revolucionario para el trading con GoldenGate Entries (GGE), un indicador avanzado diseñado para elevar tu experiencia de trading. GGE proporciona un conjunto completo de características para capacitar a los usuarios con precisión y confianza en sus decisiones comerciales. Pares: Cualquiera (FX - Materias primas - Acciones - A
Bill Williams Advanced
Siarhei Vashchylka
5 (3)
Bill Williams Advanced is designed for automatic chart analysis using Bill Williams' "Profitunity" system. The indicator analyzes four timeframes at once. Manual (Be sure to read before purchasing) Advantages 1. Automatically analyzes the chart using the "Profitunity" system of Bill Williams. The found signals are placed in a table in the corner of the screen. 2. Equipped with a trend filter based on the Alligator indicator. Most of the system signals are recommended to be used only accordi
TPA True Price Action indicator reveals the true price action of the market makers through 100% non-repainting signals strictly at the close of a candle! TPA shows entries and re-entries, every time the bulls are definitely stronger than the bears and vice versa. Not to confuse with red/green candles. The shift of power gets confirmed at the earliest stage and is ONE exit strategy of several. There are available now two free parts of the TPA User Guide for our customers. The first "The Basics"
TrendMaestro5
Stefano Frisetti
note: this indicator is for METATRADER4, if you want the version for METATRADER5 this is the link:  https://www.mql5.com/it/market/product/108106 TRENDMAESTRO recognizes a new TREND in the bud, he never makes mistakes. The certainty of identifying a new TREND is priceless. DESCRIPTION TRENDMAESTRO identifies a new TREND in the bud, this indicator examines the volatility, volumes and momentum to identify the moment in which there is an explosion of one or more of these data and therefore the mome
Quantum Heiken Ashi PRO MT5
Bogdan Ion Puscasu
4.5 (8)
Presentamos el   Quantum Heiken Ashi PRO Diseñadas para brindar información clara sobre las tendencias del mercado, las velas Heiken Ashi son reconocidas por su capacidad para filtrar el ruido y eliminar las señales falsas. Diga adiós a las confusas fluctuaciones de precios y dé la bienvenida a una representación gráfica más fluida y confiable. Lo que hace que Quantum Heiken Ashi PRO sea realmente único es su fórmula innovadora, que transforma los datos de velas tradicionales en barras de colore
Trade Assistant MetaTrader System  — a multi-timeframe system that is based on three standard indicators:   Stochastic oscillator ,   RSI   (Relative Strength Index), and   CCI   (Commodity Channel Index). It displays current trend directions for M1, M5, M15, M30, H1, H4, D1, W1, and MN1 timeframes. When you follow such an indicator you have a clear picture of the trends across all important timeframes. It doesn't matter which timeframe you attach this indicator to. Input parameters CheckCandl
Professional Scalping Tool on Deriv Attention! The indicator will be sold in limited quantities!!! Description: This trading indicator is designed for professional traders focused on scalping. Designed with the market in mind, it provides highly accurate spike trading signals. It works on the M1 timeframe and supports the following symbols: Boom 300 Index, Boom 500 Index, Boom 1000 Index, Crash 300 Index, Crash 500 Index, Crash 1000 Index. Functional Features: - Direction: - Trading is ca
A key element in trading is zones or levels from which decisions to buy or sell a trading instrument are made. Despite attempts by major players to conceal their presence in the market, they inevitably leave traces. Our task was to learn how to identify these traces and interpret them correctly. Reversal First Impulse levels (RFI)   -  Version MT4                  INSTRUCTIONS                 RUS                 ENG                         R ecommended to use with an indicator   -  TREND PRO  
Gartley Hunter MT5
Siarhei Vashchylka
5 (13)
Gartley Hunter - An indicator for searching for harmonic patterns (Gartley patterns) and their projections. The indicator is equipped with a system of alerts and push notifications. Manual (Be sure to read before purchasing) | Version for MT4 Advantages 1. 12 harmonic patterns: 7 classical and 5 exotic. New patterns will be added as the indicator develops. 2. Constant automatic search for harmonic patterns. The indicator is capable of finding from the smallest to the largest patterns. 3. Autom
IVISTscalp5
Vadym Zhukovskyi
5 (3)
Te presentamos el indicador iVISTscalp5, que no solo es único sino también efectivo en operaciones de trading. Este indicador se basa en datos temporales y es el resultado de muchos años de experiencia y análisis profundo de los mercados financieros. El indicador iVISTscalp5 es una excelente herramienta para el trading manual. La conveniencia, simplicidad y visualización, toda la complejidad está oculta en su interior. Hemos simplificado al máximo la configuración y uso del indicador iVISTscalp5
VTrende Pro
Andrii Diachenko
5 (1)
VTrende Pro - MTF indicator for trend trading with a display panel for MT5 *** Videos can be translated into any language using subtitles (video language - Russian) Although the signals of the VTrende Pro indicator can be used as signals of a full-fledged trading system, it is recommended to use them in conjunction with the Bill Williams TS. VTrende Pro is an extended version of the VTrende indicator. Difference between Pro version and VTrende: - Time zones - Signal V - signal 1-2 waves
PZ Swing Trading MT5
PZ TRADING SLU
5 (4)
Swing Trading es el primer indicador diseñado para detectar oscilaciones en la dirección de la tendencia y posibles oscilaciones de reversión. Utiliza el enfoque de intercambio de línea de base, ampliamente descrito en la literatura comercial. El indicador estudia varios vectores de precios y tiempos para rastrear la dirección de la tendencia agregada y detecta situaciones en las que el mercado está sobrevendido o sobrecomprado y listo para corregir. [ Guía de instalación | Guía de actualización
SMCpro
Arief
5 (1)
SMCpro MT5  Original Price  $440   ---  Currently Price  40% OFF  ( for unlimited use ) Hello World! Introducing.. SMCpro tool and Indicator for  MetaTrader 5 , a cutting-edge feature designed to revolutionize your trading experience. With innovative ICT Smart Money Concept, you gain unparalleled insight into market dynamics, empowering you to make informed trading decisions like never before. Built on the foundation of advanced algorithms and real-time data analysis, SMCpro tool and Indicat
Otros productos de este autor
El registro de efectivo de dyj se dedica a los indicadores técnicos de dyj. Cuando el mercado es fuerte Esta es la oportunidad y el comercio en un mercado seguro. Ganancias consistentes con el tiempo de negociación seguro. EA utiliza el modo de pedido único para minimizar el volumen de Negocios y maximizar la estrategia de algoritmo de liquidación de beneficios. No hay comercio de red. No hay arbitraje. No hay setos. No hay martingale. Please download the setting file and the PDF file of t
StrongCurrency
Daying Cao
5 (1)
This StrongCurrency is a complete trading system based on a variety of technical indicators, moving averages and pivots. Each of those elements can be assessed in defined rules and coefficients (depending on the indicator) providing limitless optimization scenarios for the StrongCurrency. In order to work the StrongCurrency creates a trend strength and entry point signal list display by evaluating these data, that takes data from all symbols. It extrapolates all the information in order to get t
DYJ Follow Me   is an EA that follows the virtual transaction record of any dyj indicator to actually open and close positions. It can display the name and status of the indicator of the single signal source; At present, it is only the   DYJ SignalSourceOfWPR MT5   indicator, and more indicators will be expanded in the future. It can receive real-time trend direction of indicator. It can receive the latest admission time of the indicator. It can receive the latest admission price of
El plan de retiro DYJ es UN sistema de transacción de punto de inflexión de tendencia que se puede abrir y cerrar en UN punto de inflexión de tendencia. Cualquier símbolo aplicable a cualquier intermediario: divisas o cualquier otra Raza ( Por ejemplo, el Volatility Index de un corredor.) Muestra los beneficios básicos de TP, SL, espaciado de cuadrícula y TPSL, así como El margen de transacción más bajo, y puede mostrar los beneficios de cada Raza después de la apertura, y cada variedad tiene
The  DYJ WPR - SignalSource is based on  WPR  indicator. It can be used for any currency pair and timeframe. The  WPR  recommends  Indicator values ranging between 80 and 100% indicate that the market is oversold. Indicator values ranging between 0 and 20% indicate that the market is overbought. The entry signal of this indicator is a turning point in the trend. The indicator uses analog trading technology, Provide you with indicators to evaluate the overall profit of the opening signal and c
This QuickClose help you to close all orders having profit immediately with only ONE CLICK, its work is very fast. You can choose which symbol you want or close all symbols so it will helpful for you in your trading to manage trading faster. This EA can quick close all Buy and Sell Orders by a selected symbol or total. This SymbolButton is designed for closing orders. There is available Manual and Automatic closing functions. Automatic closing function will close the orders according the paramet
Professional traders know that a reversal in market price is the best entry points to trade. The trend changes K line state changes the most obvious. The SoarSignal is good to identify these changes, because we have incorporated the KDJ indicators. It is the closest to the K line state of the indicators. The two lines of KDJ Winner move within a range of 0 and 100. Values above 80 are considered to be in overbought territory and indicate that a reversal in price is possible. Values below 20 are
PowerSignal
Daying Cao
5 (1)
Este PowerSignal es un sistema comercial completo basado en ATR de indicadores técnicos. Estos indicadores registrarán el estado actual de cada POWERTREND en cada marco de tiempo y par de divisas analizados. El PowerSignal crea una visualización de la lista de señales de punto de entrada y fuerza de tendencia mediante la evaluación de estos datos. Si hay una coincidencia total en cualquier par, aparecerá una alerta indicando tal caso. Los datos de la lista incluyen Símbolo, M5-MN1, BuyPercent,
This indicator shows the crossing between two moving averages, a slower and faster moving average. Signal show alert pop-up, when MA1 crosses above the MA2. Signal show alert pop-up, when MA1 crosses below the MA2. Inputs Value Fast MA Setup Period = 5 - period of Faster Moving Average (value 5). Mode = SMA - type of Moving Average (SMA, EMA, SMMA, LWMA). Price = Close - type of price (Close, Open, Low, High, Median, Typical, Weighted). Slow MA Setup Period = 10 - period of Slower MA (value 10
This EA is based on the classical trend-following system of opening the positions. The EA is based on DYJ TwoMACrossAlarm and ATR and CCI indicator. It uses two moving averages. The EA uses dynamic allocation MA period. The MA1 and MA2 period is the Fibonacci sequence, such as 5.8 or 13.21 or 21.34 or...; EA Entry Rules: Go long when fast MA1 crosses above the slow MA2 and CCI crosses above the zero line; Go short when fast MA1 crosses below the slow MA2 and CCI crosses below the zero line; the
DYJ news foreign exchange factory es El índice básico de análisis de Mercado para herramientas de comercio de calendario y eventos macroeconómicos. Aquí puede encontrar noticias e indicadores financieros para la economía más grande del mundo: desde los estados unidos y la ue hasta Australia y japón, hay nueve economías que involucran más de 60 pares de monedas. Recopilar más de 800 indicadores macroeconómicos y eventos de Fuentes públicas en tiempo real. Cada indicador tiene valores histórico
This indicator shows the crossing between three moving averages (slower, middle and faster ones). When fast MA crosses up middle MA and middle MA crosses up slow MA, the bullish alert is issued. When fast MA crosses down middle MA and middle MA crosses down slow MA, the bearish alert is issued. Signals to close buy positions are generated if fast MA crosses middle MA downwards, signals to close sell positions are generated if fast MA crosses middle MA upwards. Inputs Fast MA Setup MAPeriod1 =
The Expert Advisor is based on three Moving Average indicators. ThreeMACross is based on the following idea: crossing of three Moving Average lines (Fast, Middle and slow ones) is used as a signal for opening and closing a position together. Go Long when Fast MA (MA1) crosses above Middle MA (MA2), and Middle MA (MA2) crosses above Slow MA (MA3). Go Short when Fast MA (MA1) crosses below Middle MA (MA2), and Middle MA (MA2) crosses below Slow MA (MA3). Signals to close buy positions are generate
The RiseTrading is a unique High quality and easy to use and affordable trading tool because we have incorporated a number of proprietary features and PowerSignal and MACD and Stochastic indicators. The main advantages of the trend trading strategy used by the Expert Advisor are opening positions only in the direction of a trend, ability for the long-term retention of profitable positions allowing users to achieve good combinations of profit/loss distributions. That can work on a real account at
DYJ stock controller es UN sistema de negociación de acciones en toda la moneda Muestra los valores aleatorios de cada par de monedas de M1 a MN Cuando El valor de Stoch de UN ciclo alcanza El área de sobreventa y El área de sobreventa, hay consejos de color, Puede hacer El trato correcto basado en esta información Cree y guarde una plantilla de indicadores de inventario denominada " controlador de inventario DYJ". Cuando hace clic en El área de sobrecompra o en El área de sobrecompra con El
The DYJ SoarTrading is based on SoarSignal indicator. It can be used for any currency pair and timeframe. Signals to buy are generated when SoarSignal has crossed oversold downwards, reached oversold and then crossed back up through oversold. Signals to sell are generated when SoarSignal has crossed overbought upwards, reached overbought, and then crossed back down through overbought. Close a trade when SoarSignal reaches the opposite side ( overbought for long order, oversold for short order).
DYJ Sharp advanced algorithm that detects new trends and current trend continuations for use as an entry and exit strategy. The strategy display the SHARP trend demarcation area. This SHARP area has high HighLine and low LowLine. Falling of high below HighLine of SHARP and then falling of close below LowLine of SHARP can be interpreted as a signal to sell. Rising of close above HighLine of SHARP and then rising of low above LowLine of SHARP can be interpreted as a signal to buy. The signal for e
DYJ TRENDWAVE features an advanced algorithm that detects new trends and current trend continuations for use as an entry strategy. DYJ TRENDWAVE's volatility is based on the power of buyers and sellers, it grabs total body size of candles and identifies the battle between buyers and sellers as a percentage of the total volume, like Sellers: (-)100% and Buyers: (+)100%. This information can be used for any entry and exit strategy. For bullish/Long Pin bar it is below the price line, for bearish/S
DYJTRENDWAVE features an advanced algorithm that detects new trends and current trend continuations for use as an entry strategy. DYJTRENDWAVE's volatility is based on the power of buyers and sellers, it grabs total body size of candles and identifies the battle between buyers and sellers as a percentage of the total volume, like Sellers: (-)100% and Buyers: (+)100%. This information can be used for any entry and exit strategy. For bullish/Long Pin bar it is below the price line, for bearish/Sho
Dyj revende es un consultor experto totalmente automatizado. El filtro de índice aleatorio se utiliza para entradas. Los consultores necesitan tipos de cuentas de cobertura y ECN. Las pérdidas de pedidos serán liberadas bajo fianza por el juego y se convertirán en ganancias. Si la dirección del pedido es incorrecta. Puede desactivar la política de juego en cualquier momento. Recomendaciones generales Se recomienda una cuenta ECN con una diferencia de puntos entre 8 y 11 y una diferencia de punt
DYJ T3ModeMA se basa en el algoritmo T3. El algoritmo T3 se introdujo en el campo del análisis técnico en el artículo “Better Moving Averages”, publicado en la revista estadounidense TASC. T3 suaviza las series de precios al tiempo que reduce el retraso en el sistema de seguimiento de tendencias. El tamaño de la columna del indicador determina la señal de entrada, y cuando el tamaño de la columna se acerca a 0, es el punto de inflexión de la tendencia. El indicador utiliza técnicas de negoci
Dyj Long Term Strategy Ea es un sistema de comercio a largo plazo Buscamos el precio más bajo en las velas como el comienzo de una tendencia larga, buscando el precio más alto como el comienzo de una tendencia corta, vamos a mantener posiciones durante el período más largo, y obtener el máximo beneficio. Cuando la dirección del pedido es incorrecta, la estrategia puede hacer que el pedido sea rentable. EA se ejecuta solo en cualquier ciclo de UN gráfico de moneda a moneda Signal URL INPUT In
The DYJBands opens and closes positions using Bollinger Bands signals: It performs trades after a price rebound from the borderlines of the indicator. It has the option to close positions by an opposite signal, by take profit and stop loss, move a trade to breakeven upon reaching the central Bollinger band or after a certain price movement. By default, the EA is configured for trading the GBPUSD currency pair on the H1 timeframe. Also, settings for the EURUSD, USDJPY, USDCAD and XAUUSD currency
The DYJ MacdSto is a unique High quality and easy to use and affordable trading tool because we have incorporated a number of proprietary features and MACD and Stochastic and RSI and ADX indicators. The main advantages of the trend trading strategy used by the Expert Advisor are opening positions only in the direction of a trend, ability for the long-term retention of profitable positions allowing users to achieve good combinations of profit/loss distributions. DYJ MacdSto EA uses MACD and Stoch
This StrongCurrency is a complete trading system based on a variety of technical indicators, moving averages and pivots. Each of those elements can be assessed in defined rules and coefficients (depending on the indicator) providing limitless optimization scenarios for the StrongCurrency. In order to work the StrongCurrency creates a trend strength and entry point signal list display by evaluating these data, that takes data from all symbols. It extrapolates all the information in order to get t
The DYJ TrendPending EA tracks the new change of price of the currency pair and opens trades in case of a price low and high from the main movement in the direction of the trend. So EA uses the least risky grid and Add lots. And can attach a positive and reverse pending order. The PositivePending orders can reduce the number of grids and Add lots,  while ReversePending orders reduce the loss of orders . For more convenient search, the working timeframe has been added to inputs (Work timeframe).
This is a multi-currency and multi-strategy EA. This EA is to create one or more polling trading strategies in a transaction. In the polling mode, the strategies filter a trend-free range market environment and trades are placed in the opposite direction at the edges of the range. With an additional main trend filter in the trend-following mode, the DYJ's ArtOfForexWar can also trade pull-backs during trends in the trend of loss. The winning rate is more than 95% within three orders or three cl
Dyj scapingburg Ea es un consultor experto totalmente automatizado. El filtro de algoritmo Burg se utiliza para entradas. Los consultores necesitan tipos de cuentas de cobertura y ECN. Las pérdidas de pedidos serán liberadas bajo fianza por el juego y se convertirán en ganancias. Si la dirección del pedido es incorrecta. Puede desactivar la política de juego en cualquier momento. Recomendaciones generales Se recomienda una cuenta ECN con una diferencia de puntos entre 8 y 11 y una diferencia de
DYJ ArtOfMakingMoney attempts to gauge bullish and bearish forces in the market by using two separate measures, one for each type of directional pressure. The  EA's BearsIndex  attempts to measure the market's appetite for lower prices The EA's BullsIndex attempts to measure the market's appetite for higher prices Features Monitors all pairs at the same time. The EA monitors the top 35 pairs by default, but you can select less pairs if you wish. It is a multi-currency EA that can be run from a
Nuestro objetivo es brindar un servicio accesible y de calidad, permitir a los participantes del mercado, comerciantes y analistas por igual, las herramientas necesarias para tomar decisiones comerciales informadas y oportunas. El indicador de analista DYJ Trend más optimizado, altamente robusto y fácil de usar. El analista de tendencias DYJ intenta medir las fuerzas alcistas y bajistas en el mercado utilizando dos medidas separadas, una para cada tipo de presión direccional. El BearsInde
Filtro:
Marion Lancaster Dicaprio
239
Marion Lancaster Dicaprio 2021.09.07 07:21 
 

I highly recommended Dyj global for their products and customer's services. I sincerely think they are the best in the industry they will go above an beyond to make sure you get the best trading results. I have been using this service for approximately one year.

Respuesta al comentario
Versión 2.6 2021.09.18
Version 2.06 2021.09.18
Modify the bug without updating the number of signals in frame
Versión 2.5 2021.09.16
Version 2.05 2021.09.16
Modify the bug without updating the number of activity signals immediately
Versión 2.4 2021.09.16
Version 2.04 2021.09.16
Added: Add the text of a tooltip in signal frame.
Added: Activity signal of indicator from MinTimeframe to MaxTimeframe in rating signal lists
Versión 2.3 2021.09.15
Version 2.03 2021.09.14

Modify vertical distance for title in chart signal
Versión 2.2 2021.09.15
Version 2.02 2021.09.14

Added:mode of price chart indent from the right border when we receive the signal
Versión 2.1 2021.09.13
Version 2.01 2021.09.13

Added:Automatically activate the opened chart window when there is a new signal
Versión 2.0 2021.09.13
Version 2.0 2021.09.13

Added:We automatically add a signal indicator in the new chart
Added:Email and mobile push notifications
Versión 1.9 2021.09.08
Version 1.09 2021.09.08

Added:Default background color is black for Frame windows

Versión 1.8 2021.09.08
Version 1.08 2021.09.08

Added:When the search for the highest candle and lowest candle position coincide, an alarm will pop up

Added:Display the signal quantity rating of all time frames. You can click currency pairs with signal greater than 3 and time frame transactions
Versión 1.6 2021.09.06
Version 1.06 2021.08.26
Added:Find the highest and lowest candles, and can choose to display Close price or High and Low price
Versión 1.5 2021.09.05
Version 1.05 2021.08.26
Added:Horizontal solid line at the previous days highest wick and close of the candle this for both uptrend and downtrend daily candles only
Versión 1.4 2021.08.26
Version 1.04 2021.08.26
Optimize code
Versión 1.3 2021.08.25
Version 1.03 2021.08.25
Optimize code
Versión 1.2 2021.08.25
Version 1.02 2021.08.25
Optimize code
Versión 1.1 2021.08.24
Version 1.01 2021.08.24
Optimize code