AnyMA
- Indicadores
- David Gitau Gakunga
- Versión: 1.0
- Activaciones: 8
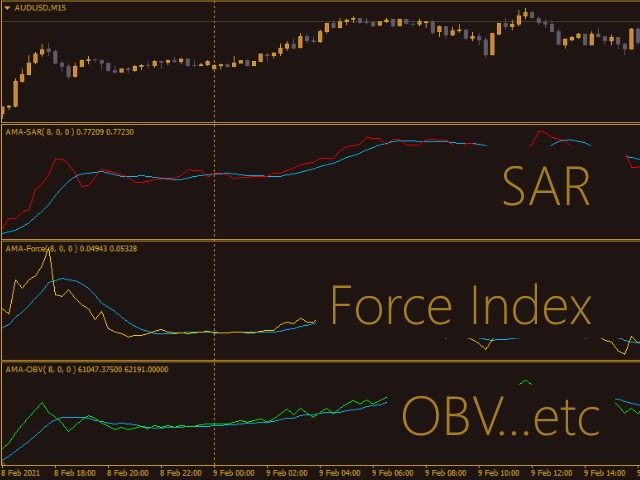
Any MA
Any Moving Average draws a moving average of *any indicator in a sub-window. Many Indicators included with MT5 are supported by default. You can add custom indicators as well.
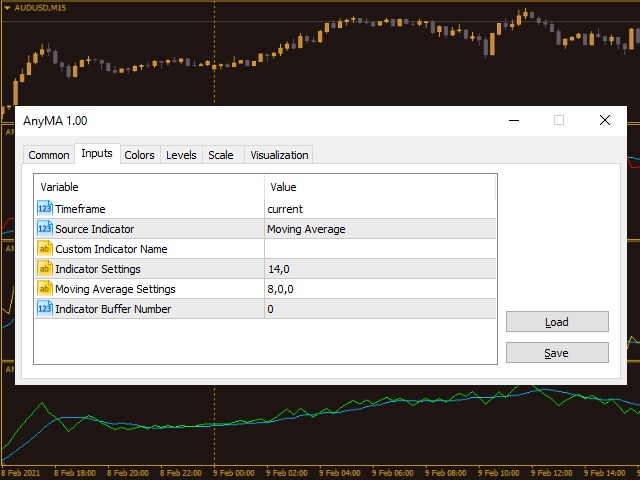
Settings
| Name | Description |
|---|---|
| Timeframe | Select timeframe for calculation |
| Source Indicator | Select Indicator |
| Custom Indicator Name | Enter Custom Indicator Name ( when Source Indicator is set to Custom) |
| Indicator Settings | Source Indicator parameters ( separated by comma ) |
| Moving Average Settings | Moving Average parameters ( separated by comma ) |
| Indicator Buffer Number | Select Source Indicator Buffer number |
Included Indicators
| Name | Alias | ________Buffers_______ | Settings |
|---|---|---|---|
| Custom | CSM | Select Appropriate Buffer Number | Custom Indicator Parameters separated by comma |
| Accelerator Oscillator | AC | 0 | |
| Accumulation/Distribution | AD | 0 | Applied Volume |
| Average Directional Index | ADX | 0 - MAIN_LINE, 1 - PLUSDI_LINE, 2 - MINUSDI_LINE | ADX Period |
| Welles Wilder's ADX | ADXW | 0 - MAIN_LINE, 1 - PLUSDI_LINE, 2 - MINUSDI_LINE | ADX Period |
| Alligator | Alligator | 0 - GATORJAW_LINE, 1 - GATORTEETH_LINE, 2 - GATORLIPS_LINE | Jaw Period, Jaw Shift, Teeth Period, Teeth Shift, Lips Period, Lips Shift, MA Method, Applied Price |
| Adaptive Moving Average | AMA | 0 | AMA period, Fast MA Period, Slow MA Period, AMA Shift, Applied Price |
| Awesome Oscillator | AO | 0 | |
| Average True Range | ATR | 0 | MA Period |
| Bears Power | BearsPower | 0 | MA Period |
| Bollinger Bands | Bands | 0 - BASE_LINE, 1 - UPPER_BAND, 2 - LOWER_BAND | Bands Period, Bands Shift, Deviation, Applied Price |
| Bulls Power | BullsPower | 0 | MA Period |
| Commodity Channel Index | CCI | 0 | MA Period, Applied Price |
| Chaikin Oscillator | CHO | 0 | Fast MA Period, Slow MA Period, MA Method, Applied Volume |
| Double Exponential Moving Average | DEMA | 0 | MA Period, MA Shift, Applied Price |
| DeMarker | DeMarker | 0 | MA Period |
| Envelopes | Envelopes | 0 - UPPER_LINE, 1 - LOWER_LINE | MA Period, MA Shift, MA Method, Applied Price, Deviation |
| Force Index | Force | 0 | MA Period, MA Method, Applied Volume |
| Fractals | Fractals | 0 - UPPER_LINE, 1 - LOWER_LINE | |
| Fractal Adaptive Moving Average | FrAMA | 0 | MA Period, MA Shift, Applied Price |
| Gator Oscillator | Gator | 0 - UPPER_HISTOGRAM, 1 - color buffer of upper histogram, 2 - LOWER_HISTOGRAM, 3 - color buffer of lower histogram | Jaw Period, Jaw Shift, Teeth Period, Teeth Shift, Lips Period, Lips Shift, MA Method, Applied Price |
| Ichimoku Kinko Hyo | Ichimoku | 0 - TENKANSEN_LINE, 1 - KIJUNSEN_LINE, 2 - SENKOUSPANA_LINE, 3 - SENKOUSPANB_LINE, 4 - CHIKOUSPAN_LINE | Tenkan Sen, Kijun Sen, Senkou Span B |
| Market Facilitation Index | BWMFI | 0 | Applied Volume |
| Momentum | Momentum | 0 | Momentum Period, Applied Price |
| Money Flow Index | MFI | 0 | MA Period, Applied Volume |
| Moving Average | MA | 0 | MA Period, MA Shift, MA Method, Applied Price |
| Moving Average of Oscillator | OsMA | 0 | Fast EMA Period, Slow EMA Period, Signal Period, Applied Price |
| Moving Average Convergence Divergence | MACD | 0 - MAIN_LINE, 1 - SIGNAL_LINE | Fast MA Period, Slow MA Period, Signal Period, Applied Price |
| On Balance Volume | OBV | 0 | Applied Volume |
| Parabolic Stop And Reverse System | SAR | 0 | Step, Maximum |
| Relative Strength Index | RSI | 0 | MA Period, Applied Price |
| Relative Vigor Index | RVI | 0 - MAIN_LNE, 1 - SIGNAL_LINE | MA Period |
| Standard Deviation | StdDev | 0 | MA Period, MA Shift, MA Method, Applied Price |
| Stochastic Oscillator | Stochastic | 0 - MAIN_LINE, 1 - SIGNAL_LINE | K Period, D Period, Slowing, MA Method, Price Field |
| Triple Exponential Moving Average | TEMA | 0 | MA Period, MA Shift, Applied Price |
| Triple Exponential Moving Averages Oscillator | TriX | 0 | MA Period, Applied Price |
| Williams' Percentage Range | WPR | 0 | Calculation Period |
| Variable Index Dynamic Average Indicator | VIDyA | 0 | Chande Momentum Period, EMA Period, MA Shift, Applied Price |
*Indicators not included by default may or may not work( they must be iCustom compatible )
//---
For MT4 : Any Moving Average
//---
Enjoy