• Información general
  • Comentarios (4)
  • Discusión (21)

Aggression Wave PRO

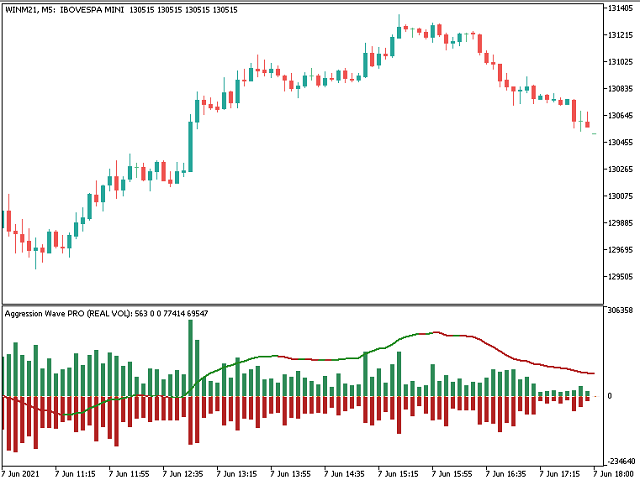
Aggression Wave PRO es un indicador desarrollado para monitorear la divergencia, la fuerza y ​​la continuidad del volumen de agresión de las negociaciones de compra y venta.
Agrression Wave PRO tiene características que le permiten ver más allá del volumen delta acumulado del día.

Nota: Este indicador NO FUNCIONA para Brokers y/o Mercados SIN el tipo de agresión (COMPRA o VENTA). Las criptomonedas y Forex no brindan este tipo de información, es decir, no funciona con ella.

Operación


    Es posible configurar el tipo de volumen:
        Volumen Real (en esta modalidad se contabilizarán los volúmenes negociados en cada transacción de activos)
        Volumen de ticks (en este modo, se contará el número de transacciones del activo).

    Es posible definir la hora de inicio de los cálculos:
        DÍA ACTUAL
        ÚLTIMO DÍA
        LOS ÚLTIMOS DOS DÍAS
        LAST_FOURDAYS
        LA SEMANA PASADA
        EL MES PASADO
        ÚLTIMOS_6MESES
        EL AÑO PASADO
        ÚLTIMOS_2AÑOS
        TODOS_DISPONIBLES_DÍAS

    Es posible configurar la línea Signal:
        Método: SMA/EMA/SMMA/LWMA
        Período

    Tiene 8 modos de visualización:
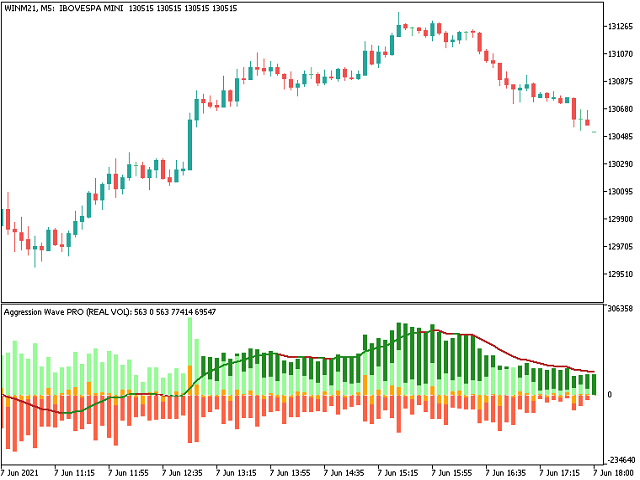
        PLOT_ALL : Graficar toda la información disponible
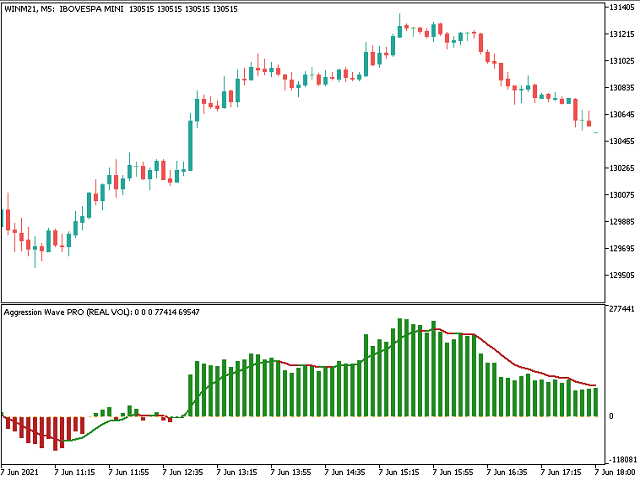
        PLOT_WAVE_AGGRESSION: Traza el acumulado del Delta + la línea de señal del acumulado
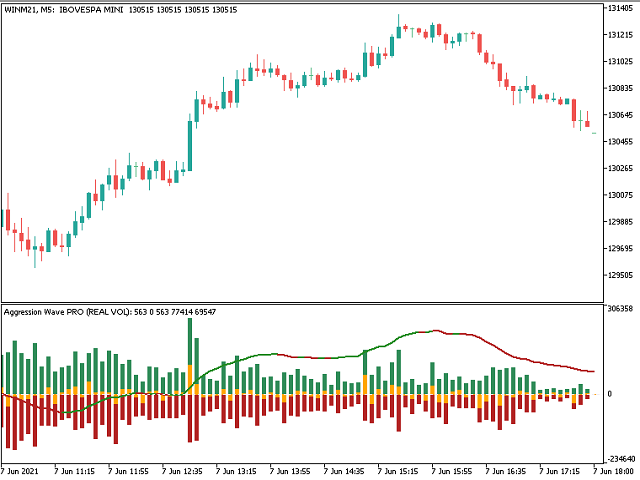
        PLOT_WAVE_DELTA_AGGRESSION: Traza el acumulado del Delta + la línea de señal del acumulado + Delta
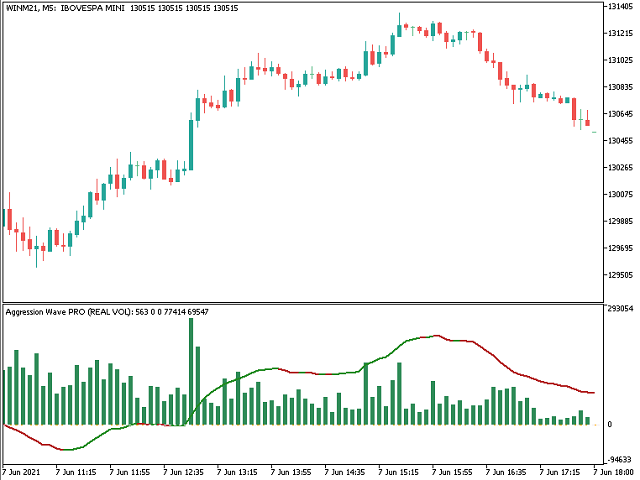
        PLOT_BUY_AGGRESSION: Plot Buy Aggression + la línea de señal del acumulado
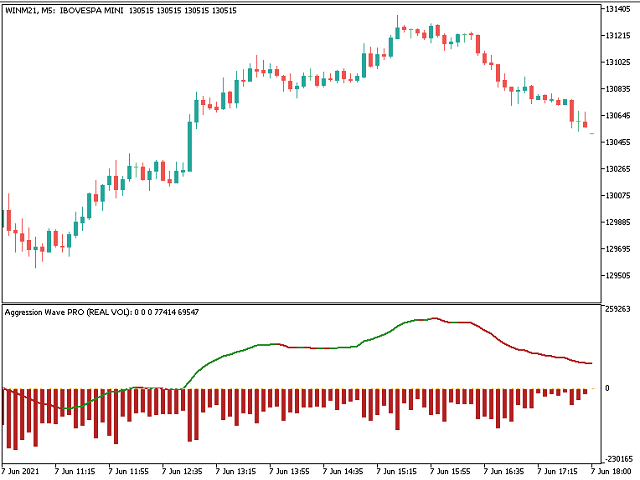
        PLOT_SELL_AGGRESSION : Parcela de Agresión de Venta + la línea de señal del acumulado
        PLOT_DELTA_AGGRESSION: Trazar Delta + la línea de señal del acumulado
        PLOT_BUY_SELL_AGGRESSION : Parcela de Agresión de Compra + Agresión de Venta + la línea de señal del acumulado
        PLOT_BUY_SELL_DELTA_AGGRESSION : Parcela Comprar Agresión + Vender Agresión + Delta + la línea de señal del acumulado

    Dispone de 7 alertas configurables:
        La agresión cruza la línea de señal
        La agresión cruza el Nivel Cero
        Cambio de agresión TENDENCIA Color
        La línea de señal cruza el nivel cero
        Cambio de línea de señal TENDENCIA Color
        Delta cruza el Nivel Cero
        Delta cruza Nivel Configurable

        Para cada alerta es posible configurar:
            Surgir
            Sonido (Hay 13 tipos de sonido disponibles).
            Notificación de teléfono inteligente
            Ventana emergente y sonido
            Notificación emergente y de teléfono inteligente
            Notificación de sonido y teléfono inteligente
            Notificación emergente, de sonido y de teléfono inteligente

Integración con Expert Advisors u otros Indicadores


    Hay 12 buffers disponibles para acceso e integración con asesores expertos u otros indicadores, los buffers de alertas se llenan incluso con las alertas apagadas, son
        Búfer ID 8: Comprar valor de agresión
        Búfer ID 13: valor de agresión de venta
        Búfer ID 18: valor de agresión delta
        Búfer ID 20: Valor de línea de señal
        Búfer ID 22: Valor acumulado de agresión
        Búfer ID 23: Alerta 1
        Búfer ID 24: Alerta 2
        Búfer ID 25: Alerta 3
        Búfer ID 26: Alerta 4
        Búfer ID 27: Alerta 5
        Búfer ID 28: Alerta 6
        Búfer ID 29: Alerta 7

    Los Buffers referentes a las 7 Alertas pueden contener los siguientes valores:
        Tendencia bajista: (-1)
        Tendencia indefinida: (0)
        Tendencia alcista: (+1)


Si aún tiene preguntas, contácteme por mensaje directo: https://www.mql5.com/es/users/robsjunqueira/


Productos recomendados
The Rocket Trend indicator is trending. The indicator draws two-color points connected by lines along the chart. This is a trend indicator, it is an algorithmic indicator. It is easy to work and understand when a blue circle appears, you need to buy, when a red one appears, sell. The indicator is used for scalping and pipsing, and has proven itself well. Rocket Trend is available for analyzing the direction of the trend for a specific period of time. Ideal for novice traders learning the laws o
This Indicator help you to identify trends and patterns. It shows the short-term, medium-term and long-term trend at the same time on the screen. It supports every timeframe except monthly. This indicator NOT implement the ZigZag indicator, but it uses its own algorithm. Supported markets: -         Forex -         Metal -         Energies Spot -         in Energies Futures only o    US Crude Oils -         in Indices Spot only o    US Tech 100 Index o    UK 100 Index o    US Wall Street 30 I
Seconds Timeframes Chart MT5
Abdelkhabir Yassine Alaoui
Gráfico de segundos para MetaTrader 5 Los indicadores le permiten crear gráficos en el terminal MetaTrader 5 con un período de tiempo en segundos. El período de tiempo en dicho gráfico se establece en segundos, no en minutos u horas. Por lo tanto, puede crear gráficos con un período de tiempo inferior a M1. Por ejemplo, S15 es un período de tiempo con un período de 15 segundos. Puede aplicar indicadores, asesores expertos y scripts al gráfico resultante. Obtiene un gráfico completamente fun
FREE
Trend Side - un indicador técnico para determinar la tendencia. Es un conjunto de varias estrategias comerciales completas. El indicador utiliza un sistema avanzado de filtrado de tendencias, tiene un panel estadístico, calcula los niveles de entrada y salida, y calcula el nivel de Trailing Stop dinámico. Apto para cualquier tipo de símbolos, nunca redibuja sus señales y resultados. Una herramienta integral para el comercio de tendencias profesional. El conjunto del indicador Trend Side tambi
Ugenesys AI MT5
Odaine Ramon Mcmillan
uGenesys AI - 90% Accurate Daytrading Indicator Introducing the ultimate forex trading indicator system, uGenesys AI, powered by cutting-edge AI technology and advanced analytical techniques, including Time-Series Analysis and Genetic Algorithms. Our AI-powered trading system leverages the power of time-series analysis to identify trends and patterns in historical price data, allowing traders to make informed predictions about future market movements. By analyzing vast amounts of data, our sys
Price reach indicator. It also serves as the perfect term for supports and resistance. I use it in two experts. The basic tool for professional trading. The indicator analyzes the last 500 bar and uses this to determine the levels ( but it doesn't predict the future ) . Personally, I use it on TF H1.  It is very simple. Four lines on chart and that's all. Only two input parameters.  Thousands of indicators. Why this? Is good ? No! Is very good. Please test the indicator prior to purchasing. You
Upgraded - Stars added to indentify Areas you can scale in to compound on your entry  when buying or selling version 2.4 Upgraded Notifications and alerts added version 2.3 *The indicator is suitable for all pairs fromm  Deriv pairs (Vix,jump,boom & crash indices) , Currencies, cryptos , stocks(USA100, USA30 ), and metals like gold etc. How does it work? Increasing the period make it more stable hence will only focus on important entry points However  lowering the period will mean the indica
Supply Demand Ranger
Krzysztof Janusz Stankiewic
5 (2)
The indicator draws supply and demand zones. The zone timeframe can be set independently of the chart timeframe. For instance, it is possible to set M5 zones on an H4 chart. The importance of zones can be adjusted using the zone strength parameter. Demand zones are displayed if at least one candle in the range of the zone is entirely above the zone. Similarly, supply zones are displayed if at least one candle within the zone is entirely below the zone.
Este indicador traza hasta 6 niveles que se pueden habilitar / deshabilitar para hacer que el gráfico sea más limpio según los requisitos del comerciante Estos 6 niveles están en 2 conjuntos: alto y bajo Para cada conjunto, se puede seleccionar un período de tiempo diferente Se basa en la estrategia de reversión del Máximo Mínimo Anterior, ya que se considera que el precio generalmente muestra rechazo en un período de tiempo más pequeño, como 5 minutos, cuando el precio alcanza el Máximo
Трендовый индикатор который подойдет как для новичка, так и для профессионального трейдера. Алгоритм индикатора отфильтровывает незначительные колебания цены при этом выделяет основные трендовые движения.  First trend PRO подойдет для неопытных трейдеров. Индикатор показывает точки входа и текущее направление движения цены. Благодаря этому вы всегда будите в курсе текущего положения дел на рынке.  Преимущества First trend PRO : First trend PRO подходит для всех символов Meta Trader 5: валют, мет
Price action is among the most popular trading concepts. A trader who knows how to use price action the right way can often improve his performance and his way of looking at charts significantly. However, there are still a lot of misunderstandings and half-truths circulating that confuse traders and set them up for failure. Using PA Trend Reversal will be possible to identify high probability exhaustion moves of a trend. Features The indicator gives alerts in real-time when the conditions are me
This indicator is used to detect spike movements in Boom and Crash pairs in Deriv company and enter into transactions. The pairs used are Boom300, Boom500, Boom1000, Crash300, Crash500, Crash1000. When the indicator gives an arrow sign in the expected direction, the transaction is entered and Stop Loss should be placed on the support/resistance areas shown by the indicator. The indicator does not repaint. It is not used for trend following, but for entering transactions in the direction of
Indicador para determinar plano y tendencia. Si el precio está por debajo de cualquiera de los dos histogramas y dos líneas (rojo y azul), esta es una zona de venta. Al comprar esta versión del indicador, la versión MT4 para una cuenta real y una demo, ¡como regalo (para recibir, escríbame un mensaje privado)! Si el precio está por encima de cualquiera de los dos histogramas y dos líneas (rojo y azul), esta es una zona de compra. Versión MT4: https://www.mql5.com/en/market/product/3793 Si
Swing Point Volume
Thalles Nascimento De Carvalho
Swing Point Volume, the indicator that signals weakness and strength at the tops and bottoms. This indicador can be for used the Wyckoff Method. Information provided; - Swing on customized ticks. - Volume and points in each balance sheet. - Percentage of Displacement. - Sound alert option on top and bottom breaks. - Volume in ticks and Real Volume. - Volume HL (extreme) or (opening and closing) - Customized volume shapes.
TrendDetect
Pavel Gotkevitch
The Trend Detect indicator combines the features of both trend indicators and oscillators. This indicator is a convenient tool for detecting short-term market cycles and identifying overbought and oversold levels. A long position can be opened when the indicator starts leaving the oversold area and breaks the zero level from below. A short position can be opened when the indicator starts leaving the overbought area and breaks the zero level from above. An opposite signal of the indicator can
KT CCI Alerts MT5
KEENBASE SOFTWARE SOLUTIONS
KT CCI Alerts is a personal implementation of the Commodity Channel Index (CCI) oscillator that provide signals and alerts on four custom events: When CCI enter in an overbought zone. When CCI exit from an overbought zone. When CCI enter in an oversold zone. When CCI exit from an oversold zone. Features A perfect choice for traders who speculate the CCI movements within an overbought/oversold zone. Lightly coded without using extensive memory and resources. It implements all Metatrader alerts
Your Trend Friend
Luigi Nunes Labigalini
The trend is your friend! Look at the color of the indicator and trade on that direction. It does not  repaint. After each candle is closed, that's the color of the trend. You can focus on shorter faster trends or major trends, just test what's most suitable for the symbol and timeframe you trade. Simply change the "Length" parameter and the indicator will automatically adapt. You can also change the color, thickness and style of the lines. Download and give it a try! There are big movements
Enhance your trading strategy and optimize your market entries with the Power MA Rectifier Indicator, now available for sale on the MetaTrader 5 (MT5) Market platform. This innovative indicator combines the power of Moving Averages (MA) with a rectification algorithm, providing traders with valuable insights to make informed trading decisions. Key Features: Moving Averages Integration : The Power MA Rectifier Indicator leverages Moving Averages to analyze market trends, helping traders identify
Based on the trading model/strategy/system of gold double-position hedging and arbitrage launched by Goodtrade Brokers, problems encountered in daily operations: 1. Account B immediately places an order immediately following account A. 2: After account A places an order, account B will automatically copy the stop loss and take profit. 3: Account A closes the position of Account B and closes the position at the same time. 4: When account B closes the position, account A also closes the position.
This indicator builds upon the previously posted Nadaraya-Watson smoothers. Here we have created an envelope indicator based on Kernel Smoothing with integrated alerts from crosses between the price and envelope extremities. Unlike the Nadaraya-Watson estimator, this indicator follows a contrarian methodology. Please note that by default this indicator can be subject to repainting. Users can use a non-repainting smoothing method available from the settings. The triangle labels are designed
Owl Smart Levels MT5
Sergey Ermolov
4.49 (37)
Versión MT4  |  FAQ El Indicador Owl Smart Levels es un sistema comercial completo dentro de un indicador que incluye herramientas de análisis de mercado tan populares como los fractales avanzados de Bill Williams , Valable ZigZag que construye la estructura de onda correcta del mercado y los niveles de Fibonacci que marcan los niveles exactos de entrada. en el mercado y lugares para tomar ganancias. Descripción detallada de la estrategia Instrucciones para trabajar con el indicador Asesor de c
Simple and fast MACD oscillator with MACD and signal lines and two-color histogram. I wasn't happy with the Meta Trader MACD oscillator as it's not immediate to read and the other ones I tried felt a bit laggy or added unneeded features on top, so I decide to make one that feels familiar to me. I hope you will find it useful! Contact me for any issues or bugs and I will try to help the best I can.
This indicator contains Pivot Levels of: Traditional Fibonacci Woodie Classic Demark Camarilla  Calculation periods can be set to auto / Daily / Weekly / Monthly / Yearly.  Number of Levels are editable.  Options to hide level labels and price labels.  Pivots Points are price levels chartists can use to determine intraday support and resistance levels. Pivot Points use the previous days Open, High, and Low to calculate a Pivot Point for the current day. Using this Pivot Point as the base, three
Explorador de patrones para patrones triangulares como triángulo simétrico, triángulo asimétrico o triángulo de ángulo recto, patrón de cuña como cuña ascendente o cuña descendente, patrón de expansión y canal de tendencia Este indicador explora el patrón histórico, así como los patrones actuales. Es el mejor indicador para aquellos que intentan ahorrar tiempo dibujando manualmente una línea de tendencia o un triángulo y desean utilizarlo para el análisis automatizado de trazar los mejores pa
Creating an Index: Importance, Customization, and Weighting Options for MT5 Trading Indicator Designing your index is crucial for efficient symbol tracking in the world of trading. With a powerful MT5 trading indicator, you gain the flexibility to construct an index that suits your preferences, whether it's an equal weighted or custom weighted one. Unlike widely-known indexes like the S&P 500, which heavily favor certain winners, this indicator empowers you to curate a basket of symbols and assi
Breakout Lines MT5
Carl Gustav Johan Ekstrom
EA included, PM after purchase! <----- The Breakout Line in technical analysis serves as a crucial tool for understanding market dynamics and potential shifts in price direction. It's designed to highlight rapid accelerations or declines in the market's trajectory. Unconventional Analysis : The Breakout Line is not your typical technical indicator; it's tailored to capture swift market movements, offering a unique perspective on price trends. Angle of the Breakout Line : The sharper the angle
Cycles Forecast
Pooriya Alirezaee
This indicator is based on a mathematical formula and an ANN combined, designed to make a model(using previous prices) of the most recent market condition (any chart*) in order to use the model as a forecasting tool. *This indicator can operate on any chart/timeframe, but it's suggested you use multiple timeframes for each trade because this method relies solely on the time factor, you can not use this indicator to predict price volatility, but if it's fit correctly it will show you when the nex
WanaScalper
Isaac Wanasolo
1 (1)
A scalping indicator based on mathematical patterns, which on average gives signals with relatively small SL, and also occasionally helps to catch big moves in the markets (more information in the video) This indicator has three main types of notifications: The first type warns of a possible/upcoming signal on the next bar The second type indicates the presence of a ready signal to enter the market/open a position The third type is for SL and TP levels - you will be notified every time price r
My Trendline
Ashok Kumar Singha
My Trendline is an Indicator based on Upper and Lower Trendline which will Plot Automatically into the Chart. This Indicator will perfectly indicate you the Trend of the Market. It can be use in any Time Frame. The Indicator will automatically adjust according to the Current Time Frame. Steps to Setup the Indicator: Install the Custom Indicator; Set all the Inputs, Line Color, Width and Styles etc. (Can use the Default Setting also); Set visualization to All Timeframe; and DONE It ca
Este indicador de panel de zona de oferta y demanda de múltiples períodos de tiempo y múltiples símbolos envía alertas cuando el precio ha alcanzado una zona de oferta / demanda. También es posible usarlo para recibir alertas sobre dobles techos / fondos regulares en lugar de zonas. Se puede utilizar con todos los marcos de tiempo de M1 a MN.       Se pueden mostrar un máximo de 9 períodos de tiempo en el tablero al mismo tiempo.   Es posible utilizar filtros de RSI, divergencia (MACD, OsMA, RSI
Los compradores de este producto también adquieren
Primero que todo, vale la pena enfatizar que este Sistema de Trading es un Indicador No Repintado, No Redibujado y No Retrasado, lo que lo hace ideal tanto para el trading manual como para el automatizado. El "Sistema de Trading Inteligente MT5" es una solución completa de trading diseñada para traders nuevos y experimentados. Combina más de 10 indicadores premium y presenta más de 7 estrategias de trading robustas, lo que lo convierte en una opción versátil para diversas condiciones del merca
Atomic Analyst MT5
Issam Kassas
4.67 (12)
En primer lugar, vale la pena enfatizar que este Indicador de Trading no repinta, no redibuja y no se retrasa, lo que lo hace ideal tanto para el trading manual como para el automatizado. El Analista Atómico es un Indicador de Acción del Precio PA que utiliza la fuerza y el impulso del precio para encontrar una mejor ventaja en el mercado. Equipado con filtros avanzados que ayudan a eliminar ruidos y señales falsas, y aumentan el potencial de trading. Utilizando múltiples capas de indicadores
Quantum Trend Sniper
Bogdan Ion Puscasu
5 (37)
Introduciendo       Indicador Quantum Trend Sniper   , el innovador indicador MQL5 que está transformando la forma en que identificas y negocias los cambios de tendencia. Desarrollado por un equipo de comerciantes experimentados con experiencia comercial de más de 13 años,       Indicador de francotirador de tendencia cuántica       está diseñado para impulsar su viaje comercial a nuevas alturas con su forma innovadora de identificar cambios de tendencia con una precisión extremadamente alta.
FX Volume MT5
Daniel Stein
4.94 (17)
Obtenga su actualización diaria del mercado con detalles y capturas de pantalla a través de nuestro Morning Briefing aquí en mql5 y en Telegram ! FX Volume es el PRIMER y ÚNICO indicador de volumen que proporciona una visión REAL del sentimiento del mercado desde el punto de vista de un bróker. Proporciona una visión impresionante de cómo los participantes institucionales del mercado, como los brokers, están posicionados en el mercado Forex, mucho más rápido que los informes COT. Ver esta info
Este es un genial indicador para MT5 que ofrece señales precisas para entrar en una transacción sin redibujar. Se puede aplicar a cualquier activo financiero: fórex, criptomonedas, metales, acciones, índices. Nos dará valoraciones bastante precisas y nos dirá cuándo es mejor abrir y cerra una transacción. Eche un vistazo  al vídeo  (6:22), ¡contiene un ejemplo de procesamiento de una sola señal que ha amortizado el indicador! La mayoría de los tráders mejoran sus resultados comerciales durante l
Ante todo, vale la pena enfatizar que esta Herramienta de Trading es un Indicador No Repintado, No Redibujado y No Retrasado, lo que la hace ideal para el trading profesional. El Indicador de Conceptos de Acción del Precio Inteligente es una herramienta muy potente tanto para traders nuevos como experimentados. Combina más de 20 indicadores útiles en uno solo, combinando ideas avanzadas de trading como el Análisis del Trader del Círculo Interior y Estrategias de Trading de Conceptos de Dinero
RelicusRoad Pro MT5
Relicus LLC
4.82 (22)
Ahora $ 147 (aumentando a $ 499 después de algunas actualizaciones) - Cuentas ilimitadas (PC o Mac) Manual de usuario de RelicusRoad + Videos de capacitación + Acceso al grupo privado de Discord + Estado VIP UNA NUEVA MANERA DE VER EL MERCADO RelicusRoad es el indicador comercial más poderoso del mundo para divisas, futuros, criptomonedas, acciones e índices, y brinda a los comerciantes toda la información y las herramientas que necesitan para mantenerse rentables. Brindamos análisis téc
TPSpro TRENDPRO  - is a trend indicator that automatically analyzes the market and provides information about the trend and each of its changes, as well as giving signals for entering trades without redrawing! The indicator uses each candle, analyzing them separately. referring to different impulses - up or down impulse. Exact entry points into transactions for currencies, crypto, metals, stocks, indices!  -  Version MT4                  DETAILED DESCRIPTION        /       TRADING SETUPS       
FX Power MT5 NG
Daniel Stein
5 (4)
Obtenga su actualización diaria del mercado con detalles y capturas de pantalla a través de nuestro Morning Briefing aquí en mql5 y en Telegram ! FX Power MT5 NG es la nueva generación de nuestro popular medidor de fuerza de divisas, FX Power. ¿Y qué ofrece este medidor de fuerza de nueva generación? Todo lo que le encantaba del FX Power original PLUS Análisis de fuerza de ORO/XAU Resultados de cálculo aún más precisos Períodos de análisis configurables individualmente Límite de cálculo persona
Advanced Supply Demand MT5
Bernhard Schweigert
4.53 (15)
¡Actualmente con 33% de descuento! ¡La mejor solución para cualquier tráder principiante o experto! Este indicador es una herramienta comercial única, de alta calidad y asequible, porque incorpora una serie de características patentadas y una nueva fórmula. Con esta actualización, podrá mostrar zonas de doble marco temporal. No solo podrá mostrar un marco temporal más alto, sino también mostrar ambos, el marco temporal del gráfico MÁS el marco temporal más alto: MOSTRANDO ZONAS ANIDADAS. A todos
A key element in trading is zones or levels from which decisions to buy or sell a trading instrument are made. Despite attempts by major players to conceal their presence in the market, they inevitably leave traces. Our task was to learn how to identify these traces and interpret them correctly. Reversal First Impulse levels (RFI)   -  Version MT4                  INSTRUCTIONS                 RUS                 ENG                         R ecommended to use with an indicator   -  TREND PRO  
ICT, SMC, SMART MONEY CONCEPTS, SMART MONEY, Smart Money Concept, Support and Resistance, Trend Analysis, Price Action, Market Structure, Order Blocks, BOS/CHoCH,   Breaker Blocks ,  Momentum Shift,   Supply&Demand Zone/Order Blocks , Strong Imbalance,   HH/LL/HL/LH,    Fair Value Gap, FVG,  Premium  &   Discount   Zones, Fibonacci Retracement, OTE, Buy Side Liquidity, Sell Side Liquidity, BSL/SSL Taken, Equal Highs & Lows, MTF Dashboard, Multiple Time Frame, BigBar, HTF OB, HTF Market Structure
Gartley Hunter Multi
Siarhei Vashchylka
5 (5)
Gartley Hunter Multi - An indicator for searching for harmonic patterns simultaneously on dozens of trading instruments and on all classic timeframes: (m1, m5, m15, m30, H1, H4, D1, Wk, Mn). Manual (Be sure to read before purchasing) | Version for MT4 Advantages 1. Patterns: Gartley, Butterfly, Shark, Crab. Bat, Alternate Bat, Deep Crab, Cypher 2. Simultaneous search for patterns on dozens of trading instruments and on all classic timeframes 3. Search for patterns of all possible sizes. Fr
Professional Scalping Tool on Deriv Attention! The indicator will be sold in limited quantities!!! The previous 5 copies were sold for $250 The next 5 copies will be sold for $350 The next price is $500 Description: This trading indicator is designed for professional traders focused on scalping. Designed with the market in mind, it provides highly accurate spike trading signals. It works on the M1 timeframe and supports the following symbols: Boom 300 Index, Boom 500 Index, Boom 1000 Index,
Blahtech Supply Demand MT5
Blahtech Limited
4.57 (14)
Was: $299  Now: $99   Supply Demand uses previous price action to identify potential imbalances between buyers and sellers. The key is to identify the better odds zones, not just the untouched ones. Blahtech Supply Demand indicator delivers functionality previously unavailable on any trading platform. This 4-in-1 indicator not only highlights the higher probability zones using a multi-criteria strength engine, but also combines it with multi-timeframe trend analysis, previously confirmed swings
MetaForecast M5
Vahidreza Heidar Gholami
5 (2)
MetaForecast predice y visualiza el futuro de cualquier mercado basándose en las armonías de los datos de precios. Aunque el mercado no siempre es predecible, si existe un patrón en el precio, MetaForecast puede predecir el futuro con la mayor precisión posible. En comparación con otros productos similares, MetaForecast puede generar resultados más precisos al analizar las tendencias del mercado. Parámetros de entrada Past size (Tamaño del pasado) Especifica el número de barras que MetaForecas
Bill Williams Advanced
Siarhei Vashchylka
5 (3)
Bill Williams Advanced is designed for automatic chart analysis using Bill Williams' "Profitunity" system. The indicator analyzes four timeframes at once. Manual (Be sure to read before purchasing) Advantages 1. Automatically analyzes the chart using the "Profitunity" system of Bill Williams. The found signals are placed in a table in the corner of the screen. 2. Equipped with a trend filter based on the Alligator indicator. Most of the system signals are recommended to be used only accordi
Introduciendo       Quantum Breakout PRO   , el innovador indicador MQL5 que está transformando la forma en que comercia con Breakout Zones. Desarrollado por un equipo de comerciantes experimentados con experiencia comercial de más de 13 años,       Desglose cuántico PRO       está diseñado para impulsar su viaje comercial a nuevas alturas con su innovadora y dinámica estrategia de zona de ruptura. El indicador de ruptura cuántica le dará flechas de señal en las zonas de ruptura con 5 zonas
XQ Indicator MetaTrader 5
Marzena Maria Szmit
5 (1)
Step into the realm of Forex trading with confidence and precision using XQ, a cutting-edge Forex indicator designed to elevate your trading game to unprecedented heights. Whether you're a seasoned trader or just stepping into the world of currency exchange, XQ Forex Indicator empowers you with the insights and signals needed to make informed trading decisions. The signal conditions are a combination of three indicators, and XQ Forex Indicator only display  medium and long-term trends . The ind
MetaBands M5
Vahidreza Heidar Gholami
4.67 (3)
MetaBands utiliza algoritmos potentes y únicos para dibujar canales y detectar tendencias para que pueda proporcionar a los traders puntos potenciales para entrar y salir de operaciones. Es un indicador de canal junto con un potente indicador de tendencia. Incluye diferentes tipos de canales que se pueden fusionar para crear nuevos canales simplemente utilizando los parámetros de entrada. MetaBands utiliza todos los tipos de alertas para notificar a los usuarios sobre eventos del mercado. Caract
Italo Volume Indicator MT5
Italo Santana Gomes
4.73 (15)
BUY INDICATOR AND GET EA FOR FREE AS A BONUS + SOME OTHER GIFTS! ITALO VOLUME INDICATOR  is the best volume indicator ever created, and why is that? The Indicator works on all time-frames and assets, indicator built after 7 years of experience on forex and many other markets. You know many volume indicators around the internet are not complete, does not help, and it's difficult to trade, but the Italo Volume Indicator is different , the Italo Volume Indicator shows the wave volume, when market
The Volume by Price Indicator for MetaTrader 5 features Volume Profile and Market Profile TPO (Time Price Opportunity). Get valuable insights out of currencies, equities and commodities data. Gain an edge trading financial markets. Volume and TPO histogram bar and line charts. Volume Footprint charts. TPO letter and block marker charts including split structures. Versatile segmentation and compositing methods. Static, dynamic and flexible ranges with relative and/or absolute visualizations. Lay
Antes que nada, vale la pena enfatizar que este Sistema de Trading es un Indicador No Repintado, No Redibujado y sin Retardos, lo que lo hace ideal para el trading profesional. El "Sistema de Trading de Soporte y Resistencia Inteligente" es un indicador avanzado diseñado para traders nuevos y experimentados. Empodera a los traders con precisión y confianza en el mercado de divisas. Este sistema integral combina más de 7 estrategias, 10 indicadores y varios enfoques de trading, incluyendo estr
TrendDecoder Premium MT5
Christophe, Pa Trouillas
5 (1)
Identifique los rangos y los próximos movimientos probables  |  Obtenga las señales más tempranas y la fuerza de las Tendencias   |  Obtener salidas claras antes de reversión   |  Detecte los niveles de Fibo que el precio pondrá a prueba   |  Indicador no repintado y no retardado - ideal para la trading manual y automatizada - adecuado para todos los activos y todas las unidades temporales 69$   para el lanzamiento - luego de nuevo a >>   $ 149 Después de la compra,   póngase en contacto con mi
Malaysian SNR Levels
Matthias Horst Pieroth
This indicator can be used to display Support and Resistance levels according to  the  Malaysian SNR concept , in which Support and Resistance are exact levels of a line chart. Malaysian SNR There are 3 different horizontal levels in Malaysian SNR: A-Level : This level is located at the peak of this line chart. (shape looks like the letter A) V-Level : Level at the valley of a line chart, (shape looks like the letter V) Gap-Leve l: This level is located at the Close/Open gap between two cand
Este indicador es una herramienta de transacción única, de alta calidad y asequible porque hemos incorporado una serie de características propias y una fórmula secreta.   Con solo un gráfico, da Alertas para los 28 pares de divisas.   ¡Imagina cómo mejorarás porque puedes identificar el punto de activación exacto de una nueva tendencia u oportunidad de crecimiento! Basado en   nuevos algoritmos subyacentes , hace que sea aún más fácil identificar y confirmar   operaciones potenciales . Esto se d
Тем, кто изучил книги Билла Вильямса "Новые измерения в биржевой торговле" и "Торговый Хаос (второе издание)" и пробовал торговать по этим методикам, становится ясно, что стандартного набора индикаторов недостаточно для полноценной работы. Индикатор  Trading Chaos Map  рисует "карту рынка", позволяя вам видеть графики так же, как автор трилогии. В параметрах предусмотрены опции включения и отключения каждого сигнала. Вы можете использовать ту или иную методику, либо использовать их вместе. Может
Golden Gate Algo MT5
James David Lane
4 (6)
¡40% DE DESCUENTO PARA NAVIDAD! ¡AUMENTO DE PRECIO A $250 EL 1 DE ENERO! Presentamos GoldenGate Entries: ¡Una Solución de Trading de Vanguardia! Descubre un enfoque revolucionario para el trading con GoldenGate Entries (GGE), un indicador avanzado diseñado para elevar tu experiencia de trading. GGE proporciona un conjunto completo de características para capacitar a los usuarios con precisión y confianza en sus decisiones comerciales. Pares: Cualquiera (FX - Materias primas - Acciones - A
Legacy of Gann for MT5
Pavel Zamoshnikov
5 (4)
The indicator very accurately determines the levels of the possible end of the trend and profit fixing. The method of determining levels is based on the ideas of W.D.Gann, using an algorithm developed by his follower Kirill Borovsky. Extremely high reliability of reaching levels (according to K. Borovsky  - 80-90%) Indispensable for any trading strategy – every trader needs to determine the exit point from the market! Precisely determines targets on any timeframes and any instruments (forex, met
Royal Wave Pro M5
Vahidreza Heidar Gholami
3.5 (4)
Royal Wave is a Trend-Power oscillator which has been programmed to locate and signal low-risk entry and exit zones. Its core algorithm statistically analyzes the market and generates trading signals for overbought, oversold and low volatile areas. By using a well-designed alerting system, this indicator makes it easier to make proper decisions regarding where to enter and where to exit trades. Features Trend-Power Algorithm Low risk Entry Zones and Exit Zones Predictions for Overbought and Over
Otros productos de este autor
Candle Timer Countdown muestra el tiempo restante antes de que se cierre la barra actual y se forme una nueva barra. Puede utilizarse para la gestión del tiempo. ¡Versión MT4 aquí ! Características destacadas Realiza un seguimiento de la hora del servidor, no de la hora local Color de texto y tamaño de fuente configurables Visualización opcional de la variación diaria del símbolo Optimizado para reducir el uso de la CPU Parámetros de entrada Mostrar variación diaria: verdadero / falso T
FREE
MACD Intraday Trend es un indicador desarrollado a través de una adaptación del MACD original creado por Gerald Appel en la década de 1960. A lo largo de años de negociación, se observó que al cambiar los parámetros del MACD con proporciones de Fibonacci logramos una mejor presentación de la continuidad de los movimientos de la tendencia, haciendo que sea posible detectar de manera más eficiente el inicio y el final de una tendencia de precios. Debido a su eficiencia en la detección de tend
FREE
Candle Timer Countdown muestra el tiempo restante antes de que se cierre la barra actual y se forme una nueva barra. Puede utilizarse para la gestión del tiempo. ¡Versión MT5 aquí ! Características destacadas Realiza un seguimiento de la hora del servidor, no de la hora local Color de texto y tamaño de fuente configurables Visualización opcional de la variación diaria del símbolo Optimizado para reducir el uso de la CPU Parámetros de entrada Mostrar variación diaria: verdadero / falso T
FREE
Setup Tabajara fue creado por un comerciante brasileño conocido como "El OGRO de Wall Street". La idea de esta configuración es indicar al comerciante la tendencia actual de los precios y el tipo de operación que debe buscar en el gráfico. Operación Lo hace mediante el posicionamiento del cierre de las velas y el VWAP hasta las 10:40 am y luego mediante la media aritmética de 20 periodos pintando las velas en 4 colores posibles: Verde -> Precio subiendo en tendencia alcista (Buscar puntos d
FREE
Pivot Point Fibo RSJ es un indicador que rastrea las líneas de soporte y resistencia del día utilizando las tasas de Fibonacci. Este espectacular indicador crea hasta 7 niveles de soporte y resistencia a través del Pivot Point utilizando las tasas de Fibonacci. Es fantástico cómo los precios respetan cada nivel de este soporte y resistencia, donde es posible percibir posibles puntos de entrada / salida de una operación. Características Hasta 7 niveles de soporte y 7 niveles de resistencia
FREE
Candle Counter es un indicador que imprime el número de velas de la primera vela del día. La primera vela del día será la número 1 y cada nueva vela se incrementará en 1 en este recuento. Parámetros de entrada Elija entre pares, impares o todos Distancia de la vela para imprimir el número Tamaño de fuente de texto Color de fuente de texto Si aún tiene preguntas, comuníquese conmigo por mensaje directo:  https://www.mql5.com/es/users/robsjunqueira/
FREE
MACD Intraday Trend es un indicador desarrollado a través de una adaptación del MACD original creado por Gerald Appel en la década de 1960. A lo largo de años de negociación, se observó que al cambiar los parámetros del MACD con proporciones de Fibonacci logramos una mejor presentación de la continuidad de los movimientos de la tendencia, haciendo que sea posible detectar de manera más eficiente el inicio y el final de una tendencia de precios. Debido a su eficiencia en la detección de tend
FREE
Pivot Point Fibo RSJ es un indicador que rastrea las líneas de soporte y resistencia del día utilizando las tasas de Fibonacci. Este espectacular indicador crea hasta 7 niveles de soporte y resistencia a través del Pivot Point utilizando las tasas de Fibonacci. Es fantástico cómo los precios respetan cada nivel de este soporte y resistencia, donde es posible percibir posibles puntos de entrada / salida de una operación. Características Hasta 7 niveles de soporte y 7 niveles de resistencia
FREE
Weis Waves RSJ
JETINVEST
4.67 (9)
The Weis Waves RSJ Indicator sums up volumes in each wave. This is how we receive a bar chart of cumulative volumes of alternating waves. Namely the cumulative volume makes the Weis wave charts unique. It allows comparing the relation of the wave sequence characteristics, such as correspondence of the applied force (expressed in the volume) and received result (the price progress). If you still have questions, please contact me by direct message:  https://www.mql5.com/en/users/robsjunqueira/
FREE
Tabajara Ogro
JETINVEST
4.75 (12)
Setup Tabajara was created by a Brazilian trader known as  "The OGRO of Wall Street" . The idea of this setup is to indicate to the trader the current trend of prices and  the type of operation should be looked for in the graph. Operation It does this through the relation of the closing price position and the     of 20 periods, by painting the candles in 4 possible colors : Green -> Price rising in upward trend (Search entry points for PURCHASE) Black -> Price correcting in Bullish Trend
FREE
VWAP Fibo Bands RSJ is an indicator that traces the lines of the daily VWAP and from it creates bands using Fibonacci proportions. This spectacular indicator creates 10 band levels through the selected VWAP period using Fibonacci ratios. It is fantastic how the prices respect each level of the bands, where it is possible to realize that almost every time the price closes above / below a level of the bands he will seek the next one. If close above will seek to reach the level above and if close
FREE
MACD Intraday Trend PRO es un indicador desarrollado a través de una adaptación del MACD original creado por Gerald Appel en la década de 1960. A lo largo de años de negociación, se observó que al cambiar los parámetros del MACD con proporciones de Fibonacci logramos una mejor presentación de la continuidad de los movimientos de la tendencia, haciendo que sea posible detectar de manera más eficiente el inicio y el final de una tendencia de precios. Debido a su eficiencia en la detección de
Vwap RSJ
JETINVEST
4.93 (14)
VWAP RSJ is an indicator that plots the Hourly, Daily, Weekly and Monthly  VWAP Lines. Large institutional buyers and   mutual funds   use the VWAP ratio to help move into or out of stocks with as small of a market impact as possible. Therefore, when possible, institutions will try to buy below the VWAP, or sell above it. This way their actions push the price back toward the average, instead of away from it. Based on this information I developed this indicator that combines 4 types of VWAP T
FREE
Trend WIN B3 es un sistema comercial profesional creado para la plataforma MT5 y optimizado para trabajar con MINI FUTURE INDEX (WIN) en B3 en BRASIL. El sistema utiliza Fuzzy Logic en varios timeframes (1M, 5M, 15M, 30M, H1, H4, D1) para identificar la tendencia del precio, aplicando ponderaciones en cada timeframe según los cálculos realizados. Una vez identificada la tendencia, el sistema coloca una orden STOP (COMPRAR o VENDER) de acuerdo con la volatilidad promedio, y cuando se abre la pos
MACD Intraday Trend PRO es un indicador desarrollado a través de una adaptación del MACD original creado por Gerald Appel en la década de 1960. A lo largo de años de negociación, se observó que al cambiar los parámetros del MACD con proporciones de Fibonacci logramos una mejor presentación de la continuidad de los movimientos de la tendencia, haciendo que sea posible detectar de manera más eficiente el inicio y el final de una tendencia de precios. Debido a su eficiencia en la detección de
Delta Aggression Volume PRO is an indicator developed to monitor the strength and continuity of the aggression volume of sell and buy negotiations. Note: This indicator DOES NOT WORK for Brokers and/or Markets WITHOUT the type of aggression (BUY or SELL). Cryptocurrencies and Forex do not provide this type of data, that is, it does not work with them. O Delta Agrression Volume PRO has features that allow you to view beyond the delta volume of the day. Operation Multi symbols  (those who pro
This indicator sums up the difference between the sells aggression and the buys aggression that occurred in each Candle, graphically plotting the waves of accumulation of the aggression volumes.   Through these waves an exponential average is calculated that indicates the direction of the business flow. Note: This indicator DOES NOT WORK for Brokers and/or Markets WITHOUT the type of aggression (BUY or SELL).   Be sure to try our Professional version with configurable features and alerts:  Agr
FREE
This indicator calculates the difference between the SELL aggression and the BUY aggression that occurred in each Candle, plotting the balance of each one graphically. Note: This indicator DOES NOT WORK for Brokers and/or Markets WITHOUT the type of aggression (BUY or SELL). Be sure to try our   Professional   version with configurable features and alerts:   Delta Agression Volume PRO Settings Aggression by volume (Real Volume) or by number of trades (Tick Volume) Start of the Aggression De
FREE
This simple indicator paints with a darker color on the volume bar when the quantity traded is above the average of select number of periods of the volume itself, highlighting the moments when there was a large volume of deals above the average. It is also possible to use a configuration of four colors where the color tone shows a candle volume strength. The indicator defaults to the simple average of 20 periods, but it is possible to change to other types of averages and periods. If you like
FREE
Funcionamento: O Painel  Netting Panel RSJ  funciona com   qualquer ativo   e em   qualquer tempo gráfico . Ele funciona em contas do tipo " Netting " e " Hedge ", mas gerencia apenas uma posição por ativo, por isso o nome   Netting.   Se ele for executado em contas do tipo " Hedge ", ele fará o gerenciamento e proteção   apenas da posição mais antiga , ou seja, da primeira posição que foi aberta por ele. Em contas " Netting " quando os botões " SELL " ou " BUY " forem pressionados,   ocorrer
FREE
RENKO PRICE ACTION ATR es un "Asesor Experto" desarrollado a través de la construcción del Cuadro Renko donde cada LADRILLO tiene el tamaño calculado a través del ATR del período seleccionado por el usuario. Los gráficos de Renko están diseñados para filtrar los movimientos de precios menores, lo que facilita que los operadores se centren en las tendencias importantes. Debido a su eficiencia en la detección de tendencias de precios, también es posible identificar claramente los soportes y resis
El indicador Oferta Demanda RSJ PRO calcula y traza las zonas de "Oferta" y "Demanda" en el gráfico, identificando el tipo de Zona (Débil, Fuerte, Verificada, Probada) y en caso de reevaluaciones de la Zona muestra cuántas veces se volvió a probar. Las zonas de "oferta" son las zonas de precios donde se ha producido más oferta que demanda, lo que hace bajar los precios. Las zonas de "demanda" son las zonas de precios donde se ha producido más demanda que oferta, lo que hace subir los precios.
Trend WDO B3 es un sistema comercial profesional creado para la plataforma MT5 y optimizado para trabajar con MINI DOLAR INDEX (WDO) en B3 en BRASIL. El sistema utiliza Fuzzy Logic en varios timeframes (1M, 5M, 15M, 30M, H1, H4, D1) para identificar la tendencia del precio, aplicando ponderaciones en cada timeframe según los cálculos realizados. Una vez identificada la tendencia, el sistema coloca una orden STOP (COMPRAR o VENDER) de acuerdo con la volatilidad promedio, y cuando se abre la posi
El EA utiliza la volatilidad, el diferencial, la frecuencia y el momento para decidir cuándo operar. El EA usa el método de Órdenes Limitadas para abrir Posiciones. En este caso, el Deslizamiento será como mucho positivo al ejecutar las entradas. El EA utiliza la lógica Trailing Take Profit, ya que el enfoque del sistema es ganar dinero mientras protege su capital. La mayoría de las operaciones se cierran rápidamente, como un disparo fuerte de un francotirador. Principales características No
This is an EXPERT with a FOCUS on LEARNING and PROFESSIONAL DEVELOPMENT!!! The idea of this product is to commercialize the source code, allowing those who want to develop their own robots, or start a professional activity developing customized experts, to have a reference source code that helps them in the learning and development process. This source code will be increased, that is, new functionalities will be created, thus allowing the project to continue evolving. For every 10 sales a new v
Filtro:
Wesley Bezerra Mota
302
Wesley Bezerra Mota 2021.07.06 20:13 
 

El usuario no ha dejado ningún comentario para su valoración

JETINVEST
247477
Respuesta del desarrollador Roberto Sant Ana Junqueira 2021.07.06 20:14
Obrigado
Fabio_Novaes
175
Fabio_Novaes 2021.06.30 21:34 
 

El usuario no ha dejado ningún comentario para su valoración

JETINVEST
247477
Respuesta del desarrollador Roberto Sant Ana Junqueira 2021.06.30 21:34
Tks
Marilise Ravaglio Da Cunha Junqueira
386
 

El usuario no ha dejado ningún comentario para su valoración

JETINVEST
247477
Respuesta del desarrollador Roberto Sant Ana Junqueira 2021.07.26 21:53
Obrigado
Robson Souza
122
Robson Souza 2021.06.30 14:53 
 

El usuario no ha dejado ningún comentario para su valoración

JETINVEST
247477
Respuesta del desarrollador Roberto Sant Ana Junqueira 2021.06.30 15:07
Hi Robson, tks for your review.
Respuesta al comentario