MACD Intraday Trend PRO
- Indicadores
- JETINVEST
- Versión: 1.20
- Actualizado: 6 junio 2021
- Activaciones: 20
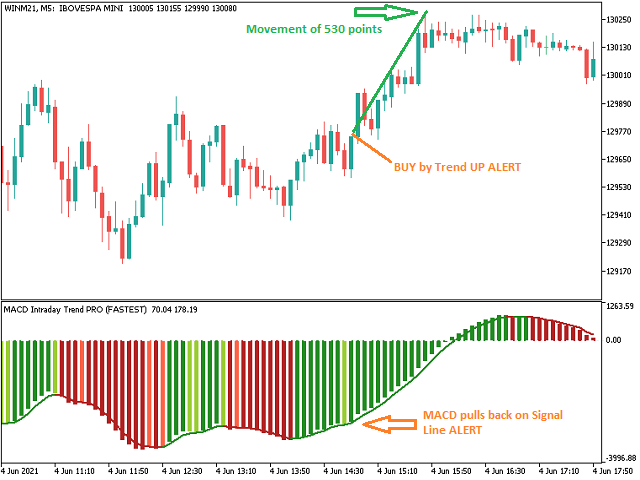
MACD Intraday Trend PRO es un indicador desarrollado a través de una adaptación del MACD original creado por Gerald Appel en la década de 1960.
A lo largo de años de negociación, se observó que al cambiar los parámetros del MACD con proporciones de Fibonacci logramos una mejor presentación de la continuidad de los movimientos de la tendencia, haciendo que sea posible detectar de manera más eficiente el inicio y el final de una tendencia de precios.
Debido a su eficiencia en la detección de tendencias de precios, también es posible identificar muy claramente las divergencias de máximos y mínimos, aprovechando así mejor las oportunidades comerciales.
Características
- El indicador MACD Intraday Trend PRO funciona con cualquier par de divisas, en cualquier período de tiempo y con gráficos Renko.
- Es posible configurar la velocidad de detección de tendencias seleccionando 6 modos:
- LO MÁS RÁPIDO
- RÁPIDO
- NORMAL
- LENTO
- EL MÁS LENTO
Recursos
- Tiene 6 alertas configurables:
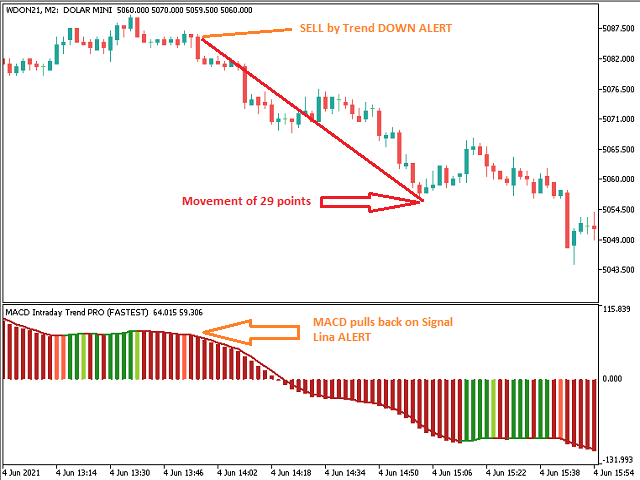
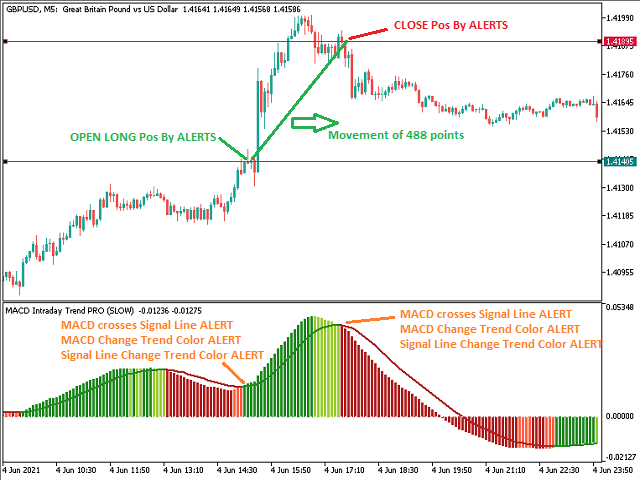
- MACD retrocede en la línea de señal
- MACD cruza la línea de señal
- MACD cruza el nivel cero
- La línea de señal cruza el nivel cero
- MACD cambia el color de la TENDENCIA
- Señal Cambio de línea TENDENCIA Color
- Para cada alerta es posible configurar:
- Surgir
- Sonido (hay 13 tipos de sonido disponibles).
- Notificación de teléfono inteligente
- Popup y sonido
- Notificación emergente y de teléfono inteligente
- Notificación de sonido y teléfono inteligente
- Notificación emergente, de sonido y de teléfono inteligente
Integración con asesores expertos u otros indicadores
- Hay 8 buffers disponibles para el acceso e integración con asesores expertos u otros indicadores, se llenan incluso con las alertas apagadas, son:
- ID de búfer 5: valor MACD
- ID de búfer 6: valor de línea de señal
- ID de búfer 12: Alerta 1
- ID de búfer 13: Alerta 2
- ID de búfer 14: Alerta 3
- ID de búfer 15: Alerta 4
- ID de búfer 16: Alerta 5
- ID de búfer 17: Alerta 6
- Los búferes que hacen referencia a las 6 alertas pueden contener los siguientes valores:
- Tendencia bajista: (-1)
- Tendencia indefinida: (0)
- Tendencia alcista: (+1)
Si aún tiene preguntas, comuníquese conmigo a través del mensaje directo: https://www.mql5.com/es/users/robsjunqueira/


Great indicator