Lisek Levels and Channels Indicator
- Indicadores
- Darius Hans Lischka
- Versión: 1.4
- Actualizado: 7 mayo 2021
Are you looking for Price Levels and Price Channels and Price VWAP and Volume On Balance Indicators ?
Now you have all in one !!! With Alarm and Push Notification.
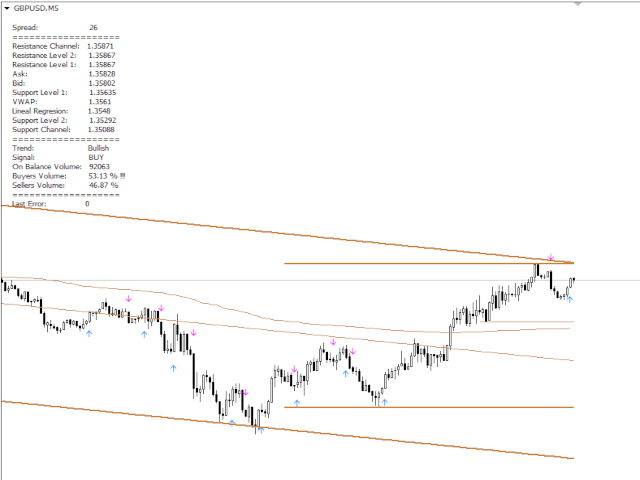
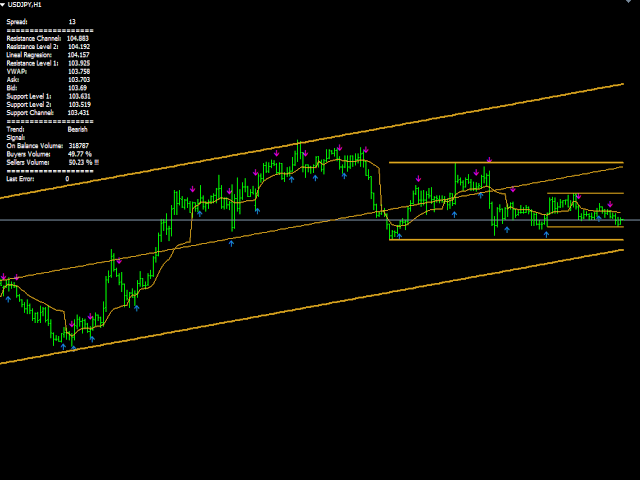
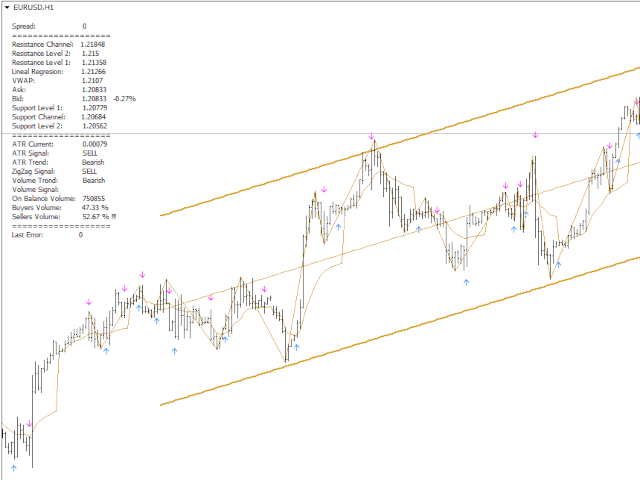
Info on your chart is showing you:
- where current price is and all levels, channels and vwap,
- how big is current On Balance Volume, is it going Bearish or Bullish, and who has the power, Buyers or Sellers.
Up and down arrows showing you growing Seller or Buyer Volume.
Lines showing you all Levels and Channels.
Search for an entry with low risk for trading by Lisek Levels and Channels Indicator.
There are many ways to trade with Lisek Levels and Channels Indicator:
- Trade Support and Resistance Levels and/or Channels.
- Trade pullbacks (Range trading).
- Trade breakouts.
- Trade reversals.
- Take profits or set stop-loss based on Levels and Channels.
Set in your Chart Window Properties to Chart in foreground.
Happy Trading !!!


Very useful! It would be even better if you could change the color of some lines.