Advanced Support and Resistance Tool
- Indicadores
- Batsirayi L Marango
- Versión: 1.0
- Activaciones: 5
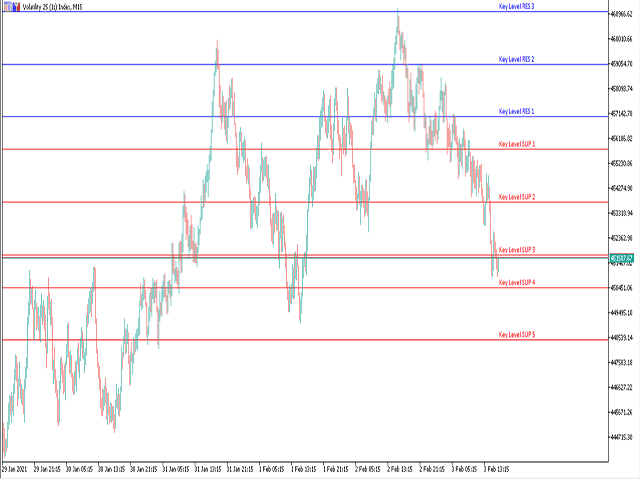
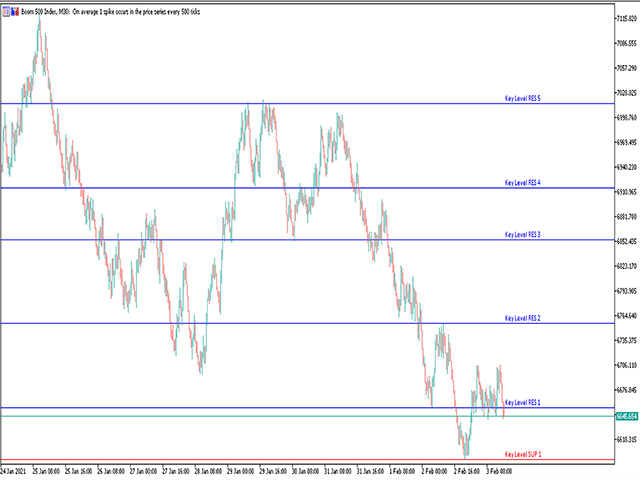
Advanced Support and Resistance
Support and resistance levels are widely used in trading. They are important as they show some key price levels. Before applying any strategy, one may consider it necessary to draw support and resistance. However, this process can take much time especially if one is to analyse a lot of currency pairs, commodities or indices. This Advanced Support and Resistance tool was designed for traders at any level, amateur to professional. It plots key support and resistance levels in seconds. To make it even smart for traders, one can set alerts to be sent when a key support or resistance is reached. Even new traders with little or no experience in trading can get the support ad resistance lines drawn for them in minutes.
Features
· Use the support and resistance levels for seeing potential reversals, breakouts, take profit levels, stop loss levels and more
· Boost your technical analysis in minutes
· Non repaint indicator, based on pure price action principles
· Save time for multi timeframe analysis on trades
· Receive notifications as sound, pop up alerts, email and mobile push notifications
Input Settings
Input parameters
Chart Period – the period to consider support and resistance levels
Maximum Range – maximum number of bars for calculation
Minimum Range – minimum number of bars for calculation
Resistance Lines Colour – colour for the resistance lines
Support Lines Colour - colour for the support lines
Resistance Lines Style – choose from solid, dashed, dotted, dotted dash with double lines
Support Lines Style – choose from solid, dashed, dotted, dotted dash with double lines
Resistance Lines Widths - width for the resistance lines
Support Lines Widths - width for the support lines
TextSize – font text size
AlertName – name written on alerts
Send Email Alerts – receive signal notification via Email
Sound and Pop-Up Alerts - receive signal notification on your computer or laptop
Mobile Phone Notification - receive signal notification to your phone MT5 terminal