ZigZag Bullets
- Indicadores
- Natasha Diedericks
- Versión: 1.8
- Actualizado: 19 octubre 2022
- Activaciones: 20
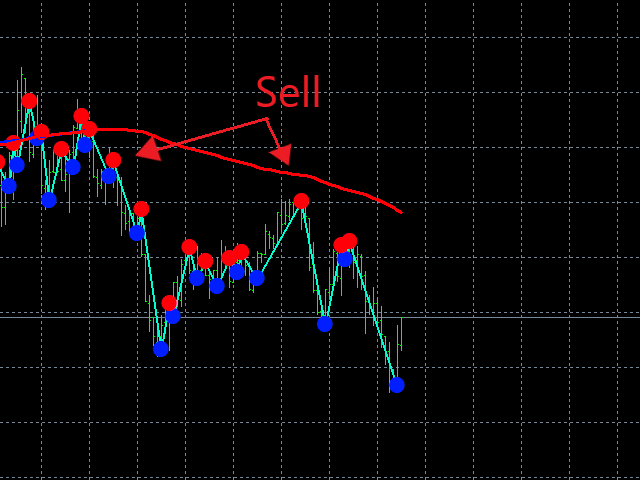
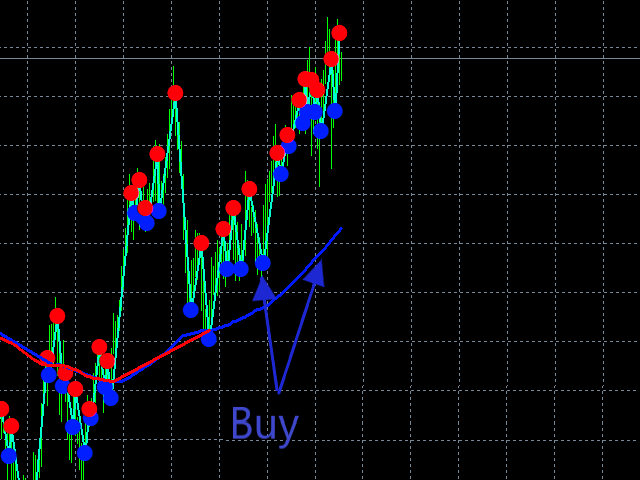
This indicator takes input from the ZigZag and ADX indicators, combined with a special trend algorithm. You also get a Moving Average on the chart to determine trend direction.
Great for scalping.
Perfect for channels.
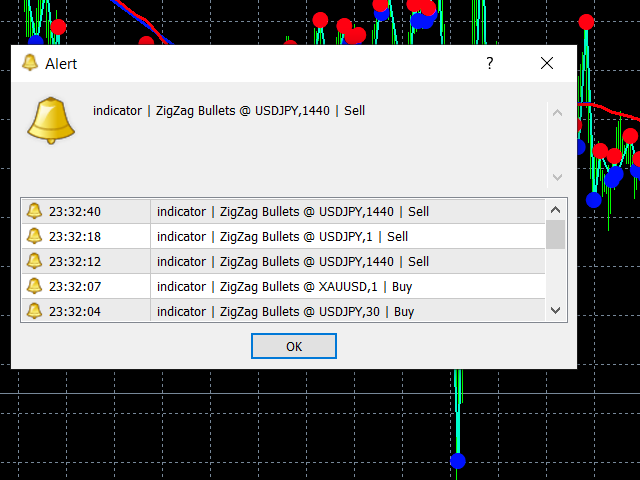
Features alert functions.
BulletPeriod.
Parameter TrendLinePeriod for the MA line. Change to your preference. Try 200.
How to use:
Simply attach to any chart.
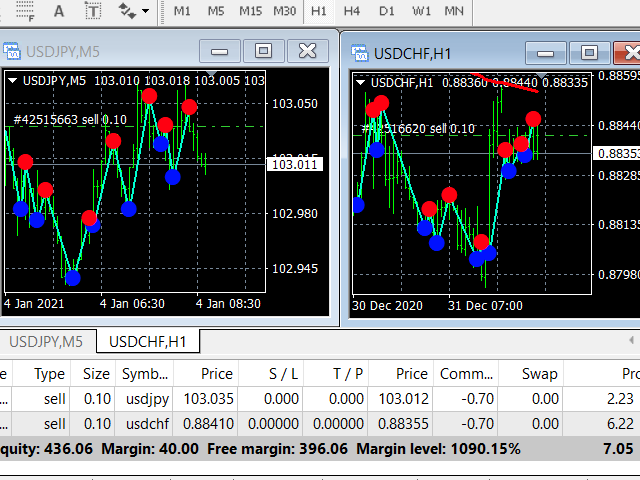
Sell on red bullets, with red MA line above price. Enter on bullets closest to this line.
Buy on blue bullets, with blue MA line below price. Enter on bullets closest to this line.
Best results when checking the higher time frames before entering trades, i.e., bullets appear on the current and higher 2 time frames. E.g., for a sell, look for red bullets to appear on H1, H4 and Daily, or lower time frames.
Use as you see fit for your strategy.
Best results on Major Pairs, but can also be used on other pairs.
Important to note:
-
Please do not use this indicator haphazardly. Make sure it compliments your strategy.
-
Don't risk money you cannot afford to lose.
-
You use this indicator at your own risk. Please apply money management wisely.
-
Always test your strategy on a demo account before using a new indicator on a live account.
use this to combine with Semafor, Fractals and currency strength meter and you have a decent system