• Información general
  • Comentarios
  • Discusión

Candle Code

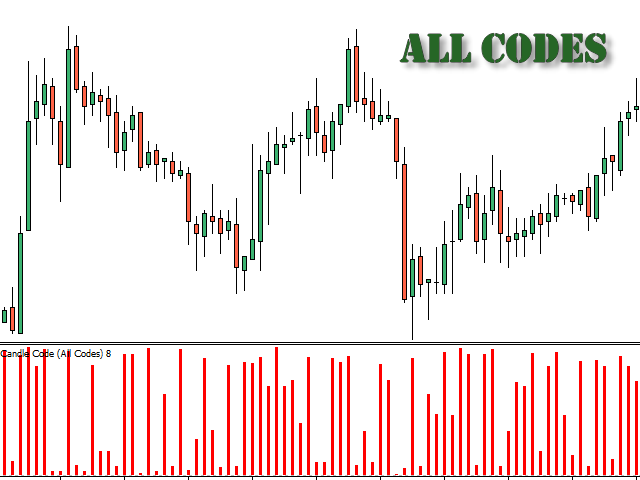
Индикатор присваивает каждой свече уникальный код, который зависит от ее параметров - направления, размеров верхней и нижней тени и размера тела. Алгоритм расчета кода свечи следующий:

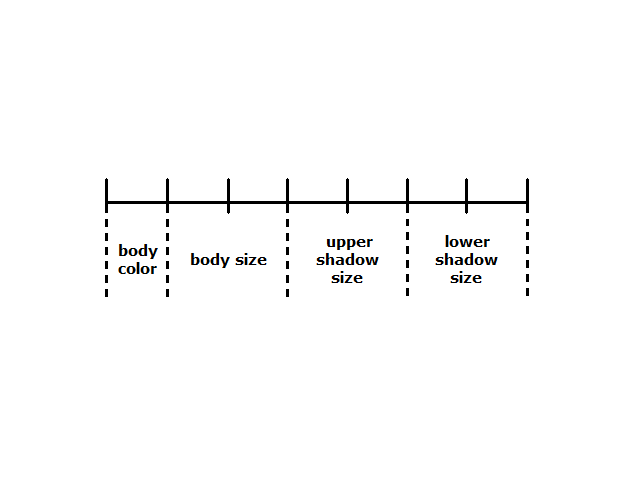
  1. строится семизначный двоичный код, первое место в котором обозначает направление свечи, 2-е и 3-е места - размер тела, 3-е и 4-е - размер верхней тени, 5-е и 6-е - размер нижней тени (см. скриншот №7). На эти позиции ставится 0 или 1 в зависимости от параметров свечи:

    Направление свечи (цвет тела)
    1 – бычья свеча (цена закрытия выше цены открытия)
    0 – медвежья свеча (цена закрытия ниже цены открытия)

    Размер тела
    - Для бычьей свечи:
    00 – тело отсутствует (доджи)
    01 – малое тело
    10 – среднее тело
    11 – большое тело
    - Для медвежьей свечи:
    11 – тело отсутствует (доджи)
    10 – малое тело
    01 – среднее тело
    00 – большое тело

    Размер верхней тени
    00 – тень отсутствует
    01 – малая тень
    10 – тень средних размеров
    11 – большая тень

    Размер нижней тени
    11 – тень отсутствует
    10 – малая тень
    01 – тень средних размеров
    00 – большая тень

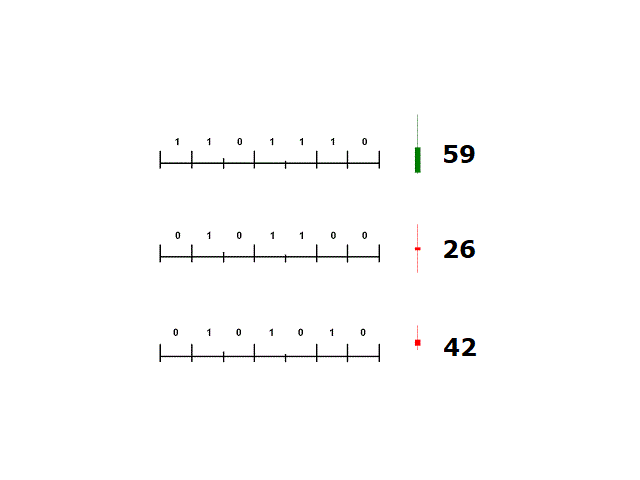
    ВАЖНО! Направление доджи (цвет тела) принимается противоположным от направления предыдущей свечи.

  2. Полученный двоичный код переводится в привычное десятичное число в диапазоне от 0 до 127 (см. скриншот №8).


Алгоритм построения кода свечи взят с книги В. И. Сафина «Кому светят японские свечи».


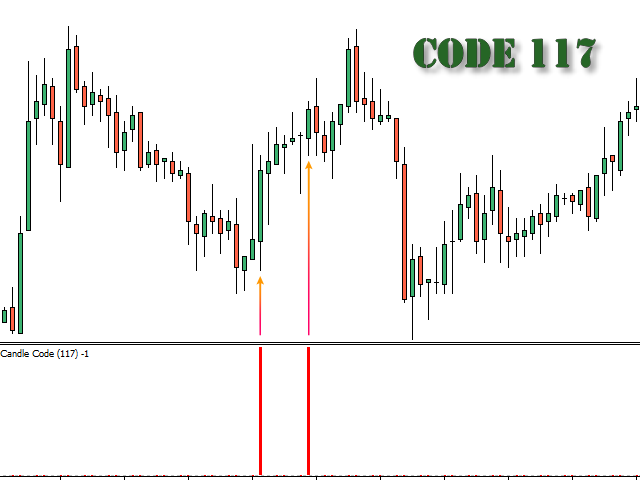
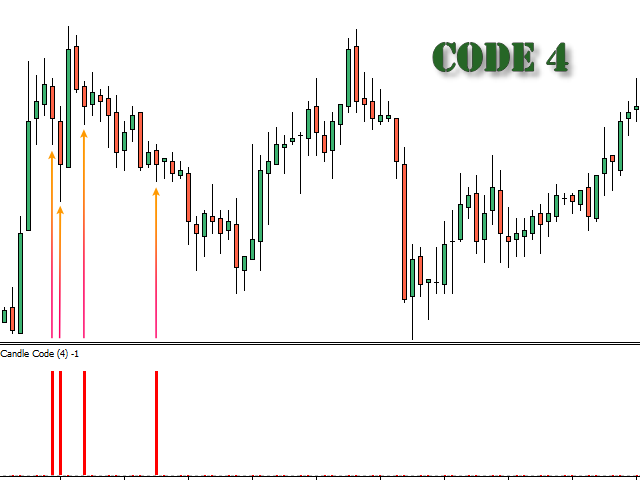
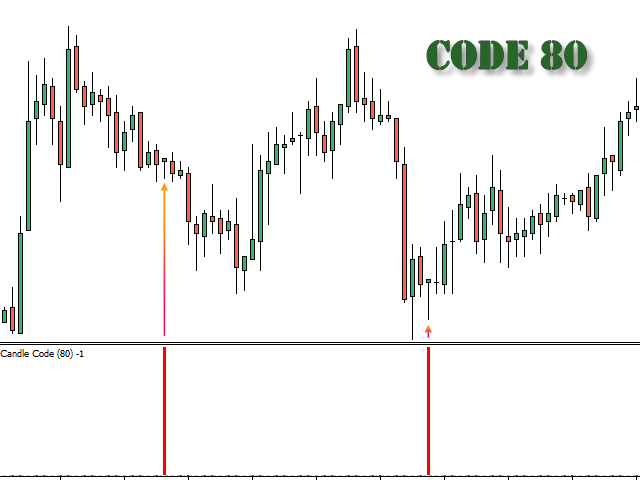
ВАЖНО! Размеры теней/тела свечи - это размеры относительно полного размера этой свечи, поэтому одинаковый код может получить как большая свеча на графике, так и маленькая (видно на скриншотах). В данном индикаторе определение размеров происходит по следующей схеме:

  • тело/тень отсутствует - размер тела/тени меньше 2% от размера свечи
  • малое тело/тень - от 2% (включительно) до 16% от размера свечи
  • среднее тело/тень - от 16% (включительно) до 32% от размера свечи
  • большое тело/тень - от 32% (включительно) от размера свечи


ПАРАМЕТРЫ

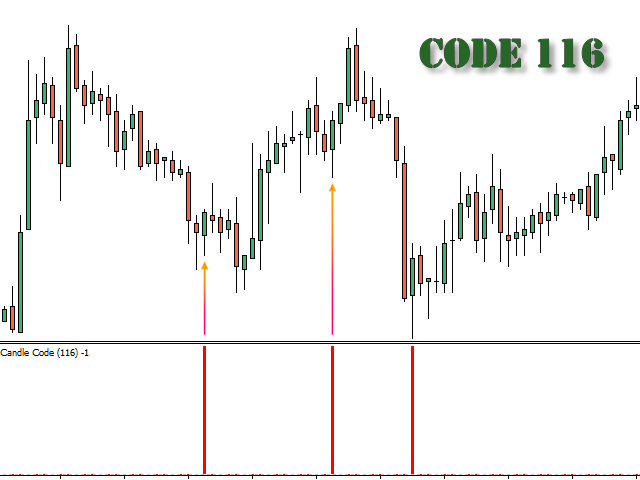
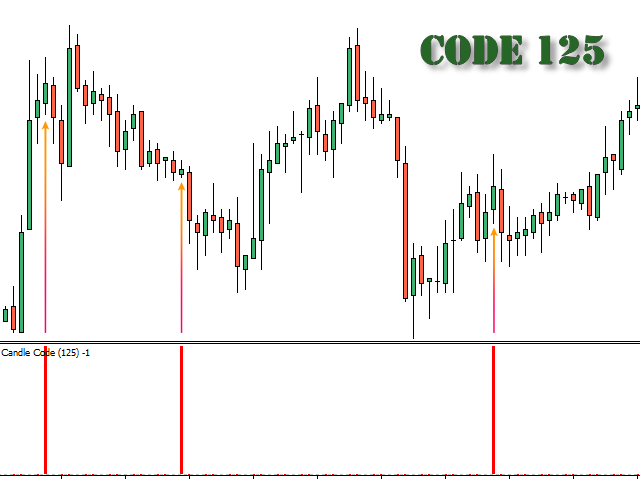
  • CandleCodeFilter: фильтр кодов свечей. При значениях от 0 до 127 на гистограмме отображаются только свечи с данным кодом, а все остальные значения индикатора равны -1. Если CandleCodeFilter меньше 0 или больше 127, то на индикатор выводятся коды всех свечей.

Productos recomendados
Blahtech Market Profile
Blahtech Limited
4.61 (18)
Was: $249  Now: $99   Market Profile defines a number of day types that can help the trader to determine market behaviour. A key feature is the Value Area, representing the range of price action where 70% of trading took place. Understanding the Value Area can give traders valuable insight into market direction and establish the higher odds trade. It is an excellent addition to any system you may be using. Blahtech Limited presents their Market Profile indicator for the MetaTrader community. Ins
Master Scalping M1 es un indicador innovador que utiliza un algoritmo para determinar la tendencia de forma rápida y precisa. El indicador calcula el tiempo de apertura y cierre de posiciones, los algoritmos del indicador le permiten encontrar los momentos ideales para ingresar a una operación (comprar o vender un activo), lo que aumenta el éxito de las transacciones para la mayoría de los comerciantes. Beneficios del indicador: Fácil de usar, no sobrecarga el gráfico con información innecesari
El indicador construye cotizaciones actuales, que se pueden comparar con las históricas y, sobre esta base, hacer un pronóstico de movimiento de precios. El indicador tiene un campo de texto para una navegación rápida a la fecha deseada. Opciones: Símbolo - selección del símbolo que mostrará el indicador; SymbolPeriod - selección del período del cual el indicador tomará datos; IndicatorColor - color del indicador; HorisontalShift: cambio de cotizaciones dibujadas por el indicador
The indicator allows you to trade binary options. The recommended time frame is М1 and the expiration time is 1,2,3 minutes. The indicator suitable for auto and manual trading. A possible signal is specified as a arrows above/under a candle. You should wait until the candle closes! Arrows are not re-painted Trade sessions: TOKYO section (Half-end) Currency pairs: USD/JPY Working time frame: M1 Expiration time: 1,2,3 minutes. The indicator also shows good results when using the martingale strateg
FREE
Un indicador técnico que calcula sus lecturas sobre los volúmenes de negociación. En forma de histograma, muestra la acumulación de la fuerza del movimiento del instrumento comercial. Dispone de sistemas de cálculo independientes para direcciones alcistas y bajistas. Funciona en cualquier instrumento comercial y marco de tiempo. Puede complementar cualquier sistema comercial. El indicador no vuelve a dibujar sus valores, las señales aparecen en la vela actual. Es fácil de usar y no carga el gr
Dollar mint indicator is a special workmanship with years of experience in forex.   Dollar mint ea is a fully non repaint indicator optimised with price action data such that once it gives you a signal t . The indicator   can be used to trade anything on the mt4 with much ease. Benefits ; Fully non repaint Use in any timeframe Use in all the available tradable assets on mt4 Best to use on h4. It generates fully analysed buy and sell signals based on trend and also filters out retracement
CyberZingFx Trend Reversal
Afsal Meerankutty
4.26 (19)
Indicator captures the trend reversals with no-repaint Buy and Sell Arrow signals. CyberZingFx Trend Reversal Indicator - your go-to solution for accurate and reliable trend reversal signals. With its  advanced trading strategy , the indicator offers you Buy and Sell Arrow signals that do not repaint, making it a reliable tool for catching Swing Highs and Swing Lows in any market and any time frame. Indicator works on  any market  and  any time frames . __________________________________________
VR Cub
Vladimir Pastushak
VR Cub es un indicador para obtener puntos de entrada de alta calidad. El indicador fue desarrollado para facilitar los cálculos matemáticos y simplificar la búsqueda de puntos de entrada a una posición. La estrategia comercial para la cual se diseñó el indicador ha demostrado su eficacia durante muchos años. La simplicidad de la estrategia comercial es su gran ventaja, que permite que incluso los operadores novatos negocien con éxito con ella. VR Cub calcula los puntos de apertura de posiciones
A machine translation from the English product description was used. We apologize for possible imprecisions. Se utilizó una traducción automática de la descripción del producto en inglés. Pedimos disculpas por posibles imprecisiones. Un sistema de visualización de patrones de acción de precios de velas japonesas favoritas. Una vez adjunto, el indicador marcará automáticamente los siguientes patrones en el gráfico: Barra de Pinocho (pinbar) - una barra de cuerpo pequeño con una 'nariz' larga, un
Owl smart levels
Sergey Ermolov
4.63 (54)
Versión MT5  |   FAQ El   Indicador Owl Smart Levels   es un sistema comercial completo dentro de un indicador que incluye herramientas de análisis de mercado tan populares como   los fractales avanzados de Bill Williams , Valable ZigZag que construye   la estructura de onda correcta   del mercado y   los niveles de Fibonacci   que marcan los niveles exactos de entrada. en el mercado y lugares para tomar ganancias. Descripción detallada de la estrategia Instrucciones para trabajar con el indi
Infinity Trend Pro
Yaroslav Varankin
1 (1)
This is a trend indicator without redrawing Developed instead of the binary options strategy (by the color of the Martingale candlestick) Also works well in forex trading When to open trades (binary options) A signal will appear in the place with a candle signaling the current candle It is recommended to open a deal for one candle of the current timeframe M1 and M5 When a blue dot appears, open a deal up When a red dot appears, open a trade down. How to open trades on Forex. When a signal is rec
Trend PA
Mikhail Nazarenko
5 (3)
The Trend PA indicator uses   Price Action   and its own filtering algorithm to determine the trend. This approach helps to accurately determine entry points and the current trend on any timeframe. The indicator uses its own algorithm for analyzing price changes and Price Action. Which gives you the advantage of recognizing, without delay, a new nascent trend with fewer false positives. Trend filtering conditions can be selected in the settings individually for your trading style. The indicator
Daily Candle Predictor es un indicador que predice el precio de cierre de una vela. El indicador está destinado principalmente para su uso en gráficos D1. Este indicador es adecuado tanto para el comercio de divisas tradicional como para el comercio de opciones binarias. El indicador se puede utilizar como un sistema de negociación independiente o puede actuar como una adición a su sistema de negociación existente. Este indicador analiza la vela actual, calculando ciertos factores de fuerza dent
HMA Trend Professional MT4
Pavel Zamoshnikov
4.63 (8)
Improved version of the free HMA Trend indicator (for MetaTrader 4) with statistical analysis. HMA Trend is a trend indicator based on the Hull Moving Average (HMA) with two periods. HMA with a slow period identifies the trend, while HMA with a fast period determines the short-term movements and signals in the trend direction. The main differences from the free version: Ability to predict the probability of a trend reversal using analysis of history data. Plotting statistical charts for analyz
Indicador de scalping de Forex que no vuelve a dibujar sus flechas. Funciona mejor en los plazos M5, M15, M30, H1. La configuración predeterminada es para el marco de tiempo M5. La siguiente imagen muestra un ejemplo de trabajo en el gráfico H1 con el valor del parámetro "período = 0,35". Puede descargar la versión demo y probarla usted mismo. Ahora usamos las señales de este indicador en casi todas nuestras estrategias de scalping. Según nuestros cálculos, la precisión de sus señales es de alr
BoxChart MT4
Evgeny Shevtsov
4.57 (7)
The market is unfair if only because 10% of participants manage 90% of funds. An ordinary trader has slim changes to stand against these "vultures". This problem can be solved. You just need to be among these 10%, learn to predict their intentions and move with them. Volume is the only preemptive factor that faultlessly works on any timeframe and symbol. First, the volume appears and is accumulated, and only then the price moves. The price moves from one volume to another. Areas of volume accumu
Cosmic Diviner X Planet
Olena Kondratenko
4 (2)
This unique multi-currency strategy simultaneously determines the strength of trends and market entry points, visualizing this using histograms on the chart. The indicator is optimally adapted for trading on the timeframes М5, М15, М30, Н1. For the convenience of users, the indicator renders the entry point (in the form of an arrow), recommended take profit levels (TP1, TP2 with text labels) and the recommended Stop Loss level. The take profit levels (TP1, TP2) are automatically calculated for
ZhiBiCCI MT4
Qiuyang Zheng
5 (1)
Los indicadores [ZhiBiCCI] son ​​adecuados para todos los ciclos de uso y también son adecuados para todas las variedades de mercado. [ZhiBiCCI] La línea verde sólida es una reversión de la divergencia alcista. La línea de puntos verde es una divergencia alcista clásica. [ZhiBiCCI] La línea continua hacia el rojo es una divergencia bajista inversa. La línea roja punteada es una divergencia bajista clásica. [ZhiBiCCI] puede configurarse en los parámetros (Alerta, Enviar correo, Enviar notif
New, more accurate version of the Xmaster indicator. More than 200 traders from around the world have conducted more than 15,000 tests of different combinations of this indicator on their PCs in order to get the most effective and accurate formula. And here we present to you the "Xmaster formula indicator forex no repaint" indicator, which shows accurate signals and does not repaint. This indicator also sends signals to the trader by email and push. With the arrival of each new tick, it constan
The indicator detects and displays Shark harmonic pattern (see the screenshot). The pattern is plotted by the extreme values of the ZigZag indicator (included in the resources, no need to install). After detecting the pattern, the indicator notifies of that by a pop-up window, a mobile notification and an email. The indicator highlights the process of the pattern formation and not just the complete pattern. In the former case, it is displayed in the contour triangles. After the pattern is comple
Trend Bilio - an arrow indicator without redrawing shows potential market entry points in the form of arrows of the corresponding color: upward red arrows suggest opening a buy, green down arrows - selling. The entrance is supposed to be at the next bar after the pointer. The arrow indicator Trend Bilio visually "unloads" the price chart and saves time for analysis: no signal - no deal, if an opposite signal appears, then the current deal should be closed. It is Trend Bilio that is considered
The indicator detects and displays 3 Drives harmonic pattern (see the screenshot). The pattern is plotted by the extreme values of the ZigZag indicator (included in the resources, no need to install). After detecting the pattern, the indicator notifies of that by a pop-up window, a mobile notification and an email. The indicator highlights the process of the pattern formation and not just the complete pattern. In the former case, it is displayed in the contour triangles. After the pattern is com
VR Grid
Vladimir Pastushak
4.57 (7)
El indicador VR Grid está diseñado para crear una cuadrícula gráfica con configuraciones definidas por el usuario. A diferencia de la cuadrícula estándar , VR Grid se utiliza para construir niveles circulares . Dependiendo de la elección del usuario, el paso entre los niveles de ronda puede ser arbitrario. Además, a diferencia de otros indicadores y utilidades, VR Grid mantiene la posición de la grilla incluso cuando cambia el período de tiempo o se reinicia el terminal. Las configuraciones, arc
FREE
Старый, добрый "AP" в версии трендового осциллятора. Это простой индикатор, который использует максимум возможностей языка MQL4. Но при этом он работает достаточно быстро даже на процессорах 1 Гигагерц и менее. При анализе следует обращать внимание на пересечение уровня 50, если вы намеренны использовать его как трендовый индикатор. Индикатор не перерисовывает, и работает на всех типах графиков и таймфреймах. Сделаны основные возможности оповещения, оповещения работают в обоих направлениях
PZ Trend Trading
PZ TRADING SLU
4.75 (4)
Trend Trading es un indicador diseñado para sacar el máximo provecho posible de las tendencias que tienen lugar en el mercado, mediante el cronometraje de retrocesos y rupturas. Encuentra oportunidades comerciales al analizar qué está haciendo el precio durante las tendencias establecidas. [ Guía de instalación | Guía de actualización | Solución de problemas | FAQ | Todos los productos ] Opere en los mercados financieros con confianza y eficiencia Aproveche las tendencias establecidas sin s
The indicator displays the data of the Stochastic oscillator from a higher timeframe on the chart. The main and signal lines are displayed in a separate window. The stepped response is not smoothed. The indicator is useful for practicing "manual" forex trading strategies, which use the data from several screens with different timeframes of a single symbol. The indicator uses the settings that are identical to the standard ones, and a drop-down list for selecting the timeframe. Indicator Parame
Heiken Ashi candle chart is an improved version of The Japanese candle chart, which can effectively filter the market "noise" of the Japanese candle chart. It is favored by many traders for its simplicity and intuition. For trend traders, the HA candle chart is a magic tool. Unlike the traditional Japanese candle chart, Heikenashi does not reflect the opening price, high price, low price and closing price of the market. Instead, Heikenashi calculates the value of a single K line in the dominant
Zig Zag 123
Stephen Reynolds
Zig Zag 123 tells us when a reversal or continuation is more likely by looking at the shift in supply and demand. When this happens a signature pattern appears known as 123 (also known ABC) will often break out in direction of higher low or lower high. Stop loss and take profit levels have been added. There is a panel that shows the overall performance of your trades for if you was to use these stop loss and take profit levels.  We get alerted if a pattern 123 appears and also if the price
Trend Ray
Andriy Sydoruk
The indicator shows the potential trend direction by cyclical-wave dependence. Thus, all the rays of the intersection will be optimal rays, in the direction of which the price is expected to move, taking into account the indicator period. Rays can be used as a direction for potential market movement. But we must not forget that the approach must be comprehensive, the indicator signals require additional information to enter the market.
The Chaikin Oscillator is a technical indicator developed by Marc Chaikin that combines price and volume data to measure the accumulation and distribution of a financial instrument. It aims to identify potential buying and selling opportunities in the market. The Chaikin Oscillator is calculated by subtracting a 10-day exponential moving average of the Accumulation Distribution Line (ADL) from a 3-day exponential moving average of the ADL. Here's how to use the Chaikin Oscillator indicator in tr
Los compradores de este producto también adquieren
Gann Made Easy
Oleg Rodin
4.92 (64)
Gann Made Easy es un sistema de comercio de Forex profesional y fácil de usar que se basa en los mejores principios de comercio utilizando la teoría del Sr. W. D. Gann. El indicador proporciona señales precisas de COMPRA y VENTA, incluidos los niveles de Stop Loss y Take Profit. Puede comerciar incluso sobre la marcha utilizando notificaciones PUSH. ¡Por favor, póngase en contacto conmigo después de la compra! ¡Compartiré mis consejos comerciales con usted y excelentes indicadores de bonificació
ACTUALMENTE 26% DE DESCUENTO ¡La mejor solución para cualquier operador novato o experto! Este indicador es una herramienta única, de alta calidad y asequible porque hemos incorporado una serie de características propias y una nueva fórmula. ¡Con sólo UN gráfico puede leer la Fuerza de la Divisa para 28 pares de Divisas! Imagínese cómo mejorará su operativa porque podrá señalar el punto exacto de activación de una nueva tendencia o de una oportunidad de scalping. Manual del usuario: haga
Dragon Multi Indicator MT4
Mansour Babasafary
5 (2)
74% discount for the next 10 buyers (original price $605): 1 left Get a 50% bonus by buying (or even renting) any of our products. After buying (or renting), send a message for more information. 3 Indicators in 1 indicator Strategy based on price action Made specifically for the best forex currency pairs Can be used in the best time frame of the market at a very reasonable price This indicator is basically 3 different indicatos . But we have combined these 3 indicators in 1 indicator so th
Atomic Analyst
Issam Kassas
5 (3)
En primer lugar, vale la pena enfatizar que este Indicador de Trading no repinta, no redibuja y no se retrasa, lo que lo hace ideal tanto para el trading manual como para el automatizado. Manual del usuario: configuraciones, entradas y estrategia. El Analista Atómico es un Indicador de Acción del Precio PA que utiliza la fuerza y el impulso del precio para encontrar una mejor ventaja en el mercado. Equipado con filtros avanzados que ayudan a eliminar ruidos y señales falsas, y aumentan el poten
TPSpro RFI Levels
Roman Podpora
4.87 (15)
A key element in trading is zones or levels from which decisions to buy or sell a trading instrument are made. Despite attempts by major players to conceal their presence in the market, they inevitably leave traces. Our task was to learn how to identify these traces and interpret them correctly. Reversal First Impulse levels (RFI)   -  Version MT5                INSTRUCTIONS                 RUS                 ENG                                       R ecommended to use with an indicator   -  
TPSproTREND PrO
Roman Podpora
4.76 (17)
TPSpro TRENDPRO  - is a trend indicator that automatically analyzes the market and provides information about the trend and each of its changes, as well as giving signals for entering trades without redrawing! The indicator uses each candle, analyzing them separately. referring to different impulses - up or down impulse. Exact entry points into transactions for currencies, crypto, metals, stocks, indices!  -  Version MT5               DETAILED DESCRIPTION        /       TRADING SETUPS           
Break and Retest
Mohamed Hassan
4.6 (10)
New update to V.4 where  Break & Retest automatically draws the take profit & stop loss levels and you also have more signals per day! ‍You can visually backtest Break & Retest to see how it behaved in the past!     Manual guide:   Click here $65  for only 2  copies left! Next price is $120 .  This Indicator only places quality trades when the market is really in your favor with a clear break and retest. Patience is key with this price action strategy! If you want more alert
Introduciendo       Indicador Quantum Trend Sniper   , el innovador indicador MQL5 que está transformando la forma en que identificas y negocias los cambios de tendencia. Desarrollado por un equipo de comerciantes experimentados con experiencia comercial de más de 13 años,       Indicador de francotirador de tendencia cuántica       está diseñado para impulsar su viaje comercial a nuevas alturas con su forma innovadora de identificar cambios de tendencia con una precisión extremadamente alta.
Quantum Breakout Indicator PRO
Bogdan Ion Puscasu
4.96 (26)
Introduciendo       Quantum Breakout PRO   , el innovador indicador MQL5 que está transformando la forma en que comercia con Breakout Zones. Desarrollado por un equipo de operadores experimentados con experiencia comercial de más de 13 años,   Quantum Breakout PRO   está diseñado para impulsar su viaje comercial a nuevas alturas con su innovadora y dinámica estrategia de zona de ruptura. El indicador de ruptura cuántica le dará flechas de señal en las zonas de ruptura con 5 zonas objetivo de
Ante todo, vale la pena enfatizar que esta Herramienta de Trading es un Indicador No Repintado, No Redibujado y No Retrasado, lo que la hace ideal para el trading profesional. Curso en línea, manual del usuario y demostración. El Indicador de Conceptos de Acción del Precio Inteligente es una herramienta muy potente tanto para traders nuevos como experimentados. Combina más de 20 indicadores útiles en uno solo, combinando ideas avanzadas de trading como el Análisis del Trader del Círculo Interio
¡Descubra el secreto para el comercio de Forex exitoso con nuestro indicador MT4 personalizado! ¿Alguna vez se ha preguntado cómo lograr el éxito en el mercado de Forex, obteniendo ganancias constantemente al tiempo que minimiza el riesgo? ¡Aquí está la respuesta que ha estado buscando! Permítanos presentar nuestro indicador MT4 patentado que revolucionará su enfoque para el comercio. Versatilidad única Nuestro indicador está especialmente diseñado para usuarios que prefieren las formacio
Scalper Inside PRO
Alexey Minkov
4.75 (57)
An exclusive indicator that utilizes an innovative algorithm to swiftly and accurately determine the market trend. The indicator automatically calculates opening, closing, and profit levels, providing detailed trading statistics. With these features, you can choose the most appropriate trading instrument for the current market conditions. Additionally, you can easily integrate your own arrow indicators into Scalper Inside Pro to quickly evaluate their statistics and profitability. Scalper Inside
FX Volume
Daniel Stein
4.6 (35)
Obtenga su actualización diaria del mercado con detalles y capturas de pantalla a través de nuestro Morning Briefing aquí en mql5 y en Telegram ! FX Volume es el PRIMER y ÚNICO indicador de volumen que proporciona una visión REAL del sentimiento del mercado desde el punto de vista de un bróker. Proporciona una visión impresionante de cómo los participantes institucionales del mercado, como los brokers, están posicionados en el mercado Forex, mucho más rápido que los informes COT. Ver esta info
Trend Screener
STE S.S.COMPANY
4.83 (88)
Indicador de tendencia, solución única e innovadora para el comercio y filtrado de tendencias con todas las funciones de tendencias importantes integradas en una sola herramienta. Es un indicador 100% sin repintar de marcos temporales y monedas múltiples que se puede usar en todos los símbolos/instrumentos: divisas, materias primas, criptomonedas, índices y acciones. Trend Screener es un indicador de seguimiento de tendencia eficiente que proporciona señales de tendencia de flecha con puntos en
Advanced Supply Demand
Bernhard Schweigert
4.92 (310)
¡Actualmente con 33% de descuento! ¡La mejor solución para cualquier tráder principiante o experto! Este indicador es una herramienta comercial única, de alta calidad y asequible, porque incorpora una serie de características patentadas y una nueva fórmula. Con esta actualización, podrá mostrar zonas de doble marco temporal. No solo podrá mostrar un marco temporal más alto, sino también mostrar ambos, el marco temporal del gráfico MÁS el marco temporal más alto: MOSTRANDO ZONAS ANIDADAS. A todos
Scalper Vault
Oleg Rodin
5 (28)
Scalper Vault es un sistema profesional de reventa que le brinda todo lo que necesita para una reventa exitosa. Este indicador es un sistema comercial completo que puede ser utilizado por operadores de divisas y opciones binarias. El marco de tiempo recomendado es M5. El sistema le proporciona señales de flecha precisas en la dirección de la tendencia. También le proporciona señales superiores e inferiores y niveles de mercado de Gann. Los indicadores proporcionan todo tipo de alertas, incluidas
Conviértase en un Breaker Trader y obtenga beneficios de los cambios en la estructura del mercado a medida que se invierte el precio. El indicador de ruptura de bloque de órdenes identifica cuándo una tendencia o movimiento de precio se acerca al agotamiento y está listo para revertirse. Le alerta sobre cambios en la estructura del mercado que generalmente ocurren cuando una reversión o un retroceso importante están a punto de suceder. El indicador utiliza un cálculo patentado que identific
El sistema PRO Renko es un sistema de trading de alta precisión especialmente diseñado para operar gráficos RENKO. Se trata de un sistema universal que se puede aplicar a diversos instrumentos de negociación. El sistema neutraliza eficazmente el llamado ruido de mercado, lo que le brinda acceso a señales de reversión precisas. El indicador es muy fácil de usar y solo tiene un parámetro responsable de la generación de señales. Puede adaptar fácilmente la herramienta a cualquier instrumento com
FX Power MT4 NG
Daniel Stein
5 (10)
Obtenga su actualización diaria del mercado con detalles y capturas de pantalla a través de nuestro Morning Briefing aquí en mql5 y en Telegram ! FX Power MT4 NG es la nueva generación de nuestro popular medidor de fuerza de divisas, FX Power. ¿Y qué ofrece este medidor de fuerza de nueva generación? Todo lo que le encantaba del FX Power original PLUS Análisis de fuerza de ORO/XAU Resultados de cálculo aún más precisos Períodos de análisis configurables individualmente Límite de cálculo persona
TrendDecoder Premium
Christophe Pa Trouillas
5 (3)
Identifique los rangos y los próximos movimientos probables   |  Obtenga las señales más tempranas y la fuerza de las Tendencias   |  Obtener salidas claras antes de reversión   |  Detecte los niveles de Fibo que el precio pondrá a prueba Indicador no repintado y no retardado - ideal para la trading manual y automatizada - adecuado para todos los activos y todas las unidades temporales Oferta por tiempo limitado >>   50% OFF Después de la compra, póngase en contacto con mi canal  para conocer lo
GOLD Impulse with Alert
Bernhard Schweigert
4.56 (9)
Este indicador es una super combinación de nuestros 2 productos Advanced Currency IMPULSE with ALERT  +   Currency Strength Exotics . ¡Funciona para todos los marcos de tiempo y muestra gráficamente el impulso de fuerza o debilidad para las 8 divisas principales más un Símbolo! Este Indicador está especializado en mostrar la aceleración de la fuerza de la divisa para cualquier símbolo como Oro, Pares Exóticos, Materias Primas, Índices o Futuros. Es el primero de su clase, cualquier símbol
¡Actualmente 20% OFF ! ¡La mejor solución para cualquier novato o trader experto! Este software funciona con 28 pares de divisas. Se basa en 2 de nuestros principales indicadores (Advanced Currency Strength 28 y Advanced Currency Impulse). Proporciona una gran visión general de todo el mercado de divisas. Muestra los valores de Advanced Currency Strength, la velocidad de movimiento de las divisas y las señales para 28 pares de divisas en todos los (9) marcos temporales. Imagine cómo mejorar
Este tablero es una herramienta de alerta para usar con el indicador de reversión de la estructura del mercado. Su propósito principal es alertarlo sobre oportunidades de reversión en marcos de tiempo específicos y también para volver a probar las alertas (confirmación) como lo hace el indicador. El tablero está diseñado para ubicarse en un gráfico por sí solo y funcionar en segundo plano para enviarle alertas sobre los pares y marcos de tiempo elegidos. Fue desarrollado después de que muchas p
TrendMaestro
Stefano Frisetti
5 (2)
note: this indicator is for METATRADER4, if you want the version for METATRADER5 this is the link:  https://www.mql5.com/it/market/product/108106 TRENDMAESTRO ver 2.4 TRENDMAESTRO recognizes a new TREND in the bud, he never makes mistakes. The certainty of identifying a new TREND is priceless. DESCRIPTION TRENDMAESTRO identifies a new TREND in the bud, this indicator examines the volatility, volumes and momentum to identify the moment in which there is an explosion of one or more of these data a
El panel de alertas RSI / TDI le permite monitorear los RSI a la vez (seleccionables por usted) en cada par principal que opere. Puedes usarlo de dos maneras: 1. Seleccione varios marcos de tiempo y el guión le mostrará cuándo hay varios marcos de tiempo que se extienden más allá de las condiciones comerciales normales. Un gran indicador de que el precio ha subido con fuerza recientemente, ya que ha alcanzado un nivel de sobrecompra o sobreventa en múltiples marcos de tiempo, por lo que p
Currency Strength Wizard es un indicador muy poderoso que le proporciona una solución todo en uno para operar con éxito. El indicador calcula el poder de este o aquel par de divisas utilizando los datos de todas las monedas en múltiples marcos de tiempo. Estos datos se representan en forma de índice de moneda fácil de usar y líneas eléctricas de moneda que puede usar para ver el poder de esta o aquella moneda. Todo lo que necesita es adjuntar el indicador al gráfico que desea operar y el indicad
on free demo press zoom out button to see back.. cnt number is bar numbers.you can change up to 3000 related to chart bars numbers. minimum value is 500. there is g value set to 10000. no need to change it. this indicator almost grail,no repaint and all pairs ,all timeframe indicator. there is red and blue histograms. if gold x sign comes on red histogram that is sell signal. if blue x sign comes on blue histogram that is buy signal. this indicator on thise version works all pairs.al timeframe
El indicador de reversión de ADR le muestra de un vistazo dónde se cotiza actualmente el precio en relación con su rango diario promedio normal. Recibirá alertas instantáneas a través de una ventana emergente, correo electrónico o push cuando el precio exceda su rango promedio y los niveles por encima de su elección para que pueda saltar rápidamente a retrocesos y reversiones. El indicador dibuja líneas horizontales en el gráfico en los extremos del rango promedio diario y también extensiones p
ACTUALMENTE 31% DE DESCUENTO Este indicador es una herramienta de transacción única, de alta calidad y asequible porque hemos incorporado una serie de características propias y una fórmula secreta. Con solo un gráfico, da Alertas para los 28 pares de divisas. ¡Imagina cómo mejorarás porque puedes identificar el punto de activación exacto de una nueva tendencia u oportunidad de crecimiento! Basado en nuevos algoritmos subyacentes , hace que sea aún más fácil identificar y confirmar operaciones po
Scientific trade
Aleksey Ivanov
5 (1)
An extremely convenient indicator that truly makes the process of making money on the exchange easy. It is based on the scientifically rigorous theory of the market developed by the author, the beginning of which is presented here .                The full algorithm of this indicator operation is presented in the article .               The indicator calculates the most probable price movement trajectory and displays it on the chart. Based on the predicted price movement trajectory
Otros productos de este autor
The script is created to save all graphic objects to a file, restore them from a file and delete all objects on the chart. Data is saved in the .csv file in the client terminal folder in the MQL4\files subfolder. If you do not specify a file name when saving or restoring objects, then the name of the current trading instrument, for example, EURUSD or USDJPY, will be used as it. To use a script, just drag and drop it onto the chart.
Скользящее среднее с уровнями, построенными на основе индикатора ATR. В отличие от обычных уровней с постоянным отклонением, которые можно добавить к Moving Average, в уровнях MA with ATR bands учитывается волатильность рынка. Основной вариант использования индикатора: покупать при пробое верхнего уровня, продавать - при пробое нижнего. ПАРАМЕТРЫ MA_Period : п ериод усреднения скользящей средней MA_Method : м етод усреднения   скользящей средней MA_Price : и спользуемая цена для скользящей сре
Индикатор отображает High-Low и Open-Close размеры свечей. Также по этим размерам можно построить простые скользящие средние. Линия скользящей средней строится по формуле: Линия MA = MA(Period) * Delta. Чтобы скрыть скользящую среднюю, достаточно установить ее период равным 0. Чтобы собрать статистику по размерам свечей, используйте скрипт Candle Size Stats . ПАРАМЕТРЫ Period_MA_HL: период  усреднения скользящей средней, построенной по размерам  High-Low свечей Delta_MA_HL: множитель для Hig
ZZ Histogram отображает длину и направление волны на ценовом графике. Минимальный размер волны задается в настройках. По своей сути данный индикатор - тот же зигзаг (можете скачать здесь ), который определяет ценовые волны не меньше определенной длины, но только в виде гистограммы. Это можно увидеть на скриншотах. Для сбора статистики по размерам ценовых волн используйте идикатор   Wave Size Stats . ПАРАМЕТРЫ MinWaveSize: минимальная длина волны, на которую реагирует индикатор. Для маленьк
Индикатор показывает количество и направление переходов цены между уровнями сетки. Шаг сетки устанавливается в настройках. Индикатор будет особенно полезен трейдерам, торгующим по Мартингейлу, как инструмент для определения оптимальной точки входа. ПАРАМЕТРЫ Step: размер шага сетки (например: step = 50, shift = 0, тогда уровни будут иметь значения ...1.1050, 1.1100, 1.1150...) Shift: сдвиг сетки (например: step = 50, shift = 25, тогда уровни будут иметь значения ...1.1075, 1.1125, 1.1175...)
Зигзаг строится по ценовым волнам, размер которых не меньше заданного в настройках. Индикатор не способен нарисовать две вершины (максимум и минимум) на одной свече, поэтому для определения волн небольших размеров следует использовать меньшие таймфреймы графика. Зигзаг в виде гистограммы можете скачать здесь . Для сбора статистики по размерам ценовых волн используйте идикатор   Wave Size Stats . ПАРАМЕТРЫ MinWaveSize: минимальный размер волны, на котором будет построено очередное плечо зиг
Гистограмма отображает длину ценовых волн, которые не меньше заданного размера. Индикатор наглядно показывает  направление коротких/длинных ценовых движений и динамику волатильности. Также Wave Size Histogram подойдет для поиска закономерностей в ценовых движениях. Например, после крупной волны (большое значение гистограммы) зачастую идет слабое движение цены в противоположную сторону (небольшое значение гистограммы), которое идеально пододит для торговли по Мартингейлу. Для сбора статистики п
Скрипт собирает статистику по размерам свечей и сохраняет данные в файл CSV. Каждая строка таблицы - это отдельная свеча с ее характеристиками: время, направление (1 - бычья/доджи, -1 - медвежья), размер верхней и нижней тени, размер тела и полный размер свечи. Индикатор, который отбражает размеры свечей, а также построенные по этим размерам скользящие средние, можно скачать здесь . ПАРАМЕТРЫ FileName:  имя файла, в который экспортируются данные. Если оставить поле пустым, то имя файла - "Ca
Скрипт собирает размеры всех ценовых волн на текущем графике, которые не меньше заданной величины, и сохраняет их в CSV файл. Каждая строка таблицы будет содержать дату/время окончания волны и ее размер. Если вам нужно знать размеры волн в реальном времени, то воспользуйтесь индикатором Wave Size into ZigZag , Wave Size Histogram  или ZZ Histogram . ПАРАМЕТРЫ MinWaveSize:  минимальный размер дял волн, которые попадут в статистику PositiveValues:   true  - в файл сохраняется только размер вол
Скрипт используется для сбора статистики по переходам цены между уровнями сетки, размер которой задается в настройках (смотрите индикатор Transitions between levels ). Данные записываются в CSV файл. Есть два режима сбора статистики: SeparateTransition - учитывается каждый отдельный переход (смотрите скриншот 2). Время перехода - время, когда цена коснулась нового уровня. Accumulation - в файл записывается количество однонаправленных переходов  (смотрите скриншот 4). Например, -7 - семь пеерех
Скрипт вычисляет коды свечей на текущем графике и сохраняет их в CSV файл. Таблица в файле состоит из двух колонок: дата/время свечи и ее код. Подробнее о коде свечи и об алгоритме его расчета читайте в описании к индикатору Candle Code . ПАРАМЕТРЫ FileName:   имя файла, в который экспортируются данные. Если оставить поле пустым, то имя файла - "Candle Code. ' ВАЛЮТНАЯ ПАРА' 'ТАЙМФРЕЙМ' "
Filtro:
No hay comentarios
Respuesta al comentario