TD Combo Metatrader 4
- Indicadores
- Samil Bozuyuk
- Versión: 1.2
- Activaciones: 20
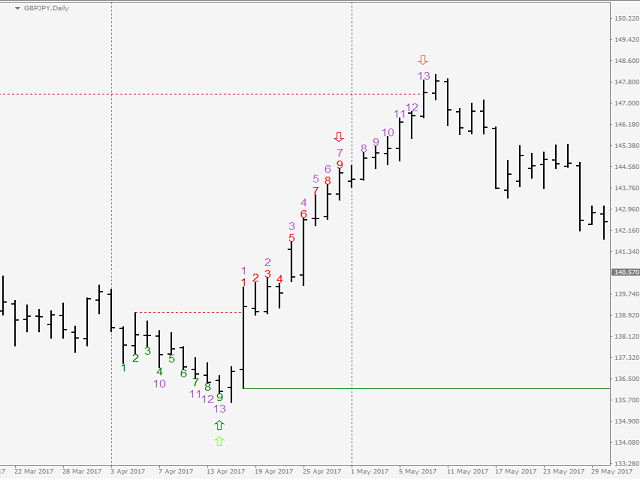
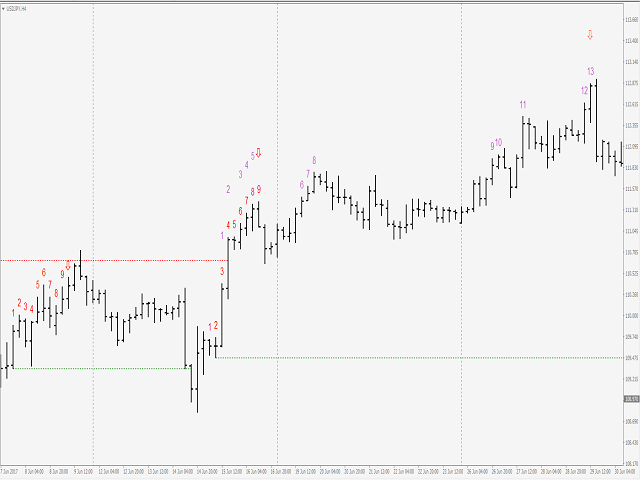
TD Combo is better when you have sharp directional moves, because it requires only thirteen price bars from start to finish compared to TD Sequential which needs at least 22 bars. The criteria for a Setup within TD Combo are the same with those required for a Setup within TD Sequential. The difference is that the count starts at bar 1 of the setup and not from bar 9 and TD Combo requires four conditions to be satisfied simultaneously.
Requirements for a TD Combo Buy Countdown
Requirements for a TD Combo Buy Countdown
- Close lower or equal than the low 2 trading days earlier.
- The low of a countdown day should be less than the previous "trading day‘s" low
- The close of a countdown day should be less than the previous "trading day‘s" close
- The close of a countdowns day should be less than the previous "countdowns day‘s" close
- Bars 11,12,13 each one should just close successively lower and the other rules above are not applied
** TD Combo Sell is the opposite of the above
For TD Combo Scanner MT4; please visit ► https://www.mql5.com/en/market/product/59018
For My Other Products; please visit ► https://www.mql5.com/en/users/samil34/seller
it is very good