MCDX Indicator
- Indicadores
- Sutthichai Mungdee
- Versión: 2.85
- Actualizado: 10 enero 2022
- Activaciones: 5
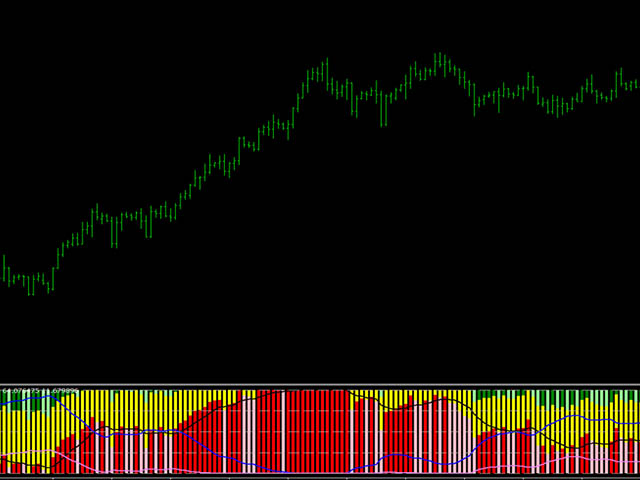
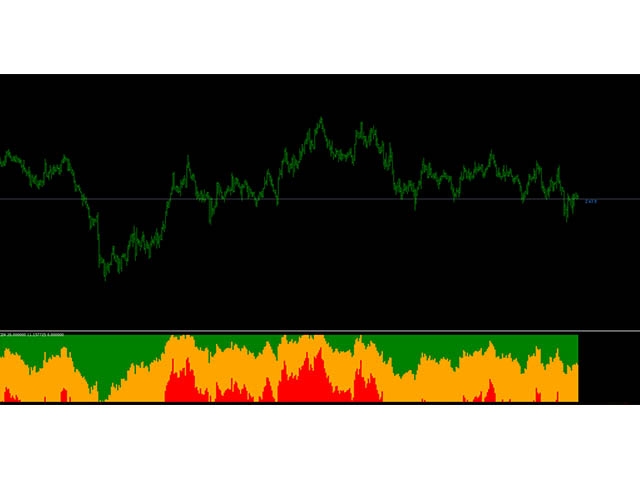
MCDX is an indicator based on specific formula to detect Buy and Sell momentum
Red Bar means Price go up and Buy momentum.
Green Bar means Price go down and Sell momentum"
Height of RED bar > 50% means Bull is in control. i.e. RED more than GREEN to go buy.
Lower of Green bar < 50% means Bear is in control. i.e. GREEN more than RED to go sell.
DARKER RED COLOR - STRONG Up Trend or Strong Bullish Power
LIGHTER RED COLOR - WEAK Up Trend or Weak Bullish Power
LIGHTER GREEN COLOR - STRONG Down Trend or Strong Bearish Power
DARKER GREEN COLOR - WEAK Down Trend or Weak Bearish Power
LIGHTER RED COLOR - WEAK Up Trend or Weak Bullish Power
LIGHTER GREEN COLOR - STRONG Down Trend or Strong Bearish Power
DARKER GREEN COLOR - WEAK Down Trend or Weak Bearish Power
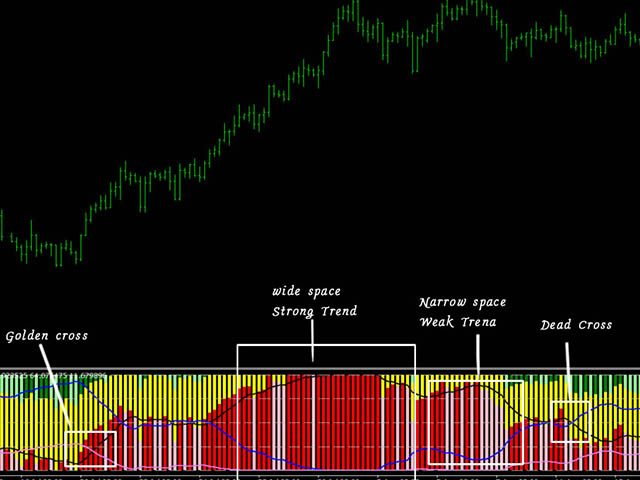
Has Alert Function when Golden Cross and Dead Cross.
GOLDEN CROSS
:-Red Bar's MA cross above Green Bar's MA
:-Red Bar's MA cross above Yellow Bar’s MA
:-Yellow Bar's MA cross above Green Bar's MA
DEAD CROSS
:-Red Bar's MA cross below Green Bar’s MA
:-Red Bar ’s MA cross below Yellow Bar’s MA
:-Yellow Bar’s MA cross below Green Bar's MA
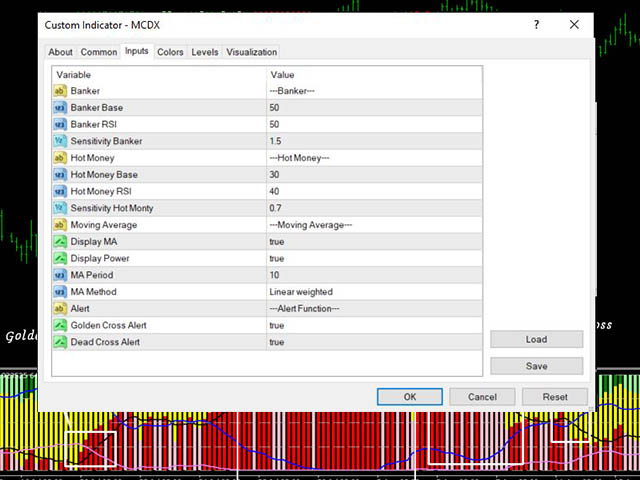
Default Settings
BankerBase = 50
BankerRSI = 50
SensitivityBanker = 1.5
HotMoneyBase = 30
HotMoneyRSI = 40
SensitivityHotMonty = 0.7
El usuario no ha dejado ningún comentario para su valoración