• Información general
  • Comentarios
  • Discusión
  • Novedades

TrendWatch

Brief description

TrendWatch indicator analyze chart trend strength and acceleration. Analysis is based on close price SMA with configurable period. Result is given as set of two curves in the indicator window. Blue (default color) curve identify trend direction and strength. Yellow curve (default color) identify trend tendency to accelerate/deceleare. Scale of curves is normed to maximal value in given time period. Both curves can be additionally smoothed using configurable SMA and/or set to zero if absolute value below set limit (to blank insignificant values). Raw and processes curves can be show simultaneously.

Ver. 2.0 update

Divergency mode has been added. Newly, slope and acceleration of two SMA can be shown. To enable the divergency mode, set "SMA period for base of divergency" parameter to required base SMA period. To detect pull-backs "SMA period for trend detection = 10", "SMA period for base of divergency = 200" is good choice. When "SMA period for base of divergency = 0", feature is dissabled.
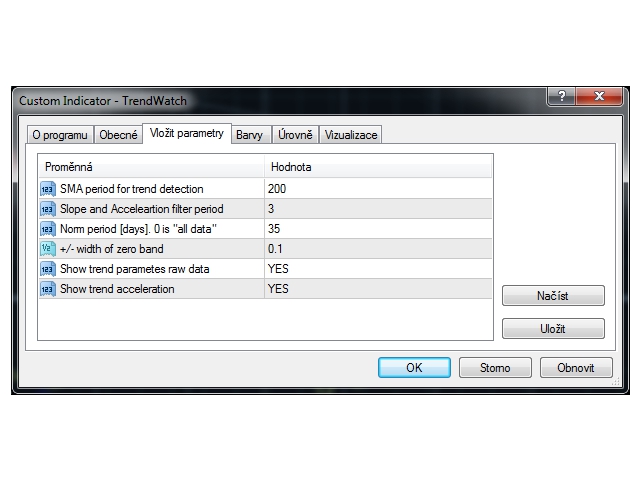
Parameters

  • SMA period for trend detection: Period of analyzed SMA. The higher value the more stable trend you get, but with higher time delay and less sensitivity for quick changes. Recomended range is <10, 200>.
  • SMA period for base of divergency: Period of divergency base SMA. If set to 0, feature is dissabled. For any other positive value the indicator show slope and acceleration of Trend SMA and Base SMA difference.
  • Slope filter period: Slope curve processing SMA filter period. Higher value - smoother curve, but higher time delay. Recomended range is <2, 25>. WARNING! slope filter period causes also acceleration curve shift.
  • Acceleration filter period: Acceleration curve processing SMA filter period. Higher value - smoother curve, but higher time delay. Recomended range is <2, 25>.
  • Norm period [days]. 0 is "all data": Time interval (from now) for trend and trend acceleration/deceleration maximum/minimum evaluation in [days]. Paramater has influence on curve scale. If set to "0", all available data rates will be used to detect max/min. There's following risk for "0" setting: If there's strong trend in the past, it will be taken as a norm and other trends will look "weak" in comparision.
  • +/- width of zero band: Size of band considered as zero value. Processed curve will be set to 0 if its absolute value below this limit. Recomended range is <0,0.1>
  • Show trend parametes raw data: Raw data curves (without additional SMA filtering and zero band nulls) will be also shown in the chart (as dot lines) if parameter set to "YES"
  • Show trend acceleration: Yellow (acceleration/deceleration) curve will be hidden, when set to "NO"

Meaning of values and combinations

Positive range of blue curve indicate up-trend, negative range indicate down-trend. Value of 1 (-1) indicate strongest up (down) trend in the selected time period.

Positive range of yellow curve indicate tendency of trend to get possitive: For up-trend it means acceleration and getting stronger, for down-trend it means deceleration and weakening.

Negative range of yellow curve indicate tendency of trend to get negative: For down-trend it means acceleration and getting stronger, for up-trend it means deceleration and weakening.

Range of yellow acceleration/deceleration curve is <-1, 1>. It's normed to the maximal acceleration/deceleration in selected time period.

Due to automatic curve scaling, values in range of aprox. <-0.1, 0.1> can be considered as zero on borh curves.

How to use

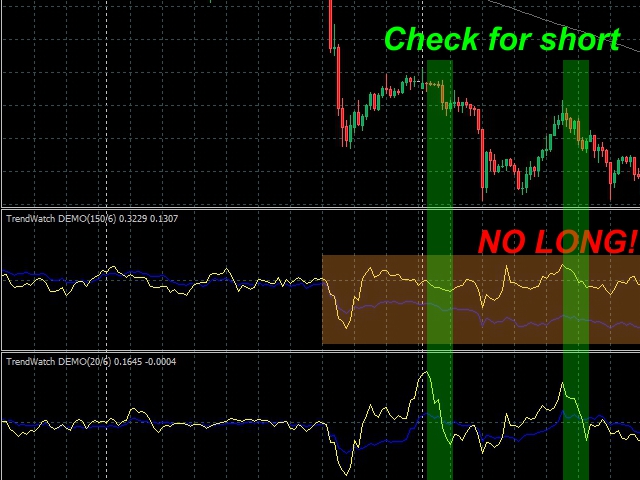
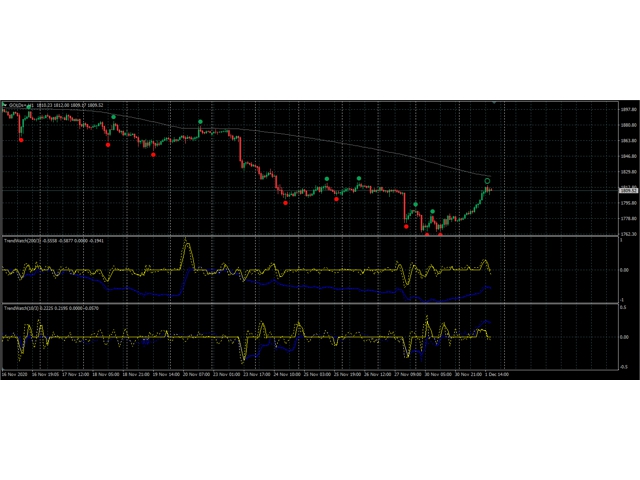
Good idea is to use two TrendWatch indicators with different SMA period setting. For example 150 for long-term trend and 20 for short-term trend. Trend is your friend: Don't try to go short when the long-term blue curve is positive; Don't try to go long, when the long-term blue curve is negative. For particular trade enter check the short-term blue and yellow curve. For short trade you want to see slightly positive to negative transition or zero on blue curve and ending positive impulse on yellow curve (and vice versa for long trade). Example is shown on screenshot

Free DEMO available:

For first experiences find restricted free version TrendWatch DEMO in free section.

Productos recomendados
Indicador Técnico para Detectar Patrones de Acción del Precio Fuertes: Pin Bar, Inside Bar y Outside Bar Introducción: En el ámbito del análisis técnico, los patrones de acción del precio son indicadores vitales de posibles movimientos en el mercado. Hemos desarrollado un sofisticado indicador técnico que agiliza la identificación de patrones sólidos de acción del precio en gráficos. Nuestro indicador se especializa en detectar tres patrones esenciales: el Pin Bar, el Inside Bar y el Outside Bar
Breakout FX
David Leander Tschacher
5 (1)
Breakout FX draws arrows and emits alarms if the price exceeds or falls below the previous n candles. ️ Breakout FX can be used in expert advisors. ️ Breakout FX can improve already existing trading strategies. ️ Breakout FX is very fast and is not repainting. Inputs Breakout Range [Candles] Breakout Price Type Arrow Size Enable Alerts Enable Push Notifications Enable Emails
Fibo Reversals is an indicator which has carefully been put together to attempt to indicate a time period in which an ongoing trend is most probably exhausted and a new trend (actually a reversal trend) inadvertently begins. At this, it should be okay for the manual trader to be on the look out for good trading opportunities. Input Settings Father Fibo  – This Input Determines The Highest Price For The Chosen Input Period. Son Fibo  - This Input Determines The Lowest Price For The Chosen Input
Matrixs
Andriy Sydoruk
Matrix is a Forex arrow indicator. Displays signals simply and clearly! The arrows show the direction of the transaction, and are colored accordingly, which can be seen in the screenshots. As you can see, trading with such an indicator is easy. I waited for an arrow to appear in the desired direction - I opened a deal. An arrow formed in the opposite direction - closed the deal. The indicator also displays the lines with the help of which the arrow signals are formed, taking into account the int
Con esta herramienta comercial, puede escanear 15 mercados simultáneamente. Presentamos el nuevo indicador comercial 2024: ️ Tablero Estocástico de marco de tiempo múltiple y moneda múltiple. Hay al menos dos razones por las que creé esta herramienta comercial: Primero, estoy aburrido de observar sólo un mercado. En segundo lugar, no quiero perder el momento de entrada en otro mercado. Por eso quiero conocer al mismo tiempo otras condiciones del mercado. Por este motivo, necesito u
Hello Guys! I want to share with you a very simple but very effective indicator, which I use a lot in my daily trading. Bollinger bands are one of the most effective tools in trading, especially for those who like to operate on low time frames and prefer fast operations. The indicator detects fast reversals: when the price close above or below the Bollinger Bands, but then re-enters in the Bands on the next candle, the indicator sends a signal and draws an arrow on the newly opened candle! It
Classical Divergence , Hidden Divergence both available . Enter a trade with the arrow on lower indicator. Nexus Divergence Pro is the best Divergence tool one can imagine with trade signals you will experience the super functionality. Needless to say how accurate divergence trading can be . Do your research on google you will understand its a standalone super accurate strategy.
BB System Dashbord
GIORGIO LIBERTI GARLET
SPECIAL PRICE  Great offers on all products. Great opportunities. BB System Dashboard is a dashboard that collects signals from the currencies you will select, or from all the currencies of your metatreder by setting the item Check all currency pairs. The buttons are clickable and open the desired chart. Whenever there is a signal, the dashboard warns you with a visual and audio signal. You can immediately open the chart and then open the position. This dashboard will help you to be more profi
Este indicador de múltiples osciladores, marcos de tiempo múltiples y símbolos múltiples identifica cuando ocurre una divergencia entre el precio y un oscilador / indicador. Identifica divergencias tanto regulares / clásicas (inversión de tendencia) como ocultas (continuación de tendencia). Tiene opciones de promedio móvil, RSI / Bollinger, ADX, barra de pines y filtro envolvente que hace posible filtrar solo las configuraciones más fuertes. Combinado con sus propias reglas y técnicas, este indi
PTT mt4
Natasha Diedericks
This indicator takes input from the RSI and a trend filter, and presents the output in a separate indicator window as a histogram. Great for scalping. Settings: TrendPeriod RSIPeriod Features Alerts. How to use: Simply attach to any chart Zoom chart in to get a better view of the histo color. Buy:  Blue histo color on multiple timeframes. (e.g,. M30-H1-H4) Sell: Red histo color  across on multiple timeframes. Or backtest and use as you see fit for your strategy. Best results on Major Pairs, bu
Infinity Trend Pro
Yaroslav Varankin
1 (1)
This is a trend indicator without redrawing Developed instead of the binary options strategy (by the color of the Martingale candlestick) Also works well in forex trading When to open trades (binary options) A signal will appear in the place with a candle signaling the current candle It is recommended to open a deal for one candle of the current timeframe M1 and M5 When a blue dot appears, open a deal up When a red dot appears, open a trade down. How to open trades on Forex. When a signal is rec
MACD Platinum
Kristmundur Roman Zakharii
This version of the MACD named MACD Platinum is the   MACD indicator calculated with ZeroLag moving averages (ZLEMA) .   ZLEMA is an abbreviation of   Zero Lag   Exponential   Moving Average . It was developed by John Ehlers and Rick Way. ZLEMA is a kind of Exponential   moving average   but its main idea is to eliminate the lag arising from the very nature of the   moving averages   and other trend following indicators.
A top-quality from the famous XSuper Trend indicator. It is completely loyal to the original algorithm, and implements many useful features Which includes Trend Indicators as Filters like MACD,CCI and Alligator. The Chefs Super Trend Plus Indicator is a great way to identify the current market trend. The indicator shows a clear distinction between uptrends and downtrends. The indicators has optional filters for sound signal. Suitable for the following trending pairs: EUR/USD, GBP/USD, USD/JPY,
ReviewCandleChart is a unique product that can verify past price fluctuations using candlestick charts. This indicator accurately reproduces market price fluctuations in the past and can make trading decisions (entries, profits, loss cut) many times so that you can learn the trading faster. ReviewCandleCahrt is the best indicator to improve trading skills. ReviewCandleCahrt caters to both beginners and advanced traders. Advantages of the indicator This Indicator for verifying price fluctuation u
RSI Divergence Scanner
Reza Aghajanpour
4.5 (14)
** All Symbols x All Timeframes scan just by pressing scanner button ** ***Contact me after purchase to send you instructions and add you in "RSI scanner group" for sharing or seeing experiences with other users. Introduction RSI divergence is a main technique used to determine trend reversing when it’s time to sell or buy because prices are likely to drop or pick in the charts. The RSI Divergence indicator can help you locate the top and bottom of the market. This indicator finds Regular div
Sto Signal AM
Andriy Matviyevs'kyy
5 (1)
This indicator displays Stochastic osc signals on the price chart and allows the user to receive notifications of such signals. The Stochastic indicator is a classic and proven indicator of the technical analysis of the markets. Despite its age, it is still relevant today. Depending on the settings, the indicator allows you to work effectively on various TFs and any markets. Signals are given on fully formed bars and are not redrawn. Custom Parameters: Stochastic_Price (0-1) - The applied pric
FREE
Presentamos el   detector de ruptura de volumen de la banda de Bollinger   , un potente indicador técnico diseñado para mejorar la popular   estrategia de ruptura de la banda de Bollinger   . Este indicador lleva el seguimiento de tendencias al siguiente nivel al incorporar datos de volumen, minimizando efectivamente las señales falsas. Al adherirse al principio de "el volumen confirma el precio", esta herramienta permite a los operadores identificar rupturas de precios acompañadas de aumentos s
Ticks ADX 4
Andrej Nikitin
The Average Directional Movement Index indicator drawn using a tick chart. After launching it, wait for enough ticks to come. Parameters: Period - period of averaging. Сalculated bar - number of bars on the chart for the indicator calculation. Buffer indexes: 0 - MAIN_LINE, 1 - PLUSDI_LINE, 2 - MINUSDI_LINE.
Trendiness Index
Libertas LLC
5 (3)
"The trend is your friend" is one of the best known sayings in investing, because capturing large trendy price movements can be extremely profitable. However, trading with the trend is often easier said than done, because many indicators are based on price reversals not trends. These aren't very effective at identifying trendy periods, or predicting whether trends will continue. We developed the Trendiness Index to help address this problem by indicating the strength and direction of price trend
Global Trend
Vitalii Zakharuk
Global Trend Indicator, shows the signals for entry. Displays both entry points and the trend itself. Shows statistically calculated moments for entering the market with arrows. When using the indicator, the risk factor can be optimally distributed. Settings: Uses all one parameter for settings. Choosing a parameter, it is necessary to visually resemble it so that the appropriate graph has a projection of extremes. Parameters: Length - the number of bars for calculating the indicator.
Trend Suffer
Philip Effiong Philip
Alerts you on new trends, with ENTRY and EXIT points. INSTRUCTIONS  Select asset of choice, activate the indicator on the chart and just follow the signals from the arrows. ITS FREE, GIVE ME A GOOD RATING! Platform : Metatrader4 Asset : All Currencies, Gold, BTCUSD, NASDAQ PS : F or newbie and pro traders. Used by more 3,000 traders around the world. Send  a mail for further help and information...........
Este indicador utiliza múltiples indicadores para generar operaciones de señales ganadoras El indicador R Signals es un completo sistema de negociación de divisas que imprime flechas precisas de compra y venta en el gráfico. El indicador aparece en la ventana principal del gráfico MT4 como flechas de color verde y rojo. El uso de señales generadas por un solo indicador puede ser riesgoso al operar. Esto se debe a que usar solo un indicador para operar puede dar más señales falsas. Por lo ta
Title : UT_Bot - ATR-Based Trading Indicator Introduction : Discover the power of "UT_Bot," the ultimate trading indicator that leverages the Average True Range (ATR) to provide unparalleled accuracy in your trading decisions. If you're seeking a more reliable alternative to the Super Trend indicator, look no further. UT_Bot is your key to precision trading. Key Features : ATR-Powered Precision: UT_Bot uses the ATR to deliver accurate signals that adapt to market volatility. Enhanced Trend Detec
VR Cub
Vladimir Pastushak
VR Cub es un indicador para obtener puntos de entrada de alta calidad. El indicador fue desarrollado para facilitar los cálculos matemáticos y simplificar la búsqueda de puntos de entrada a una posición. La estrategia comercial para la cual se diseñó el indicador ha demostrado su eficacia durante muchos años. La simplicidad de la estrategia comercial es su gran ventaja, que permite que incluso los operadores novatos negocien con éxito con ella. VR Cub calcula los puntos de apertura de posiciones
Owl smart levels
Sergey Ermolov
4.63 (54)
Versión MT5  |   FAQ El   Indicador Owl Smart Levels   es un sistema comercial completo dentro de un indicador que incluye herramientas de análisis de mercado tan populares como   los fractales avanzados de Bill Williams , Valable ZigZag que construye   la estructura de onda correcta   del mercado y   los niveles de Fibonacci   que marcan los niveles exactos de entrada. en el mercado y lugares para tomar ganancias. Descripción detallada de la estrategia Instrucciones para trabajar con el indi
Diamond PRO
Fanur Galamov
5 (15)
Diamond PRO is enhanced powerful version of Diamond for advanced traders. Pro version includes optimized cores, new impoved entry points filters, new multistage profit closure algorithm and сontains number of external control parameter that allows build and fine tune own tradind decisions and algorithms. The system provides more accurate market entries, analyzes and filters upcoming economic news, contains spread protection and an advanced position management algorithm. Main goal of Diamond PRO
Indicator for binary options arrow is easy to use and does not require configuration works on all currency pairs, cryptocurrencies buy signal blue up arrow sell signal red down arrow tips do not trade during news and 15-30 minutes before their release, as the market is too volatile and there is a lot of noise it is worth entering trades one or two candles from the current period (recommended for 1 candle) timeframe up to m 15 recommended money management fixed lot or fixed percentage of the depo
Laser Trend
Nicolas Zouein
The trend is your friend! This is what this indicator is all about. Follow this famous saying and be safe. Characteristics: Buy/Sell signals fixed on the close of a bar. Works on all symbols and all timeframes. Clear visual market trend laser line, Buy/Sell signal arrows, market strength meter, TP1 & TP2 boxes. Visual signals when to enter, when to exit the market. No repainting. Compatible with Flexible EA for trading automation. (Ask for a free set file optimized to perform 2010-2018) Para
Market Structure Zig Zag
Lesedi Oliver Seilane
4.8 (25)
Free Market structure zig zag to assist in price action trading the screenshots describe how to use and how to spot patterns new version comes with alerts, email alert and  push notification alert can be used on all pairs  can be used on all timeframes  you can add additional confirmation indicators the indicator shows you your higher high and low highs as well as your lower lows and lower highs  the indication makes price action analysis easier to spot.
FREE
New, more accurate version of the Xmaster indicator. More than 200 traders from around the world have conducted more than 15,000 tests of different combinations of this indicator on their PCs in order to get the most effective and accurate formula. And here we present to you the "Xmaster formula indicator forex no repaint" indicator, which shows accurate signals and does not repaint. This indicator also sends signals to the trader by email and push. With the arrival of each new tick, it constan
Los compradores de este producto también adquieren
Gann Made Easy
Oleg Rodin
4.93 (69)
Gann Made Easy es un sistema de comercio de Forex profesional y fácil de usar que se basa en los mejores principios de comercio utilizando la teoría del Sr. W. D. Gann. El indicador proporciona señales precisas de COMPRA y VENTA, incluidos los niveles de Stop Loss y Take Profit. Puede comerciar incluso sobre la marcha utilizando notificaciones PUSH. ¡Por favor, póngase en contacto conmigo después de la compra! ¡Compartiré mis consejos comerciales con usted y excelentes indicadores de bonificació
Atomic Analyst
Issam Kassas
5 (3)
En primer lugar, vale la pena enfatizar que este Indicador de Trading no repinta, no redibuja y no se retrasa, lo que lo hace ideal tanto para el trading manual como para el automatizado. Manual del usuario: configuraciones, entradas y estrategia. El Analista Atómico es un Indicador de Acción del Precio PA que utiliza la fuerza y el impulso del precio para encontrar una mejor ventaja en el mercado. Equipado con filtros avanzados que ayudan a eliminar ruidos y señales falsas, y aumentan el poten
ACTUALMENTE 26% DE DESCUENTO ¡La mejor solución para cualquier operador novato o experto! Este indicador es una herramienta única, de alta calidad y asequible porque hemos incorporado una serie de características propias y una nueva fórmula. ¡Con sólo UN gráfico puede leer la Fuerza de la Divisa para 28 pares de Divisas! Imagínese cómo mejorará su operativa porque podrá señalar el punto exacto de activación de una nueva tendencia o de una oportunidad de scalping. Manual del usuario: haga
TPSpro RFI Levels
Roman Podpora
4.8 (15)
Reversal First Impulse levels (RFI)    INSTRUCTIONS        RUS       -       ENG              R ecommended to use with an indicator   -   TREND PRO -  Version MT5 A key element in trading is zones or levels from which decisions to buy or sell a trading instrument are made. Despite attempts by major players to conceal their presence in the market, they inevitably leave traces. Our task was to learn how to identify these traces and interpret them correctly. Main functions: Displaying active zones
Scalper Inside PRO
Alexey Minkov
4.75 (57)
An exclusive indicator that utilizes an innovative algorithm to swiftly and accurately determine the market trend. The indicator automatically calculates opening, closing, and profit levels, providing detailed trading statistics. With these features, you can choose the most appropriate trading instrument for the current market conditions. Additionally, you can easily integrate your own arrow indicators into Scalper Inside Pro to quickly evaluate their statistics and profitability. Scalper Inside
Trend Punch
Mohamed Hassan
5 (6)
Manual guide:   Click here Starting price of  $88  for the first 25 copies only ( 1  left)! -- Next price is  $176 .  This indicator is unstoppable when combined with our other indicator called  Support & Resistance . After purchase, send us a message and you could get  it  for  FREE as a BONUS! I like to use Trend Punch on XAUUSD on the M1 timeframe!  Introducing Trend Punch , the revolutionary forex trend indicator that will transform the way you trade! Trend Punch is uniquely de
Advanced Supply Demand
Bernhard Schweigert
4.92 (311)
¡Actualmente con 33% de descuento! ¡La mejor solución para cualquier tráder principiante o experto! Este indicador es una herramienta comercial única, de alta calidad y asequible, porque incorpora una serie de características patentadas y una nueva fórmula. Con esta actualización, podrá mostrar zonas de doble marco temporal. No solo podrá mostrar un marco temporal más alto, sino también mostrar ambos, el marco temporal del gráfico MÁS el marco temporal más alto: MOSTRANDO ZONAS ANIDADAS. A todos
TPSproTREND PrO
Roman Podpora
4.78 (18)
TPSpro TRENDPRO  - is a trend indicator that automatically analyzes the market and provides information about the trend and each of its changes, as well as giving signals for entering trades without redrawing! The indicator uses each candle, analyzing them separately. referring to different impulses - up or down impulse. Exact entry points into transactions for currencies, crypto, metals, stocks, indices!  -  Version MT5               DETAILED DESCRIPTION                R ecommended to use with
Ante todo, vale la pena enfatizar que esta Herramienta de Trading es un Indicador No Repintado, No Redibujado y No Retrasado, lo que la hace ideal para el trading profesional. Curso en línea, manual del usuario y demostración. El Indicador de Conceptos de Acción del Precio Inteligente es una herramienta muy potente tanto para traders nuevos como experimentados. Combina más de 20 indicadores útiles en uno solo, combinando ideas avanzadas de trading como el Análisis del Trader del Círculo Interio
TrendMaestro
Stefano Frisetti
5 (3)
note: this indicator is for METATRADER4, if you want the version for METATRADER5 this is the link:  https://www.mql5.com/it/market/product/108106 TRENDMAESTRO ver 2.4 TRENDMAESTRO recognizes a new TREND in the bud, he never makes mistakes. The certainty of identifying a new TREND is priceless. DESCRIPTION TRENDMAESTRO identifies a new TREND in the bud, this indicator examines the volatility, volumes and momentum to identify the moment in which there is an explosion of one or more of these data a
Gold Stuff
Vasiliy Strukov
4.89 (257)
Gold Stuff: un indicador de tendencia diseñado específicamente para el oro, también se puede usar en cualquier instrumento financiero. El indicador no se vuelve a dibujar ni se retrasa. El marco de tiempo recomendado es H1. Este indicador está escrito por EA Gold Stuff Advisor, puede encontrarlo en mi perfil. IMPORTANTE! Póngase en contacto conmigo inmediatamente después de la compra para obtener instrucciones y bonificación! PARÁMETROS Draw Arrow - incl.desactivado. dibujar flechas en el grá
¡Descubra el secreto para el comercio de Forex exitoso con nuestro indicador MT4 personalizado! ¿Alguna vez se ha preguntado cómo lograr el éxito en el mercado de Forex, obteniendo ganancias constantemente al tiempo que minimiza el riesgo? ¡Aquí está la respuesta que ha estado buscando! Permítanos presentar nuestro indicador MT4 patentado que revolucionará su enfoque para el comercio. Versatilidad única Nuestro indicador está especialmente diseñado para usuarios que prefieren las formacio
Por supuesto, aquí tienes la traducción al español: Presentamos el Indicador de Astronomía para MT4: Tu Compañero Celestial Definitivo en el Trading ¿Estás listo para elevar tu experiencia de trading a alturas celestiales? No busques más allá de nuestro revolucionario Indicador de Astronomía para MT4. Esta innovadora herramienta trasciende los indicadores de trading tradicionales, aprovechando el poder de algoritmos complejos para proporcionarte una visión astronómica sin igual y cálculos de pre
Gann Swing Structure
Kirill Borovskii
5 (1)
This indicator is based on the mathematics of the great trader W.D. Ganna. With its help, you can easily find strong levels by analyzing swings to find the optimal entry point. The indicator works on all instruments and all timeframes. The indicator is fully manual and has control buttons. All you need to do is press the NEW button, a segment will appear, which you can place on any movement, swing or even 1 candle that you want to analyze. By placing the segment, press the OK button. A grid (th
Currency Strength Wizard es un indicador muy poderoso que le proporciona una solución todo en uno para operar con éxito. El indicador calcula el poder de este o aquel par de divisas utilizando los datos de todas las monedas en múltiples marcos de tiempo. Estos datos se representan en forma de índice de moneda fácil de usar y líneas eléctricas de moneda que puede usar para ver el poder de esta o aquella moneda. Todo lo que necesita es adjuntar el indicador al gráfico que desea operar y el indicad
Scalper Vault
Oleg Rodin
5 (29)
Scalper Vault es un sistema profesional de reventa que le brinda todo lo que necesita para una reventa exitosa. Este indicador es un sistema comercial completo que puede ser utilizado por operadores de divisas y opciones binarias. El marco de tiempo recomendado es M5. El sistema le proporciona señales de flecha precisas en la dirección de la tendencia. También le proporciona señales superiores e inferiores y niveles de mercado de Gann. Los indicadores proporcionan todo tipo de alertas, incluidas
Break and Retest
Mohamed Hassan
4.33 (12)
New update to V.4 where  Break & Retest automatically draws the take profit & stop loss levels and you also have more signals per day! ‍You can visually backtest Break & Retest to see how it behaved in the past!     Manual guide:   Click here $60 for a very limited time. Next price is $120   This Indicator only places quality trades when the market is really in your favor with a clear break and retest. Patience is key with this price action strategy! If you want more alert s
FX Power MT4 NG
Daniel Stein
5 (10)
Obtenga su actualización diaria del mercado con detalles y capturas de pantalla a través de nuestro Morning Briefing aquí en mql5 y en Telegram ! FX Power MT4 NG es la nueva generación de nuestro popular medidor de fuerza de divisas, FX Power. ¿Y qué ofrece este medidor de fuerza de nueva generación? Todo lo que le encantaba del FX Power original PLUS Análisis de fuerza de ORO/XAU Resultados de cálculo aún más precisos Períodos de análisis configurables individualmente Límite de cálculo persona
TrendDecoder Premium
Christophe Pa Trouillas
5 (5)
Identifique los rangos y los próximos movimientos probables   |  Obtenga las señales más tempranas y la fuerza de las Tendencias   |  Obtener salidas claras antes de reversión   |  Detecte los niveles de Fibo que el precio pondrá a prueba Indicador no repintado y no retardado - ideal para la trading manual y automatizada - adecuado para todos los activos y todas las unidades temporales Oferta por tiempo limitado >>   50% OFF Después de la compra, póngase en contacto con mi canal  para conocer lo
¡Actualmente 20% OFF ! ¡La mejor solución para cualquier novato o trader experto! Este software funciona con 28 pares de divisas. Se basa en 2 de nuestros principales indicadores (Advanced Currency Strength 28 y Advanced Currency Impulse). Proporciona una gran visión general de todo el mercado de divisas. Muestra los valores de Advanced Currency Strength, la velocidad de movimiento de las divisas y las señales para 28 pares de divisas en todos los (9) marcos temporales. Imagine cómo mejorar
Trend Screener
STE S.S.COMPANY
4.83 (88)
Indicador de tendencia, solución única e innovadora para el comercio y filtrado de tendencias con todas las funciones de tendencias importantes integradas en una sola herramienta. Es un indicador 100% sin repintar de marcos temporales y monedas múltiples que se puede usar en todos los símbolos/instrumentos: divisas, materias primas, criptomonedas, índices y acciones. Trend Screener es un indicador de seguimiento de tendencia eficiente que proporciona señales de tendencia de flecha con puntos en
Dragon Multi Indicator MT4
Mansour Babasafary
5 (4)
3 Indicators in 1 indicator Strategy based on price action Made specifically for the best forex currency pairs Can be used in the best time frame of the market at a very reasonable price This indicator is basically 3 different indicatos . But we have combined these 3 indicators in 1 indicator so that you can use 3 indicators at the lowest price. All three strategies are based on price action. But based on different trends. Long term, medium term and short term Attributes : No repaintin
Conviértase en un Breaker Trader y obtenga beneficios de los cambios en la estructura del mercado a medida que se invierte el precio. El indicador de ruptura de bloque de órdenes identifica cuándo una tendencia o movimiento de precio se acerca al agotamiento y está listo para revertirse. Le alerta sobre cambios en la estructura del mercado que generalmente ocurren cuando una reversión o un retroceso importante están a punto de suceder. El indicador utiliza un cálculo patentado que identific
ACTUALMENTE 31% DE DESCUENTO Este indicador es una herramienta de transacción única, de alta calidad y asequible porque hemos incorporado una serie de características propias y una fórmula secreta. Con solo un gráfico, da Alertas para los 28 pares de divisas. ¡Imagina cómo mejorarás porque puedes identificar el punto de activación exacto de una nueva tendencia u oportunidad de crecimiento! Basado en nuevos algoritmos subyacentes , hace que sea aún más fácil identificar y confirmar operaciones po
El sistema PRO Renko es un sistema de trading de alta precisión especialmente diseñado para operar gráficos RENKO. Se trata de un sistema universal que se puede aplicar a diversos instrumentos de negociación. El sistema neutraliza eficazmente el llamado ruido de mercado, lo que le brinda acceso a señales de reversión precisas. El indicador es muy fácil de usar y solo tiene un parámetro responsable de la generación de señales. Puede adaptar fácilmente la herramienta a cualquier instrumento com
FX Volume
Daniel Stein
4.6 (35)
Obtenga su actualización diaria del mercado con detalles y capturas de pantalla a través de nuestro Morning Briefing aquí en mql5 y en Telegram ! FX Volume es el PRIMER y ÚNICO indicador de volumen que proporciona una visión REAL del sentimiento del mercado desde el punto de vista de un bróker. Proporciona una visión impresionante de cómo los participantes institucionales del mercado, como los brokers, están posicionados en el mercado Forex, mucho más rápido que los informes COT. Ver esta info
El indicador de reversión de ADR le muestra de un vistazo dónde se cotiza actualmente el precio en relación con su rango diario promedio normal. Recibirá alertas instantáneas a través de una ventana emergente, correo electrónico o push cuando el precio exceda su rango promedio y los niveles por encima de su elección para que pueda saltar rápidamente a retrocesos y reversiones. El indicador dibuja líneas horizontales en el gráfico en los extremos del rango promedio diario y también extensiones p
M1 Arrow
Oleg Rodin
5 (14)
Una estrategia intradía basada en dos principios fundamentales del mercado. El algoritmo se basa en el análisis de volúmenes y ondas de precios utilizando filtros adicionales. El algoritmo inteligente del indicador da una señal solo cuando dos factores de mercado se combinan en uno. El indicador calcula ondas de cierto rango en el gráfico M1 utilizando los datos del marco de tiempo más alto. Y para confirmar la onda, el indicador utiliza el análisis por volumen. Este indicador es un sistema come
ICT, SMC, SMART MONEY CONCEPTS, SMART MONEY, Smart Money Concept, Support and Resistance, Trend Analysis, Price Action, Market Structure, Order Blocks, BOS/CHoCH,   Breaker Blocks ,  Momentum Shift,   Supply&Demand Zone/Order Blocks , Strong Imbalance, HH/LL/HL/LH,    Fair Value Gap, FVG,  Premium  &   Discount   Zones, Fibonacci Retracement, OTE, Buy Side Liquidity, Sell Side Liquidity, BSL/SSL Taken, Equal Highs & Lows, MTF Dashboard, Multiple Time Frame, BigBar, HTF OB, HTF Market Structure, 
ECM Channel MT4
Paulo Rocha
5 (1)
ECM Elite Channel is a volatility-based indicator, developed with a specific time algorithm, which consists of finding possible corrections in the market. This indicator shows two outer lines, an inner line (retracement line) and an arrow sign, where the channel theory is to help identify overbought and oversold conditions in the market. The market price will generally fall between the boundaries of the channel. If prices touch or move outside the channel, it's a trading opportunity. The
Otros productos de este autor
ContiStat restricted - Free DEMO version of the ContiStat indicator Free version of the indicator is ment as DEMO of full paid version. Full functionality is available, however The indicator work only on M30 chart period . Find the ContiStat indicator for full functionality Brief description The ContiStat indicator calculate statistic frequency of green (up) and red (down) movement in the chart and determine movement dynamics (silver curve). There are two key parameters to understand the Conti
FREE
ContiStat restricted - Free DEMO version of the ContiStat indicator Free version of the indicator is ment as DEMO of full paid version. Full functionality is available, however The indicator work only on M30 chart period . Find the ContiStat indicator for full functionality Brief description The ContiStat indicator calculate statistic frequency of green (up) and red (down) movement in the chart and determine movement dynamics (silver curve). There are two key parameters to understand the Cont
FREE
DataGrabber The database creator DataGrabber store selected instrument history to .csv files. It's purpose is to automatically create extensive history database. DataGrabber is added to the selected instrument chart window as an indicator. It periodically check presence of bar data on the server and presence of .csv files on client PC (local database). If missing files detected in local database, it's created, filled with data and added to the database. Range of bar history in days bee
ExtremeFinder
Matous Bartl
5 (1)
Description: ExtremeFinder analyze chart and find local extremes - maximum and minimum. Searched extreme is always of opposite type then previous. Local extreme is confirmed when price difference is higher then set price difference, but not sooner then after set number of candles. Two different types of Local extreme confirmation are performed: Normal for common Price changes, Quick for steep Price changes. Price difference to confirm local extreme can be set as absolute value, in percent of l
Brief description The ContiStat indicator calculate statistic frequency of green (up) and red (down) movement in the chart and determine movement dynamics (silver curve). There are two key parameters to understand the ContiStat principle: Block height and Block count . The ContiStat engine convert instrument price chart move to Blocks of constant height (price) regardles of how much time it take. Example 1: Block height is set to 50. DE30 index price make move from 15230 to 15443 in an hour. 4 g
Filtro:
No hay comentarios
Respuesta al comentario
Versión 2.0 2020.12.07
Major mod: SMA convergency feature has been added