• Información general
  • Comentarios (1)
  • Discusión (11)
  • Novedades

Peaks and Troughs

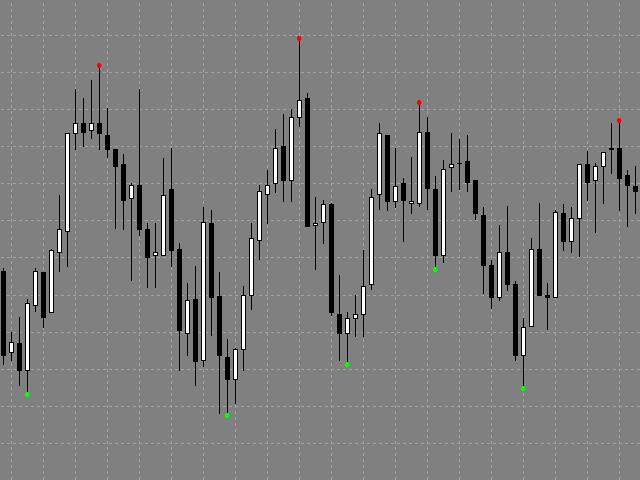
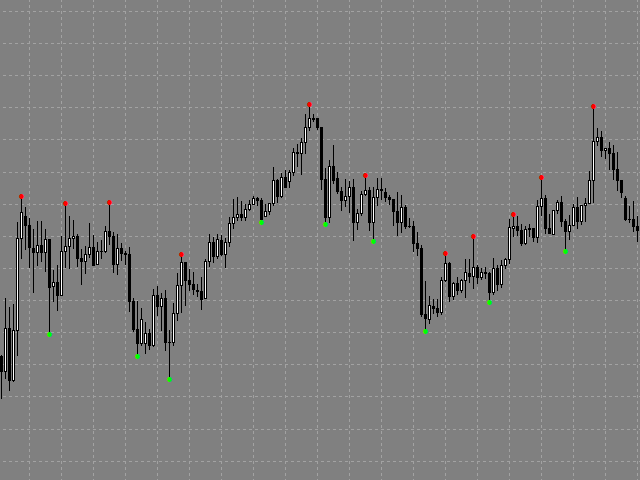
The indicator detects important peaks and troughs (extremes) on the chart.
These points can be used to plot support/resistance levels and trend lines, as well as any other graphical analysis.
These points can serve as reference points for setting trading orders.
The indicator does not redraw.

Settings:

  • Size_History - the size of the calculated history.
  • Num_Candles_Right - number of candles to the right of the peak or trough.
  • Num_Candles_Left - number of candles to the left of the peak or trough.
  • Type_Arrows_extremum - label style.
  • Send_Sound - sound alert. 
  • Send_Mail - send an email notification. 
  • Send_Notification - send a mobile notification. 
  • Send_Alert - standard terminal alert.
Productos recomendados
Auto Levels
Yaroslav Varankin
Auto Level this tool is able to determine the levels of support and resistance. search and display when the price has broken through the level and when it pushed off from it. the indicator can be useful if you use resistance support levels in your trading. or the highs and lows of the price, then it will greatly simplify your work and help you more quickly and more accurately determine the rebound or breakdown of the current trend or tendencies level. blue line bottom uptrend red line on top dow
This is a well-known ZigZag indicator. But it differs by the fact that its plot is based on values of the middle line which is set by a user. It can display Andrews’ Pitchfork and standard or Bobokus Fibo levels. NO REPAINTING. Parameters Period МА — middle line period. Default value is 34. Minimum value is 4. Maximum value is set at your discretion. Used to calculate price - base price to calculate the middle line. The averaging method - method of smoothing the middle line. Turning pitchfork
Introduction to X3 Chart Pattern Scanner X3 Cherart Pattern Scanner is the non-repainting and non-lagging indicator detecting X3 chart patterns including Harmonic pattern, Elliott Wave pattern, X3 patterns, and Japanese Candlestick patterns. Historical patterns match with signal patterns. Hence, you can readily develop the solid trading strategy in your chart. More importantly, this superb pattern scanner can detect the optimal pattern of its kind. In addition, you can switch on and off individu
The Master Figures indicator analyzed the market for the most common chart patterns. The first pattern is called Pin bar . This pattern can rightly be considered one of the most widespread. This pattern looks like a candle with a small body and large tail (wick). Once you see it on the chart, open a position against the wick. It is better to use the resistance lines for closing. Master Figures shows this pattern in the form of circles. A position should be opened when a new candle appears after
Reversal Pattern Pro
Boonyapagorn Rodvattanajinda
Reversal Patterns Pro Reversal Patterns Pro is a Price Action (PA) analytical tool that scans the reversal patterns.  - Finds and marks the most dependable Japanese candlestick patterns in real-time. - Supports all time frames (Best for Scalping) - Doesn't repaint making it an exceptional indicator for Expert Advisors. Input parameters : - Support & Resistance Mode ( true or false ) for enabling advanced filtering - Donchian Period - RSI Period - RSI Oversold Level - RSI Overbought Level - 
This Indicator was used on  EA  Advanced Fibo levels . Indicator is designed to trade for most popular Fibonacci strategy that's completely automated. It automatically identifies and show Entry levels included Support/ Resistance Zones , according to the time zone candle by Fibonacci levels. As well as the traditional Fibonacci tool also included. However, it is very user friendly rather than default available one. On the other hand one more tool included. It automatically identifies real Suppo
FREE
Индикатор ищет подобную ценовую структуру, сравнивая с последней ценовой структурой. Размер паттерна (грубо говоря количество переломов зигзага) настраивается (всегда меньше на 1, чем введено - нулевой перелом не считается). Все найденные совпадения отмечаются прямоугольником. Так же к паттернам существует быстрая навигация с помощью кнопочек "Next patt" и "Prev patt". В индикатор вшиты два индикатора типа ЗигЗа г : стандартный зигзаг и пользовательский , моей разработки. Параметры настройки ста
Este indicador detectará patrones armónicos dibujados en el gráfico mediante métodos manuales y automáticos. Agrega tu comentario, por favor. Notas: El indicador tiene un panel de control y guardará cada configuración (gráfico y marco de tiempo). Puedes minimizarlo para tener más espacio en el gráfico y presionar el botón de cierre para ocultar todos los datos del indicador en el gráfico si prefieres trabajar con otras herramientas de análisis. Cuando uses este indicador y cambies las configurac
Fibonacci SR Indicator Este indicador dibuja las líneas de soporte y resistencia. El producto se basa en los niveles de retroceso y expansión de Fibonacci (Fibonacci Retracement and Extension levels). El indicador toma en consideración múltiples combinaciones de los niveles de Fibonacci y dibuja las líneas de soporte/resistencia. En sus cálculos el indicador utiliza los valores de las crestas y los valles construidos por el indicador ZigZag. Si hace falta, también se puede mostrar el ZigZag en e
FREE
COG LR Osc AM
Andriy Matviyevs'kyy
The presented indicator allows you to determine potential entry points into the market and set protective orders at reasonable levels. This product can be useful for both beginners and experienced traders. The indicator is based on calculation methods proven by time and practicing traders. The indicator is calculated in two stages: At the first stage, linear regression (LR) of the selected price type is determined for a given number of chart periods. At the second stage, the obtained data is p
FREE
Pi
Vasja Vrunc
Professional Prediction Indicator Based on matching the history with selected pattern model and shows the most likely outcome. Pi indicator includes Pattern line, Scanned_Past line, Matching_Pattern line, Future_Predicted line, adjustable Model Band , and some other controls. This indicator is designed primarily for professional use and is very useful in the search for the probability of the results relating to the future. Note : The results depend on model_band and past_bars . They are appro
Este indicador ha sido diseñado para integrarse con la teoría de las Ondas de Elliott, proporcionando dos métodos distintos de operación: Trabajo Automático: En este modo, el indicador opera de manera autónoma al detectar las cinco ondas motrices en el gráfico de acuerdo con la teoría de las Ondas de Elliott. Ofrece predicciones e identifica zonas potenciales de reversión. Además, tiene la capacidad de generar alertas y mensajes push para notificar a los traders sobre desarrollos significativos
Introduction Harmonic Patterns are best used to predict potential turning point. Traditionally, Harmonic Pattern was identified manually connecting peaks and troughs points in the chart. Manual harmonic pattern detection is painfully tedious and not suitable for everyone. You are often exposed under subjective pattern identification with manual pattern detection. To avoid these limitations, Harmonic Pattern Plus was designed to automate your harmonic pattern detection process. The functionality
All Symbols   AND  All Time frames Scan                                                                                                                 Document Introduction   The ABCD is a basic harmonic pattern. The ABCD pattern is a visual, geometric chart pattern comprised of three consecutive price swings. It looks like a diagonal lightning bolt and can indicate an upcoming trading opp
The Grid Inside works on a counter trend mode, automatically opens a new order when it hits the price target due to the Fibonacci levels at 23.6 and 73.6. If the price goes the wrong way it opens another order with a calculated lot and position. All the positions are closed when it reaches the target profit defined on settings. As TGI does not use stop loss, I don't recommend you put on your account more than you can afford to lose, the higher the timeframe safer it gets. Once an order is trigge
Divergence Osw Metatrader 4
William Oswaldo Mayorga Urduy
DIVERGENCE OSW  (Para Metatrader 4) Este indicador trabaja sobre las divergencias y tiene las siguientes funciones: Generar una alerta cuando se produzca una divergencia. Crear lineas calculando el Stoploss y Takeprofit de acuerdo a ondas proyección de ondas inversas. Crea una flecha indicando la posible dirección del mercado. Las señales enviadas por el indicador son dadas cuando la vela termina. El Trader debe evaluar cada divergencia para tomar entradas. Configuraciones: Activación y desactiv
TrendControl is an arrow indicator of technical analysis for determining a trend, which can adjust to the price, is a graphical plot calculated using mathematical formulas, the initial data for which is a price chart. The indicator shows the direction of the trend, takes into account the minimum and maximum values ​​of the extreme candles on the chart, then brings them to the average and compares them with the past data. The principle of operation of the indicator is to automatically determin
The Icarus Auto Dynamic Support and Resistance  Indicator provides a highly advanced, simple to use tool for identifying high-probability areas of price-action automatically - without any manual input whatsoever. .  All traders and investors understand the importance of marking horizontal levels on their charts, identifying areas of supply and demand, or support and resistance. It is time-consuming and cumbersome to manually update all instruments, across all timeframes, and it requires regular
The indicator displays Renko bars on the chart, uses them to plot the ZigZag - trend lines connecting the local Lows and Highs of the price movement, and highlights them based on the Gartley patterns, showing the potential price reversal points. Renko - specialized display of the price action, in which the graph is displayed not every bar of the time frame, but only under the condition that the price had passed more than the specified number of points. Renko bars are not bound to a time frame, s
Fibonaccitools
Aymn Sʿyd Ahmd Hsn Alkwmy
Los retrocesos de Fibonacci son herramientas populares que los operadores pueden usar para dibujar líneas de soporte, identificar niveles de resistencia, colocar órdenes de stop-loss y establecer precios objetivo. Un retroceso de Fibonacci se crea tomando dos puntos extremos en un gráfico de acciones y dividiendo la distancia vertical por las razones clave de Fibonacci de 23.6%, 38.2%, 50%, 61.8% y 100%. El indicador de herramientas de Fibonacci dibujará herramientas de Fibonacci, p. Ej. Retroc
FiboRec
Alfred Kamal
This indicator depends on Fibonacci lines but there is a secret lines i used them, by using FiboRec indicator you will be able to know a lot of important information in the market such as: Features You can avoid entry during market turbulence. You can enter orders in general trend only. You will know if the trend is strong or weak. Signal Types and Frame used You can use this indicator just on H1 frame. Enter buy order in case Candle break out the square area and closed over it, at least 20
PZ 123 Pattern
PZ TRADING SLU
3.75 (4)
El patrón 123 es uno de los patrones de gráficos más populares, potentes y flexibles. El patrón se compone de tres puntos de precio: un fondo, un pico o valle, y un retroceso de Fibonacci entre 38.2% y 71.8%. Un patrón se considera válido cuando el precio se rompe más allá del último pico o valle, momento en el que el indicador traza una flecha, levanta una alerta y se puede colocar el comercio. [ Guía de instalación | Guía de actualización | Solución de problemas | FAQ | Todos los productos ]
Master Scalping M1 es un indicador innovador que utiliza un algoritmo para determinar la tendencia de forma rápida y precisa. El indicador calcula el tiempo de apertura y cierre de posiciones, los algoritmos del indicador le permiten encontrar los momentos ideales para ingresar a una operación (comprar o vender un activo), lo que aumenta el éxito de las transacciones para la mayoría de los comerciantes. Beneficios del indicador: Fácil de usar, no sobrecarga el gráfico con información innecesari
For this set of indicators 1. General information     - Calculates with high performance mathematical algorithms.     - Calculated from the price of candles     - The entry point of this order is filtered by the train EMA and the oscillator.     - Calculate the integrity of the candle 2. How does it work?     - You can see two types of order entry points: the notification on the monitor and the arrow.     - You can trust 75-95 percent of this entry point. 3. Settings     - A complete candle
VR Cub
Vladimir Pastushak
VR Cub es un indicador para obtener puntos de entrada de alta calidad. El indicador fue desarrollado para facilitar los cálculos matemáticos y simplificar la búsqueda de puntos de entrada a una posición. La estrategia comercial para la cual se diseñó el indicador ha demostrado su eficacia durante muchos años. La simplicidad de la estrategia comercial es su gran ventaja, que permite que incluso los operadores novatos negocien con éxito con ella. VR Cub calcula los puntos de apertura de posiciones
This indicator filters the Zigzag indicator to calculate the main support and resistance levels. Variables minimum gap between peaks : is the distance (GAP) between the peaks of the Zigzag peaks sensitivity : Minimum number of nearby peaks look back: it means that it has to test the last 50 peaks in the Zigzag object name perfix: a prefix for level’s line name on chart
FREE
The   ICT Unicorn Model   indicator highlights the presence of "unicorn" patterns on the user's chart which is derived from the lectures of   "The Inner Circle Trader" (ICT) . Detected patterns are followed by targets with a distance controlled by the user.   USAGE (image 2) At its core, the ICT Unicorn Model relies on two popular concepts, Fair Value Gaps and Breaker Blocks. This combination highlights a future area of support/resistance. A   Bullish Unicorn Pattern   consists ou
PZ Wedges
PZ TRADING SLU
3 (2)
Este indicador encuentra cuñas , que son patrones de continuación identificados por líneas de tendencia convergentes que rodean un período de consolidación de precios. Señala intercambios utilizando una ruptura de donchian junto con la ruptura de formación. [ Guía de instalación | Guía de actualización | Solución de problemas | FAQ | Todos los productos ] Fácil de usar Colores y tamaños personalizables. Implementa señales de arranque Implementa alertas de todo tipo. Uso óptimo Para ver cuñas
PZ Pennants
PZ TRADING SLU
Este indicador encuentra banderines , que son patrones de continuación identificados por líneas de tendencia convergentes que rodean un período de consolidación de precios. Las operaciones se señalan utilizando un período de ruptura junto con la ruptura de la formación. [ Guía de instalación | Guía de actualización | Solución de problemas | FAQ | Todos los productos ] Fácil de usar Colores y tamaños personalizables. Implementa señales de arranque Implementa alertas de todo tipo. Uso óptimo Pa
Indicator plots price cycle blocks and sends signals with smart volume confirmation. Price cycles and fractals are combined to determine the demand/supply blocks. The indicator can be used alone or combined with other Cycle Indicators Inputs: Period: Recommended value is between 35 and 55( Which are Set 1 and Set 2 periods of cycle sniper ) Engulfing: If true, you will be able to see the engulfing bar confirmation. Volume Filter: True (The  arrow comes with volume confirmation ) Videos with dif
Los compradores de este producto también adquieren
Atomic Analyst
Issam Kassas
5 (1)
En primer lugar, vale la pena enfatizar que este Indicador de Trading no repinta, no redibuja y no se retrasa, lo que lo hace ideal tanto para el trading manual como para el automatizado. El Analista Atómico es un Indicador de Acción del Precio PA que utiliza la fuerza y el impulso del precio para encontrar una mejor ventaja en el mercado. Equipado con filtros avanzados que ayudan a eliminar ruidos y señales falsas, y aumentan el potencial de trading. Utilizando múltiples capas de indicadores
ACTUALMENTE 26% DE DESCUENTO ¡La mejor solución para cualquier operador novato o experto! Este indicador es una herramienta única, de alta calidad y asequible porque hemos incorporado una serie de características propias y una nueva fórmula. ¡Con sólo UN gráfico puede leer la Fuerza de la Divisa para 28 pares de Divisas! Imagínese cómo mejorará su operativa porque podrá señalar el punto exacto de activación de una nueva tendencia o de una oportunidad de scalping. Manual del usuario: haga
TPSproTREND PrO
Roman Podpora
5 (15)
TPSpro TRENDPRO  - is a trend indicator that automatically analyzes the market and provides information about the trend and each of its changes, as well as giving signals for entering trades without redrawing! The indicator uses each candle, analyzing them separately. referring to different impulses - up or down impulse. Exact entry points into transactions for currencies, crypto, metals, stocks, indices!  -  Version MT5               DETAILED DESCRIPTION        /       TRADING SETUPS           
Introduciendo       Indicador Quantum Trend Sniper   , el innovador indicador MQL5 que está transformando la forma en que identificas y negocias los cambios de tendencia. Desarrollado por un equipo de comerciantes experimentados con experiencia comercial de más de 13 años,       Indicador de francotirador de tendencia cuántica       está diseñado para impulsar su viaje comercial a nuevas alturas con su forma innovadora de identificar cambios de tendencia con una precisión extremadamente alta.
Scalper Inside PRO
Alexey Minkov
4.75 (55)
SALE NOW! Limited Time Offer! An exclusive indicator that utilizes an innovative algorithm to swiftly and accurately determine the market trend. The indicator automatically calculates opening, closing, and profit levels, providing detailed trading statistics. With these features, you can choose the most appropriate trading instrument for the current market conditions. Additionally, you can easily integrate your own arrow indicators into Scalper Inside Pro to quickly evaluate their statistics and
Advanced Supply Demand
Bernhard Schweigert
4.92 (310)
¡Actualmente con 33% de descuento! ¡La mejor solución para cualquier tráder principiante o experto! Este indicador es una herramienta comercial única, de alta calidad y asequible, porque incorpora una serie de características patentadas y una nueva fórmula. Con esta actualización, podrá mostrar zonas de doble marco temporal. No solo podrá mostrar un marco temporal más alto, sino también mostrar ambos, el marco temporal del gráfico MÁS el marco temporal más alto: MOSTRANDO ZONAS ANIDADAS. A todos
TPSpro RFI Levels
Roman Podpora
5 (13)
A key element in trading is zones or levels from which decisions to buy or sell a trading instrument are made. Despite attempts by major players to conceal their presence in the market, they inevitably leave traces. Our task was to learn how to identify these traces and interpret them correctly. Reversal First Impulse levels (RFI)   -  Version MT5                INSTRUCTIONS                 RUS                 ENG                                       R ecommended to use with an indicator   -  
TrendMaestro
Stefano Frisetti
5 (2)
note: this indicator is for METATRADER4, if you want the version for METATRADER5 this is the link: TRENDMAESTRO recognizes a new TREND in the bud, he never makes mistakes. The certainty of identifying a new TREND is priceless. DESCRIPTION TRENDMAESTRO identifies a new TREND in the bud, this indicator examines the volatility, volumes and momentum to identify the moment in which there is an explosion of one or more of these data and therefore the moment in which prices have strong probability of f
¡Actualmente 20% OFF ! ¡La mejor solución para cualquier novato o trader experto! Este software funciona con 28 pares de divisas. Se basa en 2 de nuestros principales indicadores (Advanced Currency Strength 28 y Advanced Currency Impulse). Proporciona una gran visión general de todo el mercado de divisas. Muestra los valores de Advanced Currency Strength, la velocidad de movimiento de las divisas y las señales para 28 pares de divisas en todos los (9) marcos temporales. Imagine cómo mejorar
Presentamos el Indicador Milagroso de Forex: Desata el Poder del Trading Preciso ¿Estás cansado de buscar el mejor indicador de Forex que realmente ofrezca resultados excepcionales en todos los marcos temporales? ¡No busques más! Ha llegado el Indicador Milagroso de Forex para revolucionar tu experiencia de trading y llevar tus ganancias a nuevas alturas. Construido sobre una base de tecnología de vanguardia y años de desarrollo meticuloso, el Indicador Milagroso de Forex se erige como el pinácu
Entry Points Pro
Yury Orlov
4.7 (224)
Este es un genial indicador para MT4 que ofrece señales precisas para entrar en una transacción sin redibujar. Se puede aplicar a cualquier activo financiero: fórex, criptomonedas, metales, acciones, índices. Nos dará valoraciones bastante precisas y nos dirá cuándo es mejor abrir y cerra una transacción. Eche un vistazo  al vídeo  (6:22), ¡contiene un ejemplo de procesamiento de una sola señal que ha amortizado el indicador! La mayoría de los tráders mejoran sus resultados comerciales durante l
Quantum Breakout Indicator PRO
Bogdan Ion Puscasu
4.96 (26)
Introduciendo       Quantum Breakout PRO   , el innovador indicador MQL5 que está transformando la forma en que comercia con Breakout Zones. Desarrollado por un equipo de operadores experimentados con experiencia comercial de más de 13 años,   Quantum Breakout PRO   está diseñado para impulsar su viaje comercial a nuevas alturas con su innovadora y dinámica estrategia de zona de ruptura. El indicador de ruptura cuántica le dará flechas de señal en las zonas de ruptura con 5 zonas objetivo de
FX Power MT4 NG
Daniel Stein
5 (8)
Obtenga su actualización diaria del mercado con detalles y capturas de pantalla a través de nuestro Morning Briefing aquí en mql5 y en Telegram ! FX Power MT4 NG es la nueva generación de nuestro popular medidor de fuerza de divisas, FX Power. ¿Y qué ofrece este medidor de fuerza de nueva generación? Todo lo que le encantaba del FX Power original PLUS Análisis de fuerza de ORO/XAU Resultados de cálculo aún más precisos Períodos de análisis configurables individualmente Límite de cálculo persona
ACTUALMENTE 31% DE DESCUENTO Este indicador es una herramienta de transacción única, de alta calidad y asequible porque hemos incorporado una serie de características propias y una fórmula secreta. Con solo un gráfico, da Alertas para los 28 pares de divisas. ¡Imagina cómo mejorarás porque puedes identificar el punto de activación exacto de una nueva tendencia u oportunidad de crecimiento! Basado en nuevos algoritmos subyacentes , hace que sea aún más fácil identificar y confirmar operaciones po
Shepherd Harmonic Pattern
Abdullah Alrai
4.68 (59)
Este indicador detectará patrones armónicos que se dibujen en el gráfico mediante métodos manuales y automáticos. Puede consultar el manual del usuario en el siguiente enlace: Agregue su opinión y contáctenos para obtenerlo Existe una versión gratuita para probar este producto en mt4. Puede utilizarlo para detectar patrones de Gartley y Nenstar: https://www.mql5.com/en/market/product/30181 Puede comprar la versión completa de MT4 en: https://www.mql5.com/en/market/product/15212 Notas El indicad
FX Volume
Daniel Stein
4.6 (35)
Obtenga su actualización diaria del mercado con detalles y capturas de pantalla a través de nuestro Morning Briefing aquí en mql5 y en Telegram ! FX Volume es el PRIMER y ÚNICO indicador de volumen que proporciona una visión REAL del sentimiento del mercado desde el punto de vista de un bróker. Proporciona una visión impresionante de cómo los participantes institucionales del mercado, como los brokers, están posicionados en el mercado Forex, mucho más rápido que los informes COT. Ver esta info
Antes que nada, vale la pena enfatizar que este Sistema de Trading es un Indicador No Repintado, No Redibujado y sin Retardos, lo que lo hace ideal para el trading profesional. El "Sistema de Trading de Soporte y Resistencia Inteligente" es un indicador avanzado diseñado para traders nuevos y experimentados. Empodera a los traders con precisión y confianza en el mercado de divisas. Este sistema integral combina más de 7 estrategias, 10 indicadores y varios enfoques de trading, incluyendo estr
How to use Pair Trading Station Pair Trading Station is recommended for H1 time frame and you can use it for any currency pairs. To generate buy and sell signal, follow few steps below to apply Pair Trading Station to your MetaTrader terminal. When you load Pair Trading Station on your chart, Pair Trading station will assess available historical data in your MetaTrader platforms for each currency pair. On your chart, the amount of historical data available will be displayed for each currency pai
Cycle Sniper
Elmira Memish
4.41 (34)
NEW YEAR SALE PRICE FOR LIMITED TIME!!! Please contact us after your purchase and we will send you the complimentary indicators to complete the system Cycle Sniper is not a holy grail but when you use it in a system which is explained in the videos, you will feel the difference. If you are not willing to focus on the charts designed with Cycle Sniper and other free tools we provide, we recommend not buying this indicator. We recommend watching the videos about the indiactor and system before pu
PTS Precision Index Oscillator V2
PrecisionTradingSystems
5 (1)
El Oscilador de Índice de Precisión (Pi-Osc) de Roger Medcalf de Precision Trading Systems La versión 2 ha sido cuidadosamente recodificada para cargar rápidamente en su gráfico y se han incorporado algunas otras mejoras técnicas para mejorar la experiencia. El Pi-Osc fue creado para proporcionar señales precisas de temporización de operaciones diseñadas para encontrar puntos de agotamiento extremos, los puntos a los que los mercados se ven obligados a llegar solo para eliminar las órdenes
TakePropips Donchian Trend Pro
Eric John Pajarillaga Aldana
4.82 (17)
¡TakePropips Donchian Trend Pro   (MT4) es una herramienta poderosa y efectiva que detecta automáticamente la dirección de la tendencia utilizando el Canal Donchian y le proporciona señales comerciales de entrada y salida! Este indicador multifunción incluye un escáner de tendencias, señales comerciales, panel estadístico, filtro, sesiones comerciales y panel de historial de alertas. ¡Está diseñado para proporcionarle señales comerciales y ahorrarle horas analizando los gráficos! Puede descargar
PTS - Buscador de Compras por Divergencia de Precision Trading Systems El Buscador de Divergencias de Precisión fue diseñado para encontrar los mínimos del mercado con una precisión milimétrica y lo hace con frecuencia. En el análisis técnico, la habilidad de identificar mínimos generalmente es mucho más fácil que identificar máximos, y este elemento está diseñado precisamente para esa tarea. Después de identificar una divergencia alcista, es prudente esperar a que la tendencia se vuelva al
El Indicador de Venta PTS Divergence Finder de Roger Medcalf - Precision Trading Systems. Este indicador solo proporciona indicaciones bajistas - de venta. En primer lugar, muchas veces me han preguntado por qué no proporcioné un indicador de divergencia de venta mientras proporcionaba felizmente un buscador de divergencias de señal de compra durante muchos años. Di la respuesta de que las divergencias de venta son menos confiables que las divergencias de compra, lo cual sigue siendo cierto. Se
Up down v6T
Guner Koca
5 (1)
Thise indicator is up down v6  comes with tradingwiev version. purchased people, after installed on terminal ,contact me on mql5  to get BONUS  TradingView version. up-down indicator is no repaint and works all pairs and lower than weekly time frames charts. it is suitable also 1 m charts for all pairs. and hold long way to signal. dont gives too many signals. when red histogram cross trigger line that is up signal.and price probably will down when blue histogram cross trigger line that is dow
Price Action Entry Alerts
Stephen Sanjeeve Sahayam
5 (3)
Este indicador analiza cada barra en busca de presión de compra o venta e identifica 4 tipos de patrones de velas con el volumen más alto. Estas velas luego se filtran utilizando varios filtros lineales para mostrar señales de compra o venta. Las señales funcionan mejor, junto con una dirección de marco de tiempo más alta y cuando se negocian durante horas de alto volumen. Todos los filtros son personalizables y funcionan de forma independiente. Puede ver señales de una sola dirección con el cli
Blahtech Market Profile
Blahtech Limited
4.61 (18)
Was: $249  Now: $99   Market Profile defines a number of day types that can help the trader to determine market behaviour. A key feature is the Value Area, representing the range of price action where 70% of trading took place. Understanding the Value Area can give traders valuable insight into market direction and establish the higher odds trade. It is an excellent addition to any system you may be using. Blahtech Limited presents their Market Profile indicator for the MetaTrader community. Ins
XQ Indicator MetaTrader 4
Marzena Maria Szmit
3 (2)
Step into the realm of Forex trading with confidence and precision using XQ, a cutting-edge Forex indicator designed to elevate your trading game to unprecedented heights. Whether you're a seasoned trader or just stepping into the world of currency exchange,   XQ Forex Indicator   empowers you with the insights and signals needed to make informed trading decisions. The signal conditions are a combination of three indicators, and XQ Forex Indicator only display  medium and long-term trends . The
Quantum Heiken Ashi PRO MT4
Bogdan Ion Puscasu
4.43 (7)
Introduciendo el       Gráficos   Quantum Heiken Ashi PRO Diseñadas para brindar información clara sobre las tendencias del mercado, las velas Heiken Ashi son reconocidas por su capacidad para filtrar el ruido y eliminar las señales falsas. Diga adiós a las confusas fluctuaciones de precios y dé la bienvenida a una representación gráfica más fluida y confiable. Lo que hace que Quantum Heiken Ashi PRO sea realmente único es su fórmula innovadora, que transforma los datos de velas tradicionales en
Currency Strength Exotics
Bernhard Schweigert
4.88 (33)
¡ACTUALMENTE 20% DE DESCUENTO ! ¡La mejor solución para cualquier operador novato o experto! Este indicador está especializado en mostrar la fuerza de la divisa para cualquier símbolo como Pares Exóticos, Materias Primas, Índices o Futuros. Es el primero de su clase, cualquier símbolo se puede añadir a la 9 ª línea para mostrar la verdadera fuerza de la moneda de Oro, Plata, Petróleo, DAX, US30, MXN, TRY, CNH etc. Se trata de una herramienta de trading única, de alta calidad y asequible por
Presentamos ON Trade Waves Patterns Harmonic Elliot Wolfe, un indicador avanzado diseñado para detectar diversas formas de patrones en el mercado mediante métodos tanto manuales como automáticos. A continuación, te explicamos cómo funciona: Patrones Armónicos: Este indicador puede identificar patrones armónicos que aparecen en tu gráfico. Estos patrones son esenciales para los traders que practican la teoría del trading armónico, tal como se popularizó en el libro de Scott Carney "Harmonic Tradi
Otros productos de este autor
Scalper Assistant MT5
Pavel Verveyko
3.67 (3)
The indicator is a trading system for short-term trading. Scalper Assistant helps to determine the direction of the transaction, and also shows the entry and exit points. The indicator draws two lines (possible points for opening positions). At the moment of the breakdown of the upper line up (and when all trading conditions are met), an up arrow appears (a buy signal), as well as 2 goals. At the moment of the breakdown of the lower line down (and when all trading conditions are met), a do
The indicator displays the key support and resistance levels on the chart. The significance of these levels lies in that the price may reverse or strengthen the movement when passing such levels, since they are formed as a consequence of the natural reaction of market participants to the price movement, depending on which positions they occupied or did not have time to occupy. The psychology of the level occurrence: there always those who bought, sold, hesitated to enter or exited early. If the
Trend Sync
Pavel Verveyko
5 (2)
The indicator shows the trend of 3 timeframes: higher timeframe; medium timeframe; smaller (current) timeframe, where the indicator is running. The indicator should be launched on a chart with a timeframe smaller than the higher and medium ones. The idea is to use the trend strength when opening positions. Combination of 3 timeframes (smaller, medium, higher) allows the trend to be followed at all levels of the instrument. The higher timeframes are used for calculations. Therefore, sudden change
Turn
Pavel Verveyko
The indicator shows the market turning points (entry points). Reversals allow you to track rebound/breakout/testing from the reverse side of the lines of graphical analysis or indicators. Reversals can be an independent signal. The indicator allows you to determine reversals taking into account the trend and without it. You can choose a different period for the movement preceding the reversal, as well as the volatility coefficient. When plotting reversals, the indicator takes into account vola
Length Movement
Pavel Verveyko
5 (2)
Measures the length of the selected movement in points, shows the duration of the movement, as well as the speed of movement.   Outputs the average value of each dimension. It is designed to calculate the expected target based on typical market movements. The intended goal will provide information about the ratio of the stop size to the possible profit and will allow you not to open positions with a small expected profit. It will also help you determine the point at which it is more logical t
The indicator allows you to quickly switch from one instrument to another, from one time period to another using the keyboard or buttons on the monitor. Each command can be assigned a hot key from 0-9, a-Z (case-insensitive) and VK_OEM_COMMA ("<" on the keyboard) and VK_OEM_PERIOD (">" on the keyboard). This can help you to operate the maximum number of instruments that are available at your broker, analyze more instruments/periods in less time. This product cannot be tested in the tester , beca
Ratio TP SL
Pavel Verveyko
5 (1)
This indicator allows you to measure the profitability of each specific transaction (the ratio of Stop and Profit). The indicator allows you to adjust the ratio by step size and number of steps. You can build an unlimited number of ratios to compare the risks from different movements. Note: in MT4, the number of horizontal lines in a single ratio cannot exceed 32. Building a line : click the " Ratio " button and draw a line (mouse click - the first point of the line, where the mouse is relea
Corporate Report
Pavel Verveyko
5 (1)
The script displays info about the share's corporate reports and dividends. The data is downloaded from   investing.com : Report date Profit per share (EPS) Revenue Market capitalization Amount of dividends Date of payment of dividends Dividend income The product cannot be tested in the tester (since it is not possible to receive data from the Internet). Before launching:  Add 2   URL   https://ru.investing.com/earnings-calendar/Service/getCalendarFilteredData  and   https://ru.investing.com/
Channel FTF
Pavel Verveyko
5 (2)
The Envelopes indicator determines the presence of a trend or flat. It has 3 types of signals, shows the probable retracement levels and levels of the possible targets. The Fibonacci coefficients are used in the indicator's calculations. Signals (generated when touching the lines or rebounding from lines): Trend - the middle line of the Envelopes has a distinct inclination; the lines below the channel's middle line are used for buy trades, the lines above the middle line and the middle line itse
Mr Big
Pavel Verveyko
The indicator shows and highlights the chart candles, which are formed as a result of large players entering the market in large volumes. Such candles can also be formed after achieving a certainty on the market, when most of the participants hold positions in the same direction. The movement is likely to continue in that direction after such candles. The indicator highlights the significant candles from the existing ones on the chart; The indicator allows identifying the trends based on candles
Splash
Pavel Verveyko
The indicator identifies the most suitable moment for entering the market in terms of market volatility, when the market has the strength to move (the signal is indicated by an arrow under the candle). For each of the signals, the presence of trends on the current and higher timeframes is determined, so that the signal is in the direction of the majority of positions opened on the market (denoted near the signal by abbreviations of timeframes with a trend present). The signal appears after the c
The indicator displays the key support and resistance levels on the chart. The significance of these levels lies in that the price may reverse or strengthen the movement when passing such levels, since they are formed as a consequence of the natural reaction of market participants to the price movement, depending on which positions they occupied or did not have time to occupy. The psychology of the level occurrence: there always those who bought, sold, hesitated to enter or exited early. If the
This indicator is a multitimeframe trading strategy. It has the levels for stop loss, take profit and entry point. The order level can also be set manually. The indicator uses the regularity of the market, which manifests itself on all instruments, and does not require adjustment of the parameters. The strategy uses a proprietary approach to determining: trend, volatility, hierarchy of timeframe significance, the size of the history period (the number of candles), which is important for making a
Running along Lines
Pavel Verveyko
3.67 (3)
The indicator draws support and resistance lines on an important part of the chart for making decisions. After the trend line appears, you can trade for a breakout or rebound from it, as well as place orders near it. Outdated trend lines are deleted automatically. Thus, we always deal with the most up-to-date lines. The indicator is not redrawn . Settings: Size_History  - the size of the calculated history. Num_Candles_extremum  - the number of candles on each side of the extremum. Type_Ar
Key Volumes
Pavel Verveyko
1 (1)
The indicator shows key volumes confirmed by the price movement. The indicator allows you to analyze volumes in the direction, frequency of occurrence, and their value. There are 2 modes of operation: taking into account the trend and not taking into account the trend (if the parameter Period_Trend = 0, then the trend is not taken into account; if the parameter Period_Trend is greater than zero, then the trend is taken into account in volumes). The indicator does not redraw . Settings Histo
This trading system is based on market impulses of varying complexity.   To generate a signal, the indicator uses the moments when the direction of the pulse and the necessary section of the trend coincide. The indicator also takes into account the current market volatility. Stop_loss tags can be set with the parameter "0" or "1", then Stop_Loss will take into account market volatility.   Take_Profit tags can be set with the parameter "0", then Take_Profit will take into account market volat
Indexes
Pavel Verveyko
The stocks that make up the index are one of the drivers of the movement. Analyzing the financial performance of all elements of the index, we can assume further development of the situation. The program (script) displays corporate reports of shares that are part of the index selected in the settings.   "Indexes" cannot be tested in the tester (since there is no way to get information from the Internet). Information is downloaded from the site investing.com: Report Date Earnings per share
Fibo World
Pavel Verveyko
The indicator builds a graphical analysis based on the Fibonacci theory. Fibo Fan is used for the analysis of the impulses and corrections of the movement. Reversal lines (2 lines at the base of the Fibonacci fan) are used to analyze the direction of movements. The indicator displays the of 4 the target line in each direction. The indicator takes into account market volatility. If the price is above the reversal lines, it makes sense to consider buying, if lower, then selling. You can op
The indicator determines the state of the market: trend or flat. The state of the market is determined by taking into account volatility. The flat (trading corridor)is displayed in yellow. The green color shows the upward trend. The red color shows the downward trend. The height of the label corresponds to the volatility in the market. The indicator does not redraw . Settings History_Size   - the amount of history for calculation. Period_Candles  - the number of candles to calculate the
The indicator plots flexible support and resistance levels (dots). A special phase of movement is used for construction. Levels are formed dynamically, that is, each new candle can continue the level or complete it. The level can provide resistance or support to the price even where it is no longer there. Also, support and resistance levels can change roles. The importance of levels is affected by: the amount of time the level is formed and the number of touches. The significance of these l
The indicator is a trading system for short-term trading. Scalper Assistant helps to determine the direction of the transaction, and also shows the entry and exit points. The indicator draws two lines (possible points for opening positions). At the moment of the breakdown of the upper line up (and when all trading conditions are met), an up arrow appears (a buy signal), as well as 2 goals. At the moment of the breakdown of the lower line down (and when all trading conditions are met), a do
Gold n XAU
Pavel Verveyko
The trading system is designed to work with gold on time periods: 30M, 1H. The indicator allows you to adjust to the market situation. Parameters for 1H :   PERIOD=9F ,   FILTER=300 .   Parameters for  30M :   PERIOD=22B ,   FILTER=450 .   A small adjustment to a specific broker is allowed .   If you change the amount of history displayed, you may also need to adjust the parameters. The indicator is not redrawn.     "Gold n XAU" uses different rules for entering a trade and different ru
The indicator determines the most important component of any trading system - the possible exit point from the transaction. As the price moves, depending on the market situation, the indicator builds goals. The target becomes relevant when the price starts moving towards the target. If the movement is strong, then it may take a certain number of targets to stop or reverse price. The accumulation of targets is most likely able to stop the price. Some goals are executed several times. But the
The indicator builds "psychological levels": levels of round numbers and intermediate levels of round numbers. Round numbers play an important role in forming support and resistance levels. There is a pattern in which the decline or growth of the price can stop at round numbers. The level whose price ends at 0 is the level of a round number of the first order. Intermediate level, this is the level between two round levels, for example, between 10 and 20 this is level 15. In the " Num_Zero
Ichimoku Map (instant look at the markets) - built on the basis of the legendary Ichimoku Kinko Hyo indicator. The task of the Ichimoku Map is to provide information about the market strength on the selected time periods and instruments, from the point of view of the Ichimoku indicator. The indicator displays 7 degrees of buy signal strength and 7 degrees of sell signal strength. The stronger the trend, the brighter the signal rectangle in the table. The table can be dragged with the mouse. T
The indicator displays a stock chart of a non-standard type, in which the price and time have the same value. The usual chart of Japanese candlesticks does not take into account all the information that the time analysis can give. Renko charts do not use all the information that price can give in relation to time. The "Chart Price and Time" indicator takes into account price and time equally and shows the predominance of price or time. Taking into account price and time equally gives an i
The indicator tracks sharp volatility (moments when the market has shown increased activity and movement may occur), on the selected instruments and time periods. The information is displayed as colored rectangles. Thus, it is possible to assess at a glance which tool should be given priority attention. The indicator will be useful for scalpers when they need a quick reaction or for traders working with a large number of instruments. The indicator does not redraw. The indicator displays 8 degr
This program is designed to test ideas and acquire analytical skills. The main task of the analyst is to be able to predict the direction and range on the chart, where the price should soon come. This product cannot be tested in the tester. All the functionality is shown in full in the description and screenshots. How it works : Situations for analysis are selected at random. (The more historical data, the greater the number of examples). Click " Start Game ". Between the orange vertical li
The Alert Creator indicator is designed to create alerts for selected conditions. You can select one or several indicators for the notification. If several conditions are selected, the alert is triggered when all the selected conditions are met. The signals can be configured separately for buying and separately for selling. Example, a buy alert: the closing price is above the moving average, the RSI is below 20. (In this example, 2 indicators are used to generate an alert: MA and RSI) At
The indicator determines the strength of the trend and its possible reversal points, based on the author's arithmetic approach . Each new peak or trough is a trend development. Such peaks and troughs are numbered so that the strength of the trend development can be seen. Attempts to change the trend are also numbered. This gives an understanding of a possible change in the direction of the trend. Indicator signals are generated when trying to change the trend . In the settings, it is possib
Filtro:
mambobody
462
mambobody 2022.06.04 10:03 
 

El usuario no ha dejado ningún comentario para su valoración

Respuesta al comentario
Versión 1.5 2020.12.08
The Num_Candles_extremum parameter is divided into 2 parameters. Now you can select the number of candles to the left of the peak/trough and the number of candles to the right of the peak/trough separately.
Versión 1.4 2020.11.27
Overall improvement.
Versión 1.2 2020.09.06
Added settings:
sound alert.
send an email notification.
send a mobile notification.
standard terminal alert.
Versión 1.1 2020.05.04
Added new types of arrows.