Raff Channel MT5
- Indicadores
- Andrey Kaunov
- Versión: 1.1
- Activaciones: 10
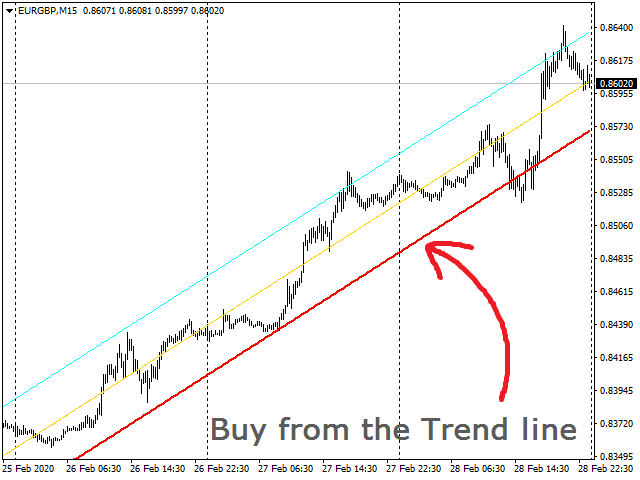
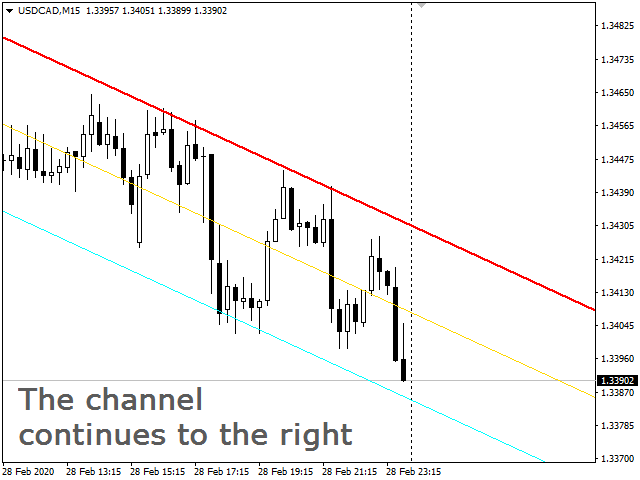
El indicador construye el canal de Raff sobre la base de la regresión lineal. La línea de tendencia roja se puede utilizar para tomar una decisión sobre la compra o venta en la dirección de la tendencia cuando el precio se acerca a la línea. Hay una posibilidad configurar el ancho del canal por el coeficiente de desviación de la línea de base o por el extremo máximo y mínimo. También se puede encender la continuación del canal a la derecha de los precios actuales.
El indicador del canal de regresión de Raff es una herramienta conveniente que facilita el trabajo del comerciante moderno. Se puede utilizar junto con otros indicadores en casi cualquier gráfico.
Parámetros de entrada:
Number of bars to calculate -Trend line Deviation -Resistance line Deviation -Use Trend line Deviation -Use Resistance line Deviation -Extend channel to the right -Base line width -Base line color -Trend line width -Trend line color -Resistance line width -Resistance line color -
Los buffers del indicador (para los programadores):
   SetIndexBuffer(0,Base_line);
   PlotIndexSetDouble(0,PLOT_EMPTY_VALUE,0.0);
   PlotIndexSetString(0,PLOT_LABEL,"Base Line");

   SetIndexBuffer(1,Trend_line);
   PlotIndexSetDouble(1,PLOT_EMPTY_VALUE,0.0);
   PlotIndexSetString(1,PLOT_LABEL,"Trend Line");

   SetIndexBuffer(2,Res_line);
   PlotIndexSetDouble(2,PLOT_EMPTY_VALUE,0.0);
   PlotIndexSetString(2,PLOT_LABEL,"Resist Line");