ParaboliseLINE
- Indicadores
- ANTON IVANOV
- Versión: 1.0
- Activaciones: 5
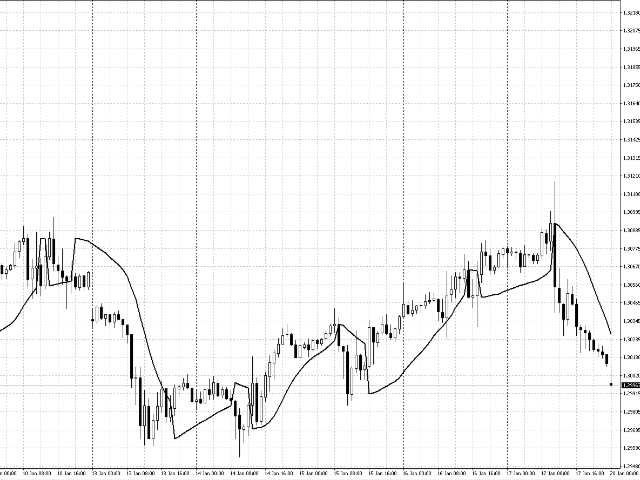
El
indicador habitual es Parabolic_Sar, pero se muestra en el gráfico no por puntos, sino por una línea, debido a esto hay una diferencia en
las señales, que puede afectar tanto mejor como peor, en cualquier caso, cuantos más filtros, más clara será la imagen del mercado.
Además, en este indicador, se proporciona una señal de audio cuando cambia la curva parabólica y la aparición de velas SAR.