Average Daily Range Board
- Indicadores
- Minh Nguyen Nam
- Versión: 1.1
- Actualizado: 12 marzo 2020
- Activaciones: 5
Average Daily Range with factor target and more functions (ADR)
Hello traders,
The upgraded ADR dashboard is much more better and more convenient for day trader, try it to experience the good things!
How to use Average Daily Range (ADR) Indicator?
ADR is just a simple indicator tool to help trader identify the daily average range of an instrument. So for example we have the pairs EURUSD and that pairs usually makes a peak and bottom during the trading day and the point from the bottom to the peak point of this trading trading day create a range for that day, in which the pairs usually moves within it for example 80 pips ( 800 points so counted with the fifth digit), and the distance from these two points from bottom to peak is measured in points; we have created that indicator based on the idea of the custom ATR indicator but we illustrate the products on a dashboard with digits to see; furthermore we add the functions for taking periods in days as average to calculate and also the alert functions, which will send to trader a notice that the usually average daily range of that instrument has been triggered. The illustration on a dashboard and the calculation thereof help the day trader a quick idea how many pips the instruments still have the free space to move up/down for the trading day.
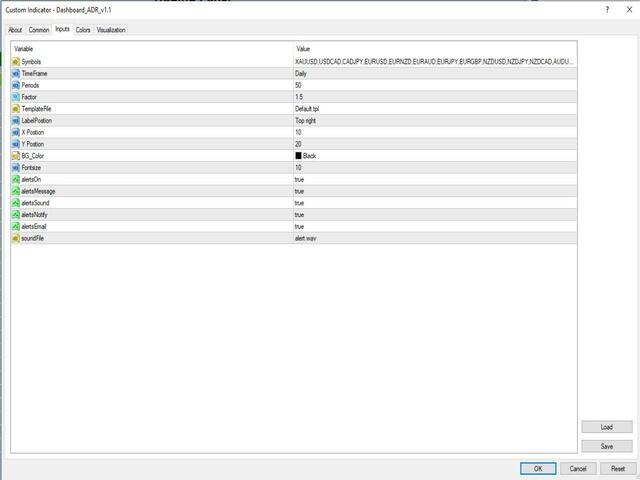
ADR Settings
- Symbols to put, each symbol must be separated with a semicolon
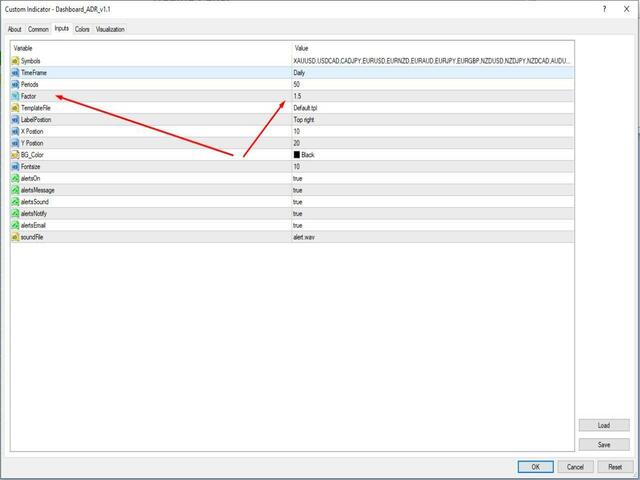
- Period: put number in day, 1= one day average calculate, 2= two days average calculate and so on...
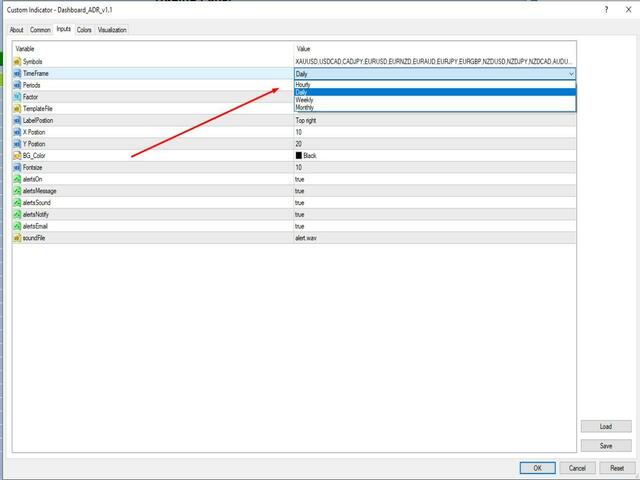
- Time frames: Hourly, Daily and Weekly, which will measure the range of hours counted from the current candle to the set periods, for example: chose hourly and put 5, means a range of 5 hours will be measured. So the same calculating for daily and weekly. Try it to experience.
- Factor: That means a set average period of range can put addition target factor you prefer to; for example: average of daily range for EURUSD for 50 periods of day would be 100 pips, you put factor 1.5 then your target will be 150 pips to send alert.
- Click on symbol: On the dashboard, just click on the Symbol, it will lead you to the chart of that symbol/open the chart window of that symbol. Just try it to experience.
- Position settings: you can set the dashboard to the corner of the chart window you prefer to.
- BG: select your own background color
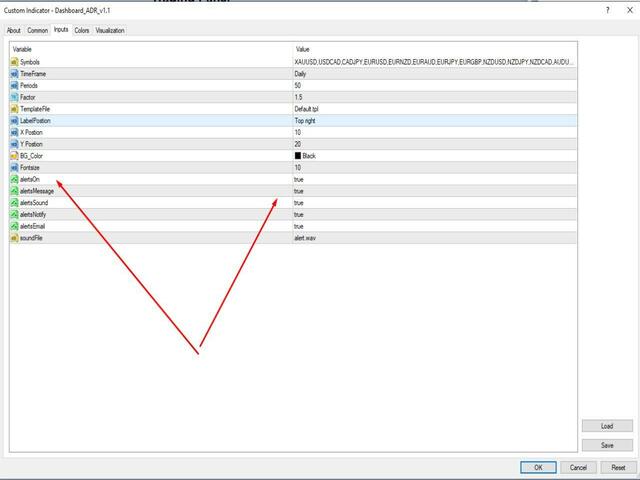
- Alerts: On/off
Alert and notification options
- Show pop-up messages - Set "true" to receive pop-up notifications
- Send an e-mail - Set "true" to receive a notification e-mail
- Send mobile notifications - Set "true" to receive mobile notifications
- Play an alert sound - Set "true" to receive an audible notification
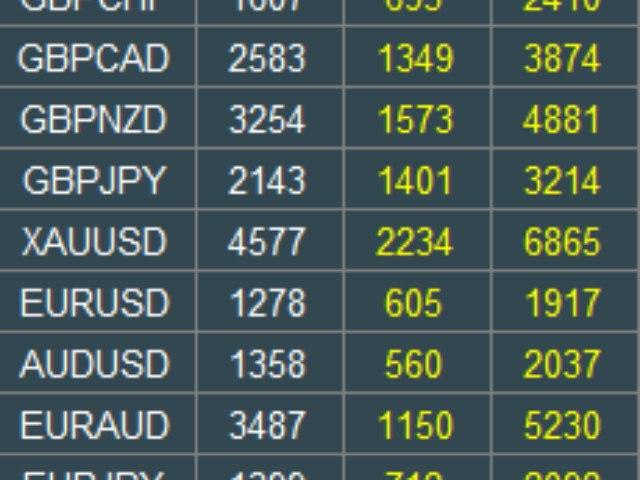
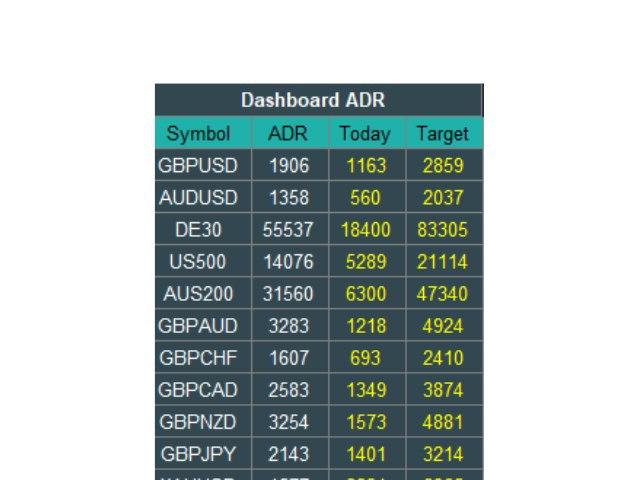
Display on chart
Dashboard with
- Symbols name
- Average Range
- Today has moved in XYZ points up to now
Happy Trading!
Tradingscenes


El usuario no ha dejado ningún comentario para su valoración