• Información general
  • Comentarios (2)
  • Discusión (14)
  • Novedades

Time And Sales Delta

5

The indicator displays the delta and the cumulative delta based on the "Time & Sales" deals list data.

In addition to the standard timeframes, the indicator displays data regarding the seconds timeframes (S5, S10, S15, S20, S30) to choose from.

Using the rectangle, user can select an arbitrary area in the indicator subwindow to view the ratio of the volumes of deals of buyers and sellers within this area.


Indicator features:


The indicator works correctly only on those trading symbols for which the list of deals "Time and Sales" is broadcast.

For trading symbols that have the tick history without the content of the list of deals, an interpretation algorithm is exist: 

  • Each positive Ask tick is interpreted as the unit of volume to buy. 
  • Each negative Bid tick is interpreted as the unit of volume to sell. 

This algorithm works in the mode Calculation=Interpretation and is relevant mainly for currency pairs.


Input variables:

    Ticks - size of history.
      Mode - indicator modes:
        • Chart - price chart.
        • Deals - volumes of buy and sell deals.
        • Delta - difference between the volumes of buy and sell deals.
        • CumDelta - cumulative difference between the volumes of buy and sell deals.
        ViewPoint - view point:
          • Limit - in terms of limit orders.
          • Market - in terms of market orders.
        Calculation - calculation mode:
          • Events - in units of deals events (in ticks).
          • Contracts - in units of volumes of deals (in contracts).
          • Interpretation - interpretation by ticks (see section "Indicator features").
            CumulativeStartTime - starting date/time for cumulative delta.
              CumulativePeriod - period for cumulative display of Mode list modes.
                ExceedanceContracts - from the list of deals will be taken deals with the volume not lower than the specified value.
                  Timing - recalculation frequency in seconds, if the value is zero it is assigned automatically.


                    The other input variables relate to the color settings, and their purpose becomes clear from their name.


                    Comentarios 2
                    Oleos
                    29
                    Oleos 2023.10.29 12:52 
                     

                    Отличный индикатор. Для меня было важно считывание данных с ленты. Не виснет. Отражает историю. Множество технических и визуальных настроек. Великолепная поддержка разработчика!

                    kramuse
                    37
                    kramuse 2021.02.03 10:34 
                     

                    Very well tunes indicator. Evgeny's designs are exceptional.

                    Productos recomendados
                    The indicator detects and displays М. Gartley's Butterfly pattern. The pattern is plotted by the extreme values of the ZigZag indicator (included in the resources, no need to install). After detecting the pattern, the indicator notifies of that by the pop-up window, a mobile notification and an email. The pattern and wave parameters are displayed on the screenshots. The default parameters are used for demonstration purposes only in order to increase the amount of detected patterns. Parameters
                    Follow The Line MT5
                    Oliver Gideon Amofa Appiah
                    4.4 (30)
                    This indicator obeys the popular maxim that: "THE TREND IS YOUR FRIEND" It paints a GREEN line for BUY and also paints a RED line for SELL. (you can change the colors). It gives alarms and alerts of all kinds. IT DOES NOT REPAINT and can be used for all currency pairs and timeframes. Yes, as easy and simple as that. Even a newbie can use it to make great and reliable trades. NB: For best results, get my other premium indicators for more powerful and reliable signals. Get them here: https://www.m
                    FREE
                    Free automatic Fibonacci is an indicator that automatically plots a Fibonacci retracement based on the number of bars you select on the BarsToScan setting in the indicator. The Fibonacci is automatically updated in real time as new highest and lowest values appears amongst the selected bars. You can select which level values to be displayed in the indicator settings. You can also select the color of the levels thus enabling the trader to be able to attach the indicator several times with differe
                    FREE
                    What is this indicator? This indicator is the MACD (Moving Average Convergence/Divergence) supporting Virtual Trading mode of  Knots Compositor . When the mode is turned on, the indicator will be recalculated based on the displayed candlesticks. When the mode is turned off, the indicator will be recalculated based on the original chart candlesticks. Types of the applied price - Close - Open - High - Low - Median Price (HL/2) - Typical Price (HLC/3) - Weighted Price (HLCC/4) KC-Indicators
                    FREE
                    El Capturador de Tendencias: La Estrategia del Capturador de Tendencias con Indicador de Alerta es una herramienta versátil de análisis técnico que ayuda a los traders a identificar las tendencias del mercado y los posibles puntos de entrada y salida. Presenta una Estrategia dinámica del Capturador de Tendencias, adaptándose a las condiciones del mercado para una clara representación visual de la dirección de la tendencia. Los traders pueden personalizar los parámetros para que se ajusten a s
                    FREE
                    PZ Penta O MT5
                    PZ TRADING SLU
                    4 (6)
                    The Penta-O is a 6-point retracement harmonacci pattern which usually precedes big market movements. Penta-O patterns can expand and repaint quite a bit. To make things easier this indicator implements a twist: it waits for a donchian breakout in the right direction before signaling the trade. The end result is an otherwise repainting indicator with a very reliable trading signal. The donchian breakout period is entered as an input. [ Installation Guide | Update Guide | Troubleshooting | FAQ | A
                    FREE
                    Donchian Channel DC is the indicator of Donchian Channels, that plots maximum and minimum values of a specific period, besides mean value line. It´s possible to configure simple period for analysis and the indicator will plot all three values. You can trade with this indicator as trend or reversal, according to each strategy. Do not let to test others indicators as soon as others expert advisors.
                    Owl Smart Levels MT5
                    Sergey Ermolov
                    4.49 (37)
                    Versión MT4  |  FAQ El Indicador Owl Smart Levels es un sistema comercial completo dentro de un indicador que incluye herramientas de análisis de mercado tan populares como los fractales avanzados de Bill Williams , Valable ZigZag que construye la estructura de onda correcta del mercado y los niveles de Fibonacci que marcan los niveles exactos de entrada. en el mercado y lugares para tomar ganancias. Descripción detallada de la estrategia Instrucciones para trabajar con el indicador Asesor de c
                    Important Lines
                    Terence Gronowski
                    4.88 (26)
                    Indicador de líneas importantes (M1 - M15) Este indicador muestra Líneas pivote, Día anterior alta y baja, Cierre día anterior y el mínimo y máximo de la hora anterior. Simplemente tiene que arrastrar ese único indicador al diagrama para tener todas esas líneas importantes. Puede evitar cargar muchos indicadores individuales. ¿Por qué ciertas líneas son tan importantes cuando se comercia? El día a día, alto y bajo: estos son observados por los comerciantes que comercian en un gráfico dia
                    FREE
                    ¡El nivel Premium es un indicador único con más del 80% de precisión de predicciones correctas! ¡Este indicador ha sido probado por los mejores especialistas en comercio durante más de dos meses! ¡El indicador del autor no lo encontrarás en ningún otro lugar! ¡A partir de las capturas de pantalla, puede ver por sí mismo la precisión de esta herramienta! 1 es ideal para operar con opciones binarias con un tiempo de vencimiento de 1 vela. 2 funciona en todos los pares de divisas, accion
                    Noize Absorption Index - is the manual trading system that measures the difference of pressure between bears forces and bulls forces. Green line - is a noize free index that showing curent situation. Zero value of index shows totally choppy/flat market.Values above zero level shows how powerfull bullish wave is and values below zero measures bearish forces.Up arrow appears on bearish market when it's ready to reverse, dn arrow appears on weak bullish market, as a result of reverse expectation.
                    Best SAR MT5
                    Ashkan Hazegh Nikrou
                    5 (1)
                    Descripción :  nos complace presentar nuestro nuevo indicador gratuito basado en uno de los indicadores profesionales y populares en el mercado de divisas (PSAR). Este indicador es una nueva modificación del indicador Parabolic SAR original. En el indicador pro SAR puede ver el cruce entre puntos y el gráfico de precios. el cruce no es una señal, pero habla sobre el final del potencial de movimiento, puede comenzar a comprar con un nuevo punto azul y colocar un límite de pérdidas un atr antes
                    FREE
                    Renko System
                    Marco Montemari
                    This indicator can be considered as a trading system. It offers a different view to see the currency pair: full timeless indicator, can be used for manual trading or for automatized trading with some expert advisor. When the price reaches a threshold a new block is created according to the set mode. The indicator beside the Renko bars, shows also 3 moving averages. Features renko mode median renko custom median renko 3 moving averages wicks datetime indicator for each block custom notificatio
                    El indicador construye cotizaciones actuales, que se pueden comparar con las históricas y, sobre esta base, hacer un pronóstico de movimiento de precios. El indicador tiene un campo de texto para una navegación rápida a la fecha deseada. Opciones: Símbolo - selección del símbolo que mostrará el indicador; SymbolPeriod - selección del período del cual el indicador tomará datos; IndicatorColor - color del indicador; HorisontalShift: cambio de cotizaciones dibujadas por el indicador
                    Order Book, known also as Market Book, market depth, Level 2, - is a dynamically updated table with current volumes of orders to buy and to sell specific financial instument at price levels near Bid and Ask. MetaTrader 5 provides the means for receiving market book from your broker, but in real time only, without access to its history. The indicator OrderBook Cumulative Indicator accumulates market book data online and visualizes them on the chart. In addition, the indicator can show the market
                    Mitimom
                    Danil Poletavkin
                    The indicator is based on Robert Miner's methodology described in his book "High probability trading strategies" and displays signals along with momentum of 2 timeframes. A Stochastic oscillator is used as a momentum indicator. The settings speak for themselves period_1 is the current timeframe, 'current' period_2 is indicated - the senior timeframe is 4 or 5 times larger than the current one. For example, if the current one is 5 minutes, then the older one will be 20 minutes The rest of the
                    FREE
                    LT Rainbow Trend
                    Thiago Duarte
                    5 (1)
                    Do you, like me, like to trade with the trend? Then this indicator will help you! Rainbow Trend is a trend indicator, which uses several Moving Averages on the chart. It measures different trend strenght zones for different periods: very long term, long term, mid term, short term and very short term. Each zone has its color, and it is possible to have sound alert when the prices leaves a zone and enters another. Its configuration is very simple. If you find any bug or have any suggestions, co
                    This indicator obeys the popular maxim that: "THE TREND IS YOUR FRIEND" It paints a Blue line for BUY and also paints a RED line for SELL. (you can change the colors). It gives alarms and alerts of all kinds. IT DOES NOT REPAINT COLOR and can be used for all currency pairs and timeframes. Yes, as easy and simple as that. Even a newbie can use it to make great and reliable trades. https://www.mql5.com/en/market/product/115553
                    Ichimoku Aiko MTF
                    Michael Jonah Randriamampionontsoa
                    Ichimoku Aiko MTF is a collection of technical indicators that show support and resistance levels, as well as momentum and trend direction. It is a multi-timeframe indicator so you don't need to change the chart timeframe when you want to see the ichimoku clouds on a higher timeframe.  eg. The chart timeframe is M15 and you want to see on the M15 timeframe chart the H1 ichimoku indicators (the ichimoku in Metatrader can't do that) that's why you need to use Ichimoku Aiko MTF.
                    This indicator is a zero-lag indicator and displays  strength of trend change . True Trend  Oscillator Pro works best in combination with True Trend Moving Average Pro that displays exact trend as is. Oscillator value is exact price change in given direction of the trend. True Trend Moving Average Pro: https://www.mql5.com/en/market/product/103586 If you set PERIOD input parameter to 1 this indicator becomes a sharpshooter for binary options. Developers can use True Trend Oscillator in E
                    FREE
                    La esencia del sistema consiste en la identificación del momento de formación de la vela compuesta "de vuelta" con características determinadas (tamaño de la vela en puntos, estructura de sombras).En el análisis de las velas japonesas el análogo de estas velas de vuelta son "Martillo" (Hammer) y "Hombre colgado" (Hanging Man), pero en este sistema el cuerpo de la vela no tiene que ser obligatoriamente pequeño, y la vela resultante se construye de varias velas. Parámetros de entrada del sistema:
                    FREE
                    Gartley Projections D
                    Oleksandr Medviediev
                    3 (2)
                    El indicador identifica los patrones armónicos (XABCD) según los desarrollos de H.M.Gartley ("Beneficios en el mercado de valores", 1935г). Proyecta el punto D como un punto en la proyección en perspectiva (especifique ProjectionD_Mode = true en la configuración). No vuelve a dibujar. Cuando se cierra una barra del período de trabajo, si el punto del patrón identificado no se ha movido durante las barras Patterns_Fractal_Bars, aparece una flecha en el gráfico (en la dirección del movimiento
                    Donchian Pro
                    Paulo Henrique Faquineli Garcia
                    5 (2)
                    The Donchian Channel Channels are among the most popular tools of technical analysis, as they visually convey to the analyst the limits within which most price movement tends to occur. Channel users know that valuable information can be obtained at any time, whether prices are in the central region of a band or close to one of the border lines. One of the best known techniques to explore these concepts is Bollinger Bands. However, John Bollinger was not the only one to research the applicatio
                    FREE
                    Are you tired of drawing trendlines every time you're analyzing charts? Or perhaps you would like more consistency in your technical analysis. Then this is for you. This indicator will draw trend lines automatically when dropped on a chart. How it works Works similar to standard deviation channel found on mt4 and mt5. It has 2 parameters: 1. Starting Bar 2. Number of bars for calculation The   starting bar   is the bar which drawing of the trend lines will begin, while the   number of bars for c
                    FREE
                    Este innovador indicador de medición de la fuerza de la moneda de INFINITY es un ayudante indispensable para los revendedores y comerciantes que negocian en el largo plazo. El sistema de Análisis de fortaleza / debilidad de las monedas ha sido conocido y utilizado en el mercado por los principales operadores del mundo. Cualquier comercio de arbitraje no está completo sin este análisis. Nuestro indicador determina fácilmente la fuerza de las monedas subyacentes entre sí. Muestra gráficos de líne
                    Half ma
                    Artem Svistunov
                    The Half ma arrow indicator for the MetaTrader 5 trading terminal is a simple but effective tool that gives a signal about a change in the current trend. The Half ma indicator looks like a solid dynamic line that changes color at the points where the trend changes. At these points, the indicator draws arrows of the corresponding color and direction.The Half ma arrow indicator for the MT5 terminal is not an independent source of input signals. It will be most effective to use it as a trend filte
                    Tops and Bottoms Indicator
                    Josue De Matos Silva
                    4.8 (5)
                    Tops & Bottoms Indicator FREE   Tops abd Bottoms:   An effective indicator for your trades The tops and bottoms indicator helps you to find  ascending and descending channel formations with indications of ascending and/or descending tops and bottoms. In addition, it  show possibles  opportunities with a small yellow circle when the indicator encounters an impulse formation. This indicator provide to you  more security and speed in making entry decisions. Also test our FREE advisor indicator:
                    FREE
                    El indicador calcula y traza automáticamente los niveles de soporte y resistencia de Fibonacci, una de las herramientas más efectivas para el análisis de mercado. El cálculo utiliza los datos de precios promediados para el período y el marco de tiempo seleccionados. El mínimo y el máximo para este período se toman como inicio y final del movimiento. Los niveles de Fibonacci le permiten ver puntos de referencia potenciales, alrededor de los cuales el movimiento del precio puede ralentizarse o rev
                    LT Donchian Channel
                    Thiago Duarte
                    4.75 (4)
                    Donchian Channel is an indicator created by Richard Donchian. It is formed by taking the highest high and the lowest low of the last specified period in candles. The area between high and low is the channel for the chosen period. Its configuration is simple. It is possible to have the average between the upper and lower lines, plus you have alerts when price hits one side. If you have any questions or find any bugs, please contact me. Enjoy!
                    FREE
                    Easy GOLD MT5
                    Franck Martin
                    4.91 (11)
                    Easy Gold is the latest addition to the BotGPT family. It is surprising and very powerful. It is ideal for beginners due to its simplicity.  There is absolutely nothing to do, it's 100% automated, simply indicate the percentage of risk you want to take per trade and the EA is ready. Whatever your capital, the EA takes care of everything. Optimized on (XAUUSD).  Unleash all the power with the professional version (AGI Gold) and its connection to the neural network, available in my store. My othe
                    FREE
                    Los compradores de este producto también adquieren
                    Primero que todo, vale la pena enfatizar que este Sistema de Trading es un Indicador No Repintado, No Redibujado y No Retrasado, lo que lo hace ideal tanto para el trading manual como para el automatizado. El "Sistema de Trading Inteligente MT5" es una solución completa de trading diseñada para traders nuevos y experimentados. Combina más de 10 indicadores premium y presenta más de 7 estrategias de trading robustas, lo que lo convierte en una opción versátil para diversas condiciones del merca
                    Atomic Analyst MT5
                    Issam Kassas
                    5 (12)
                    En primer lugar, vale la pena enfatizar que este Indicador de Trading no repinta, no redibuja y no se retrasa, lo que lo hace ideal tanto para el trading manual como para el automatizado. El Analista Atómico es un Indicador de Acción del Precio PA que utiliza la fuerza y el impulso del precio para encontrar una mejor ventaja en el mercado. Equipado con filtros avanzados que ayudan a eliminar ruidos y señales falsas, y aumentan el potencial de trading. Utilizando múltiples capas de indicadores
                    Quantum Trend Sniper
                    Bogdan Ion Puscasu
                    5 (37)
                    Introduciendo       Indicador Quantum Trend Sniper   , el innovador indicador MQL5 que está transformando la forma en que identificas y negocias los cambios de tendencia. Desarrollado por un equipo de comerciantes experimentados con experiencia comercial de más de 13 años,       Indicador de francotirador de tendencia cuántica       está diseñado para impulsar su viaje comercial a nuevas alturas con su forma innovadora de identificar cambios de tendencia con una precisión extremadamente alta.
                    FX Volume MT5
                    Daniel Stein
                    4.94 (17)
                    Obtenga su actualización diaria del mercado con detalles y capturas de pantalla a través de nuestro Morning Briefing aquí en mql5 y en Telegram ! FX Volume es el PRIMER y ÚNICO indicador de volumen que proporciona una visión REAL del sentimiento del mercado desde el punto de vista de un bróker. Proporciona una visión impresionante de cómo los participantes institucionales del mercado, como los brokers, están posicionados en el mercado Forex, mucho más rápido que los informes COT. Ver esta info
                    Trend Screener Pro MT5
                    STE S.S.COMPANY
                    4.87 (62)
                    Desbloquee el poder del comercio de tendencias con el indicador Trend Screener: ¡su solución definitiva para el comercio de tendencias impulsada por lógica difusa y un sistema multidivisa!Mejore su comercio de tendencias con Trend Screener, el revolucionario indicador de tendencias impulsado por lógica difusa. Es un poderoso indicador de seguimiento de tendencias que combina más de 13 herramientas y funciones premium y 3 estrategias comerciales, lo que lo convierte en una opción versátil para co
                    Advanced Supply Demand MT5
                    Bernhard Schweigert
                    4.53 (15)
                    ¡Actualmente con 33% de descuento! ¡La mejor solución para cualquier tráder principiante o experto! Este indicador es una herramienta comercial única, de alta calidad y asequible, porque incorpora una serie de características patentadas y una nueva fórmula. Con esta actualización, podrá mostrar zonas de doble marco temporal. No solo podrá mostrar un marco temporal más alto, sino también mostrar ambos, el marco temporal del gráfico MÁS el marco temporal más alto: MOSTRANDO ZONAS ANIDADAS. A todos
                    Ante todo, vale la pena enfatizar que esta Herramienta de Trading es un Indicador No Repintado, No Redibujado y No Retrasado, lo que la hace ideal para el trading profesional. El Indicador de Conceptos de Acción del Precio Inteligente es una herramienta muy potente tanto para traders nuevos como experimentados. Combina más de 20 indicadores útiles en uno solo, combinando ideas avanzadas de trading como el Análisis del Trader del Círculo Interior y Estrategias de Trading de Conceptos de Dinero
                    MetaForecast M5
                    Vahidreza Heidar Gholami
                    5 (2)
                    MetaForecast predice y visualiza el futuro de cualquier mercado basándose en las armonías de los datos de precios. Aunque el mercado no siempre es predecible, si existe un patrón en el precio, MetaForecast puede predecir el futuro con la mayor precisión posible. En comparación con otros productos similares, MetaForecast puede generar resultados más precisos al analizar las tendencias del mercado. Parámetros de entrada Past size (Tamaño del pasado) Especifica el número de barras que MetaForecas
                    TPSpro TRENDPRO  - is a trend indicator that automatically analyzes the market and provides information about the trend and each of its changes, as well as giving signals for entering trades without redrawing! The indicator uses each candle, analyzing them separately. referring to different impulses - up or down impulse. Exact entry points into transactions for currencies, crypto, metals, stocks, indices!  -  Version MT4                  DETAILED DESCRIPTION        /       TRADING SETUPS       
                    A key element in trading is zones or levels from which decisions to buy or sell a trading instrument are made. Despite attempts by major players to conceal their presence in the market, they inevitably leave traces. Our task was to learn how to identify these traces and interpret them correctly. Reversal First Impulse levels (RFI)   -  Version MT4                  INSTRUCTIONS                 RUS                 ENG                         R ecommended to use with an indicator   -  TREND PRO  
                    AW Trend Predictor MT5
                    AW Trading Software Limited
                    4.76 (55)
                    La combinación de niveles de tendencia y ruptura en un sistema. Un algoritmo de indicador avanzado filtra el ruido del mercado, determina la tendencia, los puntos de entrada y los posibles niveles de salida. Las señales indicadoras se registran en un módulo estadístico, que le permite seleccionar las herramientas más adecuadas, mostrando la efectividad del historial de señales. El indicador calcula las marcas Take Profit y Stop Loss. Manual e instrucciones ->   AQUÍ   / Versión MT4 ->   AQUÍ Có
                    Este es un genial indicador para MT5 que ofrece señales precisas para entrar en una transacción sin redibujar. Se puede aplicar a cualquier activo financiero: fórex, criptomonedas, metales, acciones, índices. Nos dará valoraciones bastante precisas y nos dirá cuándo es mejor abrir y cerra una transacción. Eche un vistazo  al vídeo  (6:22), ¡contiene un ejemplo de procesamiento de una sola señal que ha amortizado el indicador! La mayoría de los tráders mejoran sus resultados comerciales durante l
                    Quantum Heiken Ashi PRO MT5
                    Bogdan Ion Puscasu
                    4.5 (8)
                    Presentamos el   Quantum Heiken Ashi PRO Diseñadas para brindar información clara sobre las tendencias del mercado, las velas Heiken Ashi son reconocidas por su capacidad para filtrar el ruido y eliminar las señales falsas. Diga adiós a las confusas fluctuaciones de precios y dé la bienvenida a una representación gráfica más fluida y confiable. Lo que hace que Quantum Heiken Ashi PRO sea realmente único es su fórmula innovadora, que transforma los datos de velas tradicionales en barras de colore
                    Gartley Hunter Multi
                    Siarhei Vashchylka
                    5 (5)
                    Gartley Hunter Multi - An indicator for searching for harmonic patterns simultaneously on dozens of trading instruments and on all classic timeframes: (m1, m5, m15, m30, H1, H4, D1, Wk, Mn). Manual (Be sure to read before purchasing) | Version for MT4 Advantages 1. Patterns: Gartley, Butterfly, Shark, Crab. Bat, Alternate Bat, Deep Crab, Cypher 2. Simultaneous search for patterns on dozens of trading instruments and on all classic timeframes 3. Search for patterns of all possible sizes. Fr
                    FX Power MT5 NG
                    Daniel Stein
                    5 (5)
                    Obtenga su actualización diaria del mercado con detalles y capturas de pantalla a través de nuestro Morning Briefing aquí en mql5 y en Telegram ! FX Power MT5 NG es la nueva generación de nuestro popular medidor de fuerza de divisas, FX Power. ¿Y qué ofrece este medidor de fuerza de nueva generación? Todo lo que le encantaba del FX Power original PLUS Análisis de fuerza de ORO/XAU Resultados de cálculo aún más precisos Períodos de análisis configurables individualmente Límite de cálculo persona
                    RelicusRoad Pro MT5
                    Relicus LLC
                    4.82 (22)
                    Ahora $ 147 (aumentando a $ 499 después de algunas actualizaciones) - Cuentas ilimitadas (PC o Mac) Manual de usuario de RelicusRoad + Videos de capacitación + Acceso al grupo privado de Discord + Estado VIP UNA NUEVA MANERA DE VER EL MERCADO RelicusRoad es el indicador comercial más poderoso del mundo para divisas, futuros, criptomonedas, acciones e índices, y brinda a los comerciantes toda la información y las herramientas que necesitan para mantenerse rentables. Brindamos análisis téc
                    ICT, SMC, SMART MONEY CONCEPTS, SMART MONEY, Smart Money Concept, Support and Resistance, Trend Analysis, Price Action, Market Structure, Order Blocks, BOS/CHoCH,   Breaker Blocks ,  Momentum Shift,   Supply&Demand Zone/Order Blocks , Strong Imbalance,   HH/LL/HL/LH,    Fair Value Gap, FVG,  Premium  &   Discount   Zones, Fibonacci Retracement, OTE, Buy Side Liquidity, Sell Side Liquidity, BSL/SSL Taken, Equal Highs & Lows, MTF Dashboard, Multiple Time Frame, BigBar, HTF OB, HTF Market Structure
                    Este indicador es una herramienta de transacción única, de alta calidad y asequible porque hemos incorporado una serie de características propias y una fórmula secreta.   Con solo un gráfico, da Alertas para los 28 pares de divisas.   ¡Imagina cómo mejorarás porque puedes identificar el punto de activación exacto de una nueva tendencia u oportunidad de crecimiento! Basado en   nuevos algoritmos subyacentes , hace que sea aún más fácil identificar y confirmar   operaciones potenciales . Esto se d
                    Professional Scalping Tool on Deriv Attention! The indicator will be sold in limited quantities!!! The previous 5 copies were sold for $250 The next 5 copies will be sold for $350 The next price is $500 Description: This trading indicator is designed for professional traders focused on scalping. Designed with the market in mind, it provides highly accurate spike trading signals. It works on the M1 timeframe and supports the following symbols: Boom 300 Index, Boom 500 Index, Boom 1000 Index,
                    Black Dragon indicator mt5
                    Ramil Minniakhmetov
                    4.82 (56)
                    El indicador de detección de tendencias complementará cualquier estrategia y también se puede utilizar como una herramienta independiente. Ventajas Fácil de usar, no sobrecarga el gráfico con información innecesaria; Puede usarse como filtro para cualquier estrategia; Tiene niveles integrados de soporte y resistencia dinámicos, que se pueden usar tanto para obtener ganancias como para establecer límites de pérdidas; El indicador no cambia de color después de que se cierra la vela;  Funciona
                    The Volume by Price Indicator for MetaTrader 5 features Volume Profile and Market Profile TPO (Time Price Opportunity). Get valuable insights out of currencies, equities and commodities data. Gain an edge trading financial markets. Volume and TPO histogram bar and line charts. Volume Footprint charts. TPO letter and block marker charts including split structures. Versatile segmentation and compositing methods. Static, dynamic and flexible ranges with relative and/or absolute visualizations. Lay
                    Blahtech Supply Demand MT5
                    Blahtech Limited
                    4.57 (14)
                    Was: $299  Now: $99   Supply Demand uses previous price action to identify potential imbalances between buyers and sellers. The key is to identify the better odds zones, not just the untouched ones. Blahtech Supply Demand indicator delivers functionality previously unavailable on any trading platform. This 4-in-1 indicator not only highlights the higher probability zones using a multi-criteria strength engine, but also combines it with multi-timeframe trend analysis, previously confirmed swings
                    Italo Volume Indicator MT5
                    Italo Santana Gomes
                    4.73 (15)
                    BUY INDICATOR AND GET EA FOR FREE AS A BONUS + SOME OTHER GIFTS! ITALO VOLUME INDICATOR  is the best volume indicator ever created, and why is that? The Indicator works on all time-frames and assets, indicator built after 7 years of experience on forex and many other markets. You know many volume indicators around the internet are not complete, does not help, and it's difficult to trade, but the Italo Volume Indicator is different , the Italo Volume Indicator shows the wave volume, when market
                    Introduciendo       Quantum Breakout PRO   , el innovador indicador MQL5 que está transformando la forma en que comercia con Breakout Zones. Desarrollado por un equipo de comerciantes experimentados con experiencia comercial de más de 13 años,       Desglose cuántico PRO       está diseñado para impulsar su viaje comercial a nuevas alturas con su innovadora y dinámica estrategia de zona de ruptura. El indicador de ruptura cuántica le dará flechas de señal en las zonas de ruptura con 5 zonas
                    Auto Order Block with break of structure based on ICT and Smart Money Concepts Futures Break of Structure ( BoS )             Order block ( OB )            Higher time frame Order block / Point of Interest ( POI )    shown on current chart           Fair value Gap ( FVG ) / Imbalance   ,  MTF      ( Multi Time Frame )    Volume Imbalance     ,  MTF          vIMB Gap’s Equal High / Low’s     ,  MTF             EQH / EQL Liquidity               Current Day High / Low           HOD /
                    IX Power MT5
                    Daniel Stein
                    5 (2)
                    IX Power   lleva por fin la insuperable precisión de FX Power a los símbolos que no son de Forex. Determina con exactitud la intensidad de las tendencias a corto, medio y largo plazo de tus índices, acciones, materias primas, ETF e incluso criptodivisas favoritas. Puede   analizar todo lo   que su terminal le ofrece. Pruébalo y experimenta cómo   tu timing mejora significativamente   a la hora de operar. Características principales de IX Power Resultados de cálculo 100% precisos y sin rep
                    Good day! I present to you a trading technical indicator for Deriv broker synthetic indices. This indicator ONLY works with the following indices: Boom 300 Index Boom 500 Index Boom 1000 Index Crash 300 Index Crash 500 Index Crash 1000 Index The indicator was created to give signals to open medium-term trades in the direction of Spikes. But you can open trades in the opposite direction to Spikes, at your own risk. Trade only on M1. Other TFs do not guarantee the correct operation of the indic
                    El panel de alertas RSI / TDI le permite monitorear los RSI a la vez (seleccionables por usted) en cada par principal que opere. Puedes usarlo de dos maneras: 1. Seleccione varios marcos de tiempo y el guión le mostrará cuándo hay varios marcos de tiempo que se extienden más allá de las condiciones comerciales normales. Un gran indicador de que el precio ha subido con fuerza recientemente, ya que ha alcanzado un nivel de sobrecompra o sobreventa en múltiples marcos de tiempo, por lo que p
                    Antes que nada, vale la pena enfatizar que este Sistema de Trading es un Indicador No Repintado, No Redibujado y sin Retardos, lo que lo hace ideal para el trading profesional. El "Sistema de Trading de Soporte y Resistencia Inteligente" es un indicador avanzado diseñado para traders nuevos y experimentados. Empodera a los traders con precisión y confianza en el mercado de divisas. Este sistema integral combina más de 7 estrategias, 10 indicadores y varios enfoques de trading, incluyendo estr
                    TrendDecoder Premium MT5
                    Christophe, Pa Trouillas
                    5 (1)
                    Identifique los rangos y los próximos movimientos probables  |  Obtenga las señales más tempranas y la fuerza de las Tendencias   |  Obtener salidas claras antes de reversión   |  Detecte los niveles de Fibo que el precio pondrá a prueba   |  Indicador no repintado y no retardado - ideal para la trading manual y automatizada - adecuado para todos los activos y todas las unidades temporales 69$   para el lanzamiento - luego de nuevo a >>   $ 149 Después de la compra,   póngase en contacto con mi
                    Otros productos de este autor
                    Clusters Chart MT5
                    Evgeny Shevtsov
                    5 (7)
                    The indicator displays volume clusters or volume profiles to choose from. For trading symbols which contain the tape of deals, the indicator can perform calculations based on the tape of deals. Input variables StepPoint  - cluster step in points, if the value is zero, the step is assigned automatically. HistoryTicks  - size of tick history (for VolumeType in the mode TimeAndSales). AssociatedTimeframe  - binding the indicator to the specified timeframe of the chart, if the value is equal to
                    BoxChart MT5
                    Evgeny Shevtsov
                    5 (7)
                    The market is unfair if only because 10% of participants manage 90% of funds. An ordinary trader has slim changes to stand against these "vultures". This problem can be solved. You just need to be among these 10%, learn to predict their intentions and move with them. Volume is the only preemptive factor that faultlessly works on any timeframe and symbol. First, the volume appears and is accumulated, and only then the price moves. The price moves from one volume to another. Areas of volume accumu
                    Cumulative Delta MT5
                    Evgeny Shevtsov
                    4.48 (58)
                    The indicator analyzes the volume scale and splits it into two components - seller volumes and buyer volumes, and also calculates the delta and cumulative delta. The indicator does not flicker or redraw, its calculation and plotting are performed fairly quickly, while using the data from the smaller (relative to the current) periods. The indicator operation modes can be switched using the Mode input variable: Buy - display only the buyer volumes. Sell - display only the seller volumes. BuySell -
                    FREE
                    Cumulative Delta MT4
                    Evgeny Shevtsov
                    4.69 (35)
                    The indicator analyzes the volume scale and splits it into two components - seller volumes and buyer volumes, and also calculates the delta and cumulative delta. The indicator does not flicker or redraw, its calculation and plotting are performed fairly quickly, while using the data from the smaller (relative to the current) periods. The indicator operation modes can be switched using the Mode input variable: Buy - display only the buyer volumes. Sell - display only the seller volumes. BuySell -
                    FREE
                    Smart Depth Of Market
                    Evgeny Shevtsov
                    4.2 (20)
                    The indicator displays the orders book, as well as increases its depth, remembering the location of orders that have gone beyond the current "window" view. Indicator capability Display the levels of open positions. Simulation of placing/cancelling/editing pending orders directly in the displayed orders book. Indicator features The orders book display works only on those trading symbols for which it is broadcast by the broker. To reset the information about the rows that were recorded in the
                    FREE
                    The balance of supply and demand is a simple and effective market analysis method. The supply and demand diagram can show you in advance, even before the trend reversal, where the supply ends and the demand is already emerging, where the demand ends and the supply is emerging, while substantially increasing the probability of making a deal in the right direction and with a high profit factor. Indicator Signals The indicator uses the price/volume values to generate signals: ED – excess demand.
                    BoxProfile MT5
                    Evgeny Shevtsov
                    4.56 (9)
                    The indicator displays volume profiles based on the nesting principle. Profiles periods are pre-set so that each subsequent profile has a length twice as long as the length of the previous profile. In addition to profiles, the indicator displays volume clusters sorted by color, depending on the volume they contain. Indicator operation features The indicator works on typical timeframes from M5 to MN, but for calculations uses historical data from smaller timeframes: M1 - for timeframes from M5
                    FREE
                    AnyProfile MT5
                    Evgeny Shevtsov
                    5 (17)
                    The indicator displays market profiles of any duration in any place on the chart. Simply create a rectangle on the chart and this rectangle will be automatically filled by the profile. Change the size of the rectangle or move it - the profile will automatically follow the changes. Operation features The indicator is controlled directly from the chart window using the panel of buttons and fields for entering parameters. In the lower right corner of the chart window there is a pop-up "AP" but
                    BoxProfile MT4
                    Evgeny Shevtsov
                    4.8 (15)
                    The indicator displays volume profiles based on the nesting principle. Profiles periods are pre-set so that each subsequent profile has a length twice as long as the length of the previous profile. In addition to profiles, the indicator displays volume clusters sorted by color, depending on the volume they contain. Indicator operation features The indicator works on typical timeframes from M5 to MN, but for calculations uses historical data from smaller timeframes: M1 - for timeframes from M5
                    FREE
                    Clusters Chart MT4
                    Evgeny Shevtsov
                    5 (4)
                    The indicator displays volume clusters or volume profiles to choose from. Input variables StepPoint  - cluster step in points, if the value is zero, the step is assigned automatically. AssociatedTimeframe  - binding the indicator to the specified timeframe of the chart, if the value is equal to Current, the indicator works on all timeframes. ClustersVolume  - volume in clusters: All  - all volume. Active  - active volume (which produced the price movement). ClustersAsDelta  - difference betw
                    BoxInside MT5
                    Evgeny Shevtsov
                    5 (4)
                    This indicator calculates the volume profile and places labels that correspond to the VAH, VAL and POC levels, for each candle individually. Indicator operation features The indicator works on the timeframes from M3 to MN, but it uses the history data of smaller periods: M1 - for periods from M3 to H1, M5 - for periods from H2 to H12, M30 - for the D1 period, H4 - for the W1 period, D1 - for the MN period. The color and location of the VAL, VAH and POC labels on the current candle are consider
                    FREE
                    BoxInside MT4
                    Evgeny Shevtsov
                    4.56 (9)
                    This indicator calculates the volume profile and places labels that correspond to the VAH, VAL and POC levels, for each candle individually. Indicator operation features The indicator works on the timeframes from M5 to MN, but it uses the history data of smaller periods: M1 - for periods from M5 to H1, M5 - for the H4 period, M30 - for the D1 period, H4 - for the W1 period, D1 - for the MN period. The color and location of the VAL, VAH and POC labels on the current candle are considered to be
                    FREE
                    FORTS Trading Data
                    Evgeny Shevtsov
                    3.67 (3)
                    The indicator has been designed for use on FORTS, but it can also work on other markets, at brokers broadcasting the required data. A peculiarity of these data is that they cannot be requested from the broker's server as a section of history, but can only be obtained for the current moment. The indicator periodically requests the broker, collects to a file and displays the following history from the stored file: The weighted average price. The volume of buy pending orders. The volume of sell pen
                    FREE
                    The utility refers to probabilistic analysis tools, in particular the Monte Carlo method. The Monte Carlo method is defined as the simulation of processes in purpose to evaluate their probabilistic characteristics and apply them to the solvable task. Operation features The simulation uses a tick model with the subsequent transformation to the candles form, as a model as close as possible to the real market process. The utility generates a stream of a random tick sequence until a result with th
                    AnyProfile MT4
                    Evgeny Shevtsov
                    5 (23)
                    The indicator displays market profiles of any duration in any place on the chart. Simply create a rectangle on the chart and this rectangle will be automatically filled by the profile. Change the size of the rectangle or move it - the profile will automatically follow the changes. Operation features The indicator is controlled directly from the chart window using the panel of buttons and fields for entering parameters. In the lower right corner of the chart window there is a pop-up "AP" butt
                    Neural Predictor MT4
                    Evgeny Shevtsov
                    2 (1)
                    The indicator refers to the means of probabilistic analysis. Prediction is performed by the Monte Carlo method together with a mathematical model of a neuron. But, the modeling of samples for this method is made not artificially, but comes from the original "nature", that is, from history. The number of samples and the detail of their modeling is achieved using the lower (relative current) timeframe. Indicator algorithm : In general terms, the algorithm boils down to the fact that the ind
                    BoxChart MT4
                    Evgeny Shevtsov
                    4.57 (7)
                    The market is unfair if only because 10% of participants manage 90% of funds. An ordinary trader has slim changes to stand against these "vultures". This problem can be solved. You just need to be among these 10%, learn to predict their intentions and move with them. Volume is the only preemptive factor that faultlessly works on any timeframe and symbol. First, the volume appears and is accumulated, and only then the price moves. The price moves from one volume to another. Areas of volume accumu
                    The utility displays the order book, as well as increases its depth, remembering the location of applications that have gone beyond the current "window" view. With the utility user can perform quick trading actions in one click - placing/cancelling/editing of explicit and hidden orders, and also opening/editing positions. Utility features The orders book display works only on those trading symbols for which it is broadcast by the broker. To reset the information about the rows that were record
                    Market Marker MT4
                    Evgeny Shevtsov
                    4.5 (8)
                    The indicator displays peak levels of activity formed by the maximum volume, tracks the correlation of the candles on all timeframes (from the highest to the lowest one). Each volume level is a kind of key trading activity. The most important cluster is inside a month, week, day, hour, etc. Indicator operation features A volume level receives Demand status if the nearest volume level located to the left and above has been broken upwards. A volume level receives Supply status if the nearest vol
                    The indicator calculates volume profiles dynamically and displays the result as VAL, VAH and POC curves. Indicator features The indicator uses the historical data of the lower (relative to the current) timeframes for calculations: M1 - for timeframes up to H1, M5 - for timeframe H1, M15 - for timeframe H4, H1 - for timeframe D1, H4 - for timeframe W1, D1 - for timeframe MN. The color of the DPOC curve sections is determined by comparing the volume of the POC levels of all profiles that make up
                    Market Marker MT5
                    Evgeny Shevtsov
                    3.8 (5)
                    The indicator displays peak levels of activity formed by the maximum volume, tracks the correlation of the candles on all timeframes (from the highest to the lowest one). Each volume level is a kind of key trading activity. The most important cluster is inside a month, week, day, hour, etc. Indicator operation features A volume level receives Demand status if the nearest volume level located to the left and above has been broken upwards. A volume level receives Supply status if the nearest vol
                    The balance of supply and demand is a simple and effective market analysis method. The supply and demand diagram can show you in advance, even before the trend reversal, where the supply ends and the demand is already emerging, where the demand ends and the supply is emerging, while substantially increasing the probability of making a deal in the right direction and with a high profit factor. Indicator signals The indicator uses the price/volume values to generate signals: ED – excess demand.
                    The utility refers to probabilistic analysis tools, in particular the Monte Carlo method. The Monte Carlo method is defined as the simulation of processes in purpose to evaluate their probabilistic characteristics and apply them to the solvable task. Operation features The simulation uses a tick model with the subsequent transformation to the candles form, as a model as close as possible to the real market process. The utility generates a stream of a random tick sequence until a result with t
                    Dynamic POC MT5
                    Evgeny Shevtsov
                    5 (2)
                    The indicator calculates volume profiles dynamically and displays the result as VAL, VAH and POC curves. Indicator features The indicator uses the historical data of the lower (relative to the current) timeframes for calculations: M1 - for timeframes up to H1, M5 - for timeframe H1, M15 - for timeframe H4, H1 - for timeframe D1, H4 - for timeframe W1, D1 - for timeframe MN. The color of the DPOC curve sections is determined by comparing the volume of the POC levels of all profiles that make u
                    The indicator refers to the means of probabilistic analysis. Prediction is performed by the Monte Carlo method together with a mathematical model of a neuron. But, the modeling of samples for this method is made not artificially, but comes from the original "nature", that is, from history. The number of samples and the detail of their modeling is achieved using the lower (relative current) timeframe. Indicator algorithm : In general terms, the algorithm boils down to the fact that the ind
                    Filtro:
                    Oleos
                    29
                    Oleos 2023.10.29 12:52 
                     

                    Отличный индикатор. Для меня было важно считывание данных с ленты. Не виснет. Отражает историю. Множество технических и визуальных настроек. Великолепная поддержка разработчика!

                    kramuse
                    37
                    kramuse 2021.02.03 10:34 
                     

                    Very well tunes indicator. Evgeny's designs are exceptional.

                    Respuesta al comentario
                    Versión 3.2 2023.11.03
                    The indicator is recompiled in MT5 build 4053.
                    Versión 3.1 2023.10.04
                    The indicator is recompiled in MT5 build 4000.
                    Versión 3.0 2023.08.27
                    The menu list of the input variable “Calculation” has been modified :
                    ByEventsOfDeals - volumes are calculated as the number of real deals, without taking into account their volume.
                    BySizesOfDeals – volumes are calculated by real deals, taking into account their volume.
                    ByEventsOfAllTicks – volumes are calculated as the number of price ticks, without taking into account their size.
                    BySizesOfAllTicks – volumes are calculated by price ticks, taking into account their size.
                    ByEventsOfActiveTicks – volumes are calculated as the number of non-overlapped price ticks, without taking into account their size.
                    BySizesOfActiveTicks – volumes are calculated by non-overlapped price ticks, taking into account their size.
                    Versión 2.9 2023.05.21
                    The indicator is recompiled in MT5 build 3742.
                    Versión 2.8 2023.04.26
                    The input variable “HistoryLoadMode”, as a drop-down menu, sets the history loading mode in several options:

                    1. “FromSpecifiedTime” - by the start date/time specified in the input variable “HistoryStartTime”.
                    2. “InMonths” - by the number of months (from the beginning of the month) specified in the input variable “HistoryMonths” (value 0 means from the beginning of the current month).
                    3. “InWeeks” - by the number of weeks (from the beginning of the week) specified in the input variable “HistoryWeeks” (value 0 means from the beginning of the current week).
                    4. “InDays” - by the number of days (from the beginning of the day) specified in the input variable “HistoryDays” (value 0 means from the beginning of the current day).
                    5. “InHours” - by the number of hours (from the beginning of the hour) specified in the input variable “HistoryHours” (value 0 means from the beginning of the current hour).

                    With the advent of the input variable “HistoryLoadMode”, the input variables “Ticks” and “CumulativeStartTime” have been abolished as unnecessary.

                    A new mode “DeltaAsCandles” has been added to the list of “Mode” modes, which displays the delta in the form of candles.

                    The indicator works on history in the strategy tester, as well as when it is called from outside.
                    An example call code is attached on the “Comments” tab.
                    Versión 2.7 2022.11.29
                    The indicator is recompiled in MT5 build 3521.
                    Versión 2.6 2022.05.04
                    The indicator is recompiled in MT5 build 3280.
                    Versión 2.5 2021.10.19
                    The indicator is recompiled in MT5 build 3082.
                    Versión 2.4 2021.09.16
                    The indicator is recompiled in MT5 build 3035.
                    Versión 2.3 2021.06.07
                    The indicator is recompiled in MT5 build 2946.
                    Versión 2.2 2021.03.31
                    The input variable CumulativeReset sets the frequency of zeroing the cumulative delta.
                    The indicator is compiled in MT5 build 2860.
                    Versión 2.1 2020.12.01
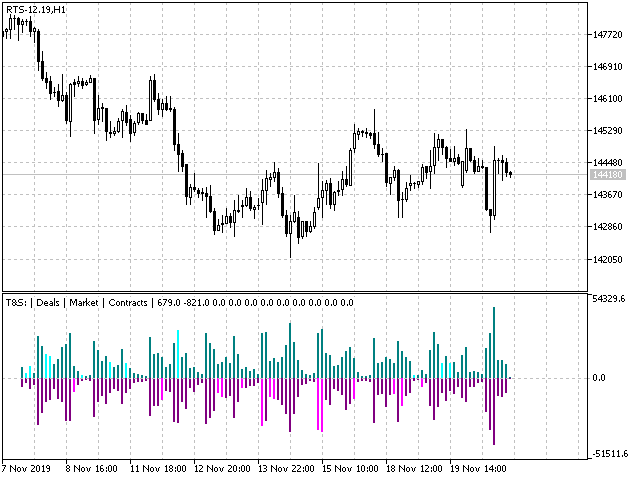
                    The Delta item of the input variable Mode now has two options:
                    - DeltaUpOnly - the delta columns are directed only up, regardless of the delta sign.
                    - DeltaUpAndDown - the delta columns are directed up and down, depending of the delta sign.

                    The indicator is compiled in MT5 build 2715.
                    Versión 2.0 2020.10.16
                    The indicator is recompiled in MT5 build 2650.
                    Versión 1.9 2020.07.14
                    The indicator is recompiled in MT5 build 2530.
                    Versión 1.8 2020.04.13
                    The display of the levels grid is activated using the input variable Levels.
                    The color for levels grid is assigned using the input variable LevelsColor.
                    When the color value is set to None, the levels grid takes the grid color of the chart window.
                    Versión 1.7 2019.11.30
                    If the input variable Ticks is set to zero, the history duration is assigned automatically.
                    Versión 1.6 2019.11.25
                    Added dimension grid display.
                    In addition to the seconds timeframes, the calculated timeframe can be selected from the entire set of timeframes available in the terminal.
                    Versión 1.5 2019.11.20
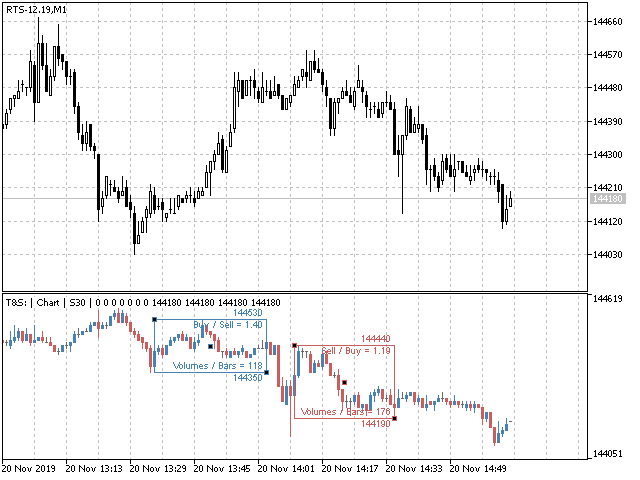
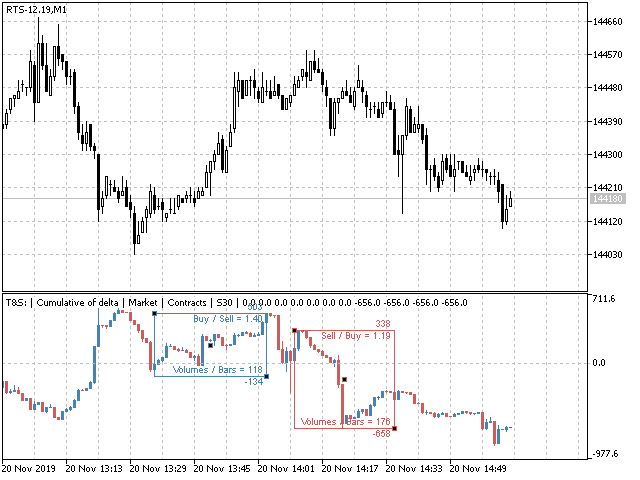
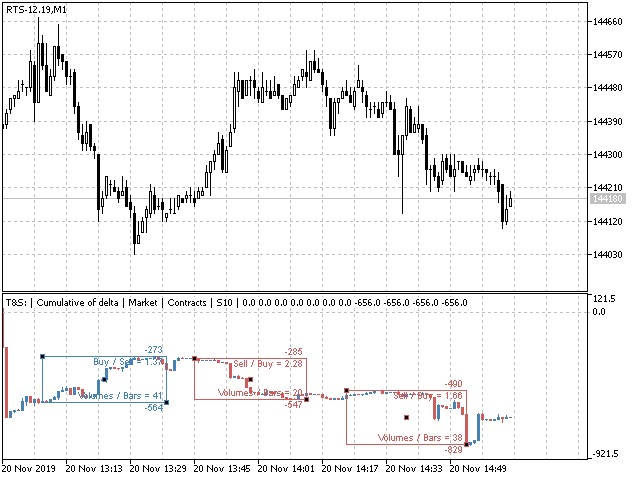
                    In addition to the standard timeframes, the indicator displays data regarding the second timeframes to choose from using the input variable Timeframe (S5, S10, S15, S20, S30).
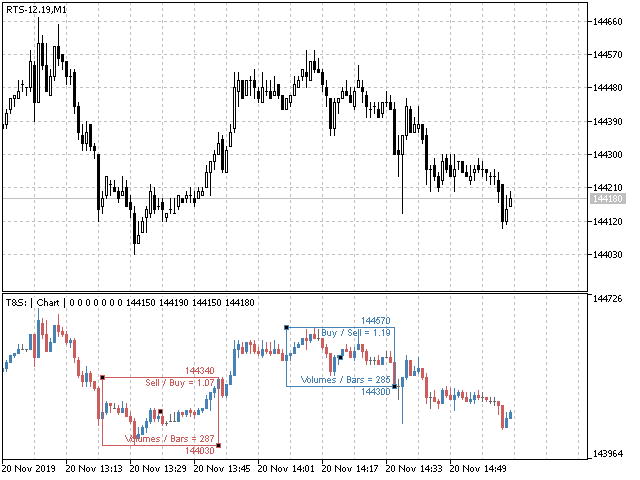
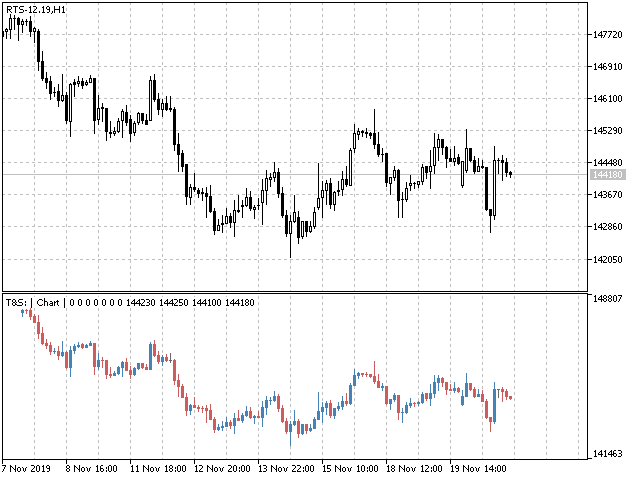
                    To the list of modes of the input variable Mode has been added new mode Chart, which displays a price chart in the form of candles.
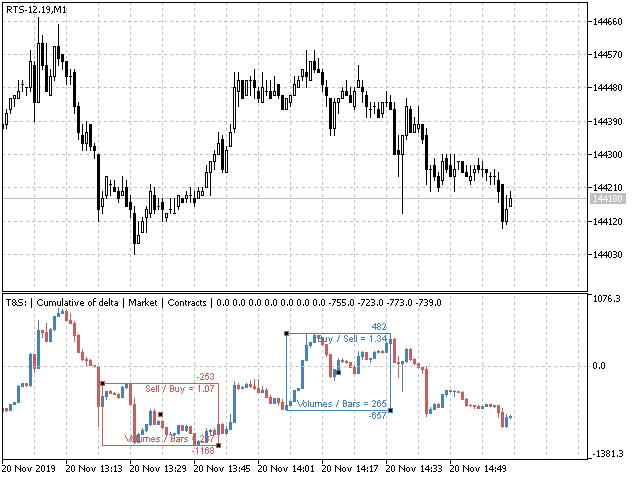
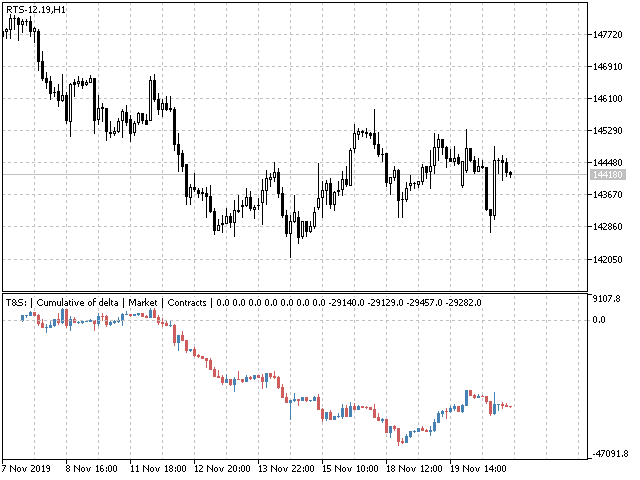
                    Cumulative delta with no period is now displayed as candles, but cumulative delta with a preset period CumulativePeriod is displayed only as curve.
                    The selection rectangle should now be applied directly to the indicator subwindow, and its function is active only in the modes Mode=Chart or Mode=CumDelta.
                    Note: For second timeframes it is recommended to set the input variable RecalculationTiming to a value smaller than displayed timeframe.
                    Versión 1.4 2019.10.31
                    For trading symbols that have the tick history without the content of the list of deals, an interpretation algorithm is created:
                    Each positive Ask tick is interpreted as the unit of volume to buy.
                    Each negative Bid tick is interpreted as the unit of volume to sell.
                    This algorithm works in the mode Calculation=Interpretation and is relevant mainly for currency pairs.
                    Versión 1.3 2019.02.10
                    Added a painting of the indicator histogram for candles whose direction is opposite to their delta.
                    Versión 1.2 2019.02.03
                    The recalculation timing can be set by the user arbitrarily in seconds using the input variable RecalculationTiming.