NewsCatcher Visual MT5
- Asesores Expertos
- Evgeniy Scherbina
- Versión: 3.4
- Actualizado: 16 febrero 2021
- Activaciones: 20
The advisor NewsCatcher Visual automatically downloads actual data from the mql5.com calendar. The advisor can work in the "autoclick" mode, that is it can open trades automatically by comparing actual and forecast values. It also allows to manually open both instant and pending orders with a set volume.
Recommendations
By default the advisor NewsCatcher Visual applies the "autoclick" strategy to all events of high volatility. This allows the advisor to work in the fully automatic mode. However, this is not the most profitable approach in trading on economic data. You should take a look at events on a weekly basis and choose the events of high volatility. Such events are: CPI, GDP, Employment Change, Claimant Count, Nonfarm Payrolls and some others. You need to add an event to the autoclick only once, the advisor will remember your choice and work with this event in the future.
The Advisor Properties
Auto Click - switches on the automatic trading mode.
Color preset - you can choose among 3.
Fontsize
Pending orders follow price - click the pending button in the chart 15 minutes before any event for the advisor to open 2 pending stop-orders and relate them to that event. The advisor pushes these pending orders according to the current price. Following the price is stopped 10 seconds before the actual event time.
Step for pending orders - a distance from the current price for pending orders.
Takeprofit
Trail
Stoploss
Volume - a volume as a percentage of the available equity (example: 0.025%) or a fixed volume (example: 0.03).
Testing mode - set it to Demo_Calendar to see a demonstration of the advisor. Test result are of random nature for this mode. To do a test with a real calendar you need to download a week calendar at the end of a week. It is a somewhat long method, but there is nothing else available right now.
Zero auto - a number of minutes after which the advisor tries to set a stoploss at the open price line.
Notes for the buttons in the chart
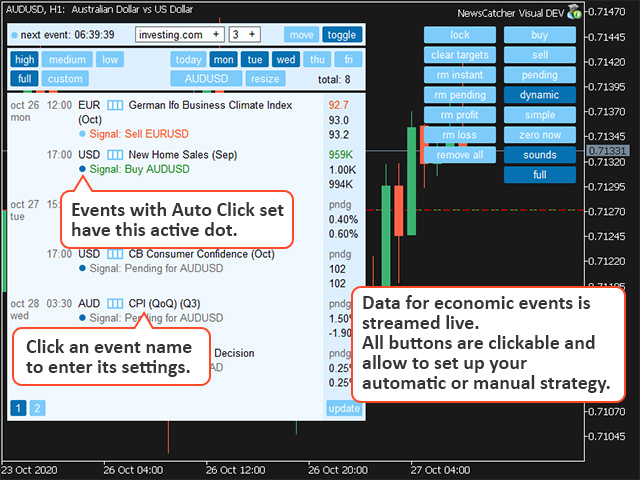
buy - opens a buy in the current symbol.
sell - opens a sell in the current symbol.
pending - opens 2 pending stop-orders from the current price. Pending orders may follow the price if the property Pending orders follow price is set to true.
dynamic - switches on a dynamic trail.
simple - switches a simple trail.
zero now - sets a stoploss at the open price line as soon as it is possible.
sounds - activates sounds.
lock - locks all actions in the column to the symbol of the current chart.
clear targets - removes all target levels.
rm instant - closes all instant orders.
rm pending - closes all pending orders.
rm profit - closes all profitable trades.
rm loss - closes all losing trades.
remove all - closes all instant and pending orders.
Click a symbol button in the advisor panel to quickly go to its chart.
Click an event name in the advisor panel to open its additional settings: adding to the custom calendar, adding to the autoclick mode, and choosing a symbol.
The dot next to the "next event" time blinks when the advisor refreshes data. It refreshes oftener when an event time approaches.
The dot next to an event signal can be active (autoclick is on for this event) or inactive (autoclick is off).

