MTF Coefficient Strength
- Indicadores
- Richard Jehl
- Versión: 1.2
- Activaciones: 10
MTF Coefficient Strength is a Currency Strength Indicator based on RSI. It gives the strength of the 8 major currencies. What makes this indicator different from similar products are the following features :
Parameters
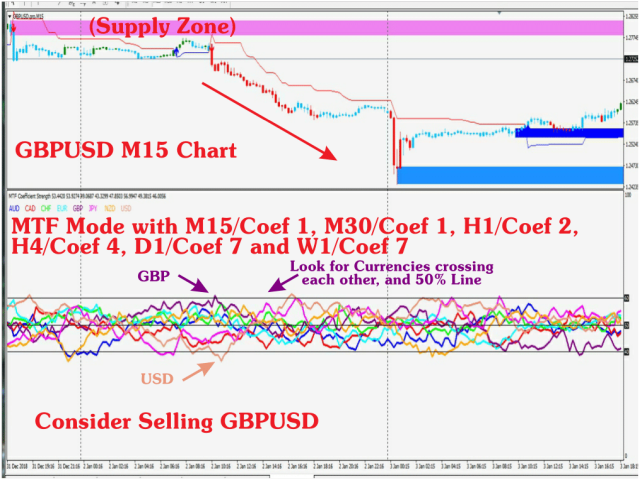
- Choice between Classical Mode and Multi-Timeframe Mode. The MTF (Multi-Timeframe) Mode uses an averaging of the values coming from the different Timeframes.
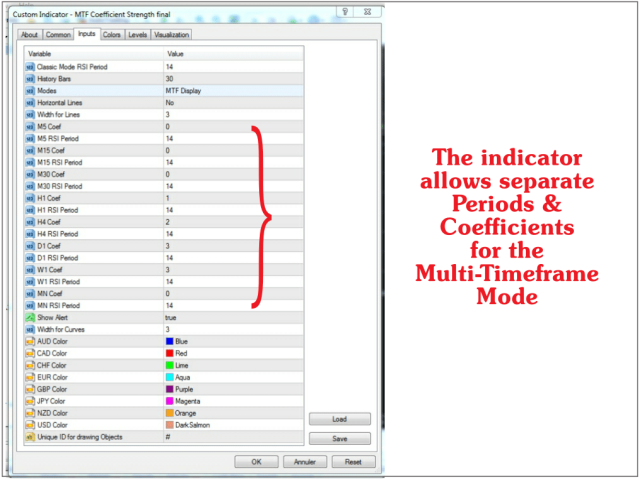
- Possibility to use a Coefficient for each Timeframe separately.
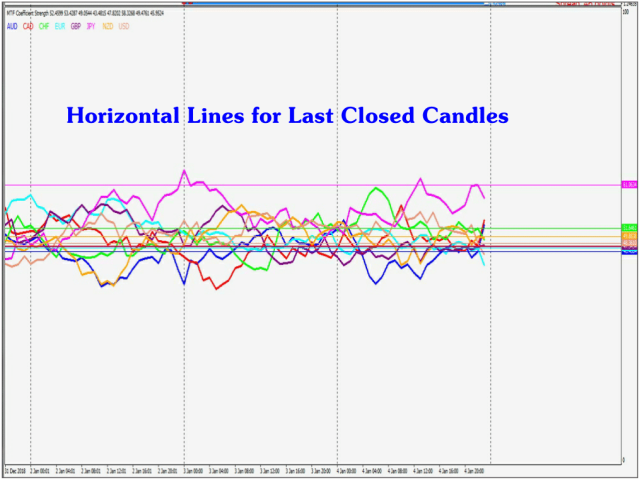
- Possibility to draw Horizontal Lines in order to quickly compare levels of the last closed candle.
- Possibility to use distinct RSI Period for each Timeframe.
- The indicator works correctly with accounts with suffixes, which is not always the case for similar indicators (even when curves are displayed).
- An alert allows to check if enough data is downloaded about the 28 pairs. This is needed in order to have the indicator displaying correct values.
Before using the indicator, please make sure you have all the needed data downloaded on your platform (history for the 28 pairs).
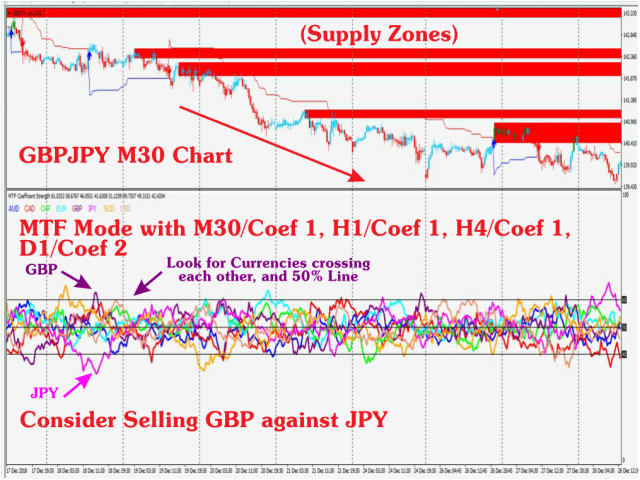
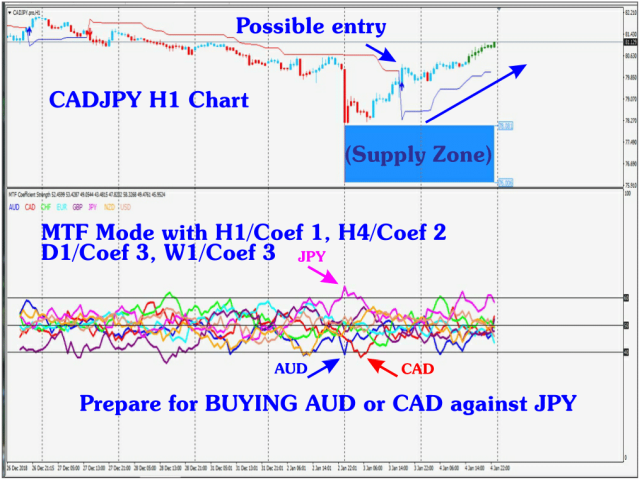
There are several ways of using a Currency Strength Indicator. These can be summarized in the following way :
- Preparing to a reversal when opposite extremes have been reached by 2 different currencies about at the same time.
- Considering the simultaneous crossing of 2 currencies, and trade in the direction of the cross.
- Considering crossing of the 50% level line, and trade according to what the cross suggests.
In all cases, a successful strategy must filter entries. SL, TP and money management have also to be clearly defined.
Parameters
- Classic Mode RSI Period (only applies for Classic Mode)
- History Bars
- Mode (Classic or Multi-Timeframe). In the MTF Mode, the Chart-Timeframe the curves are displayed on, is the one corresponding to the lowest Timeframe taken into consideration for the calculations.
- Horizontal Lines (enable/disable). Applicable only in Multi-Timeframe Mode
- Width for Lines
- Coefficient for each Timeframe separately (only in Multi-Timeframe Mode). If 0 is entered then the Timeframe is not taken into consideration for the calculations.
- RSI Period for each Timeframe separately (only in Multi-Timeframe Mode)
- Show Alert (yes/no)
- Width for Curves
- Color for each Currency
- Unique ID to be used if other indicators draw objects on the same chart, or if several instances are used
